“America runs on Dunkin’” is a familiar slogan. And there might be some truth to that if you look at its footprint. Dunkin’ — the company formally dropped “Donuts” from its name in 2019 to appeal to more health-conscious consumers — has the highest number of locations in the most states compared with other large fast-food brands. However, unlike other major chains, it only has a presence in 43 of the 50 states. (This is the best doughnut shop in every state.)
Which of those 43 have the most Dunkin’ outlets? To determine that, 24/7 Tempo reviewed data collected by NiceRx, a patient assistance program and medication access company, using numbers for total fast-food restaurants taken from the U.S. Census Bureau and tracking the nation’s ten most popular chains as determined by ScrapeHero.com. (Population figures are five-year estimates from the U.S. Census Bureau’s 2019 American Community Survey.) We then ranked the states by their per capita Dunkin’ population per 100,000 residents, lowest to highest.
Click here to see the Dunkin’ capitals of America
Dunkin’ is headquartered in Canton, Massachusetts, so it should come as no surprise to learn that it has a dominant position in the Northeast in general and New England in particular. It has 16.3 locations per 100,000 residents in the Bay State. However, it has even more in neighboring Rhode Island, which tops our list with 16.4 locations.
Next come New Hampshire, with 16.2 Dunkin’ restaurants per 100,000 residents, Connecticut with 14.4, and Maine with 12.2. Canadian rival Tim Hortons, which is now owned by Burger King, closed dozens of locations in the Northeast a decade ago, citing tough competition from Dunkin’. (These are the most successful restaurant chains in America.)

43. Wyoming
> All Dunkin’ restaurants per 100K people: 0.2
> Total Dunkin’ restaurants: 1 — the lowest
> Total population in 2019: 578,759 — the lowest
[in-text-ad]

42. Alaska
> All Dunkin’ restaurants per 100K people: 0.3
> Total Dunkin’ restaurants: 2 — 2nd lowest
> Total population in 2019: 731,545 — 3rd lowest
41. Mississippi
> All Dunkin’ restaurants per 100K people: 0.3
> Total Dunkin’ restaurants: 9 — 3rd lowest
> Total population in 2019: 2,976,149 — 13th lowest

40. Arkansas
> All Dunkin’ restaurants per 100K people: 0.3
> Total Dunkin’ restaurants: 9 — 4th lowest
> Total population in 2019: 3,017,804 — 14th lowest
[in-text-ad-2]

39. Oklahoma
> All Dunkin’ restaurants per 100K people: 0.3
> Total Dunkin’ restaurants: 12 — 6th lowest
> Total population in 2019: 3,956,971 — 18th lowest

38. Louisiana
> All Dunkin’ restaurants per 100K people: 0.3
> Total Dunkin’ restaurants: 14 — 7th lowest
> Total population in 2019: 4,648,794 — 20th lowest
[in-text-ad]

37. California
> All Dunkin’ restaurants per 100K people: 0.3
> Total Dunkin’ restaurants: 119 — 17th highest
> Total population in 2019: 39,512,223 — the highest

36. Minnesota
> All Dunkin’ restaurants per 100K people: 0.5
> Total Dunkin’ restaurants: 28 — 12th lowest
> Total population in 2019: 5,639,632 — 21st highest

35. Texas
> All Dunkin’ restaurants per 100K people: 0.6
> Total Dunkin’ restaurants: 174 — 14th highest
> Total population in 2019: 28,995,881 — 2nd highest
[in-text-ad-2]

34. Hawaii
> All Dunkin’ restaurants per 100K people: 0.8
> Total Dunkin’ restaurants: 11 — 5th lowest
> Total population in 2019: 1,415,872 — 8th lowest

33. New Mexico
> All Dunkin’ restaurants per 100K people: 0.8
> Total Dunkin’ restaurants: 17 — 8th lowest
> Total population in 2019: 2,096,829 — 11th lowest
[in-text-ad]

32. Colorado
> All Dunkin’ restaurants per 100K people: 0.8
> Total Dunkin’ restaurants: 46 — 17th lowest
> Total population in 2019: 5,758,736 — 20th highest

31. Missouri
> All Dunkin’ restaurants per 100K people: 0.8
> Total Dunkin’ restaurants: 49 — 18th lowest
> Total population in 2019: 6,137,428 — 17th highest

30. Michigan
> All Dunkin’ restaurants per 100K people: 0.8
> Total Dunkin’ restaurants: 80 — 22nd lowest
> Total population in 2019: 9,986,857 — 10th highest
[in-text-ad-2]

29. Nevada
> All Dunkin’ restaurants per 100K people: 0.9
> Total Dunkin’ restaurants: 28 — 11th lowest
> Total population in 2019: 3,080,156 — 15th lowest

28. Kentucky
> All Dunkin’ restaurants per 100K people: 0.9
> Total Dunkin’ restaurants: 40 — 15th lowest
> Total population in 2019: 4,467,673 — 19th lowest
[in-text-ad]
27. Alabama
> All Dunkin’ restaurants per 100K people: 0.9
> Total Dunkin’ restaurants: 44 — 16th lowest
> Total population in 2019: 4,903,185 — 21st lowest

26. Nebraska
> All Dunkin’ restaurants per 100K people: 1.0
> Total Dunkin’ restaurants: 19 — 9th lowest
> Total population in 2019: 1,934,408 — 10th lowest

25. Kansas
> All Dunkin’ restaurants per 100K people: 1.0
> Total Dunkin’ restaurants: 29 — 13th lowest
> Total population in 2019: 2,913,314 — 12th lowest
[in-text-ad-2]
24. Iowa
> All Dunkin’ restaurants per 100K people: 1.0
> Total Dunkin’ restaurants: 32 — 14th lowest
> Total population in 2019: 3,155,070 — 16th lowest
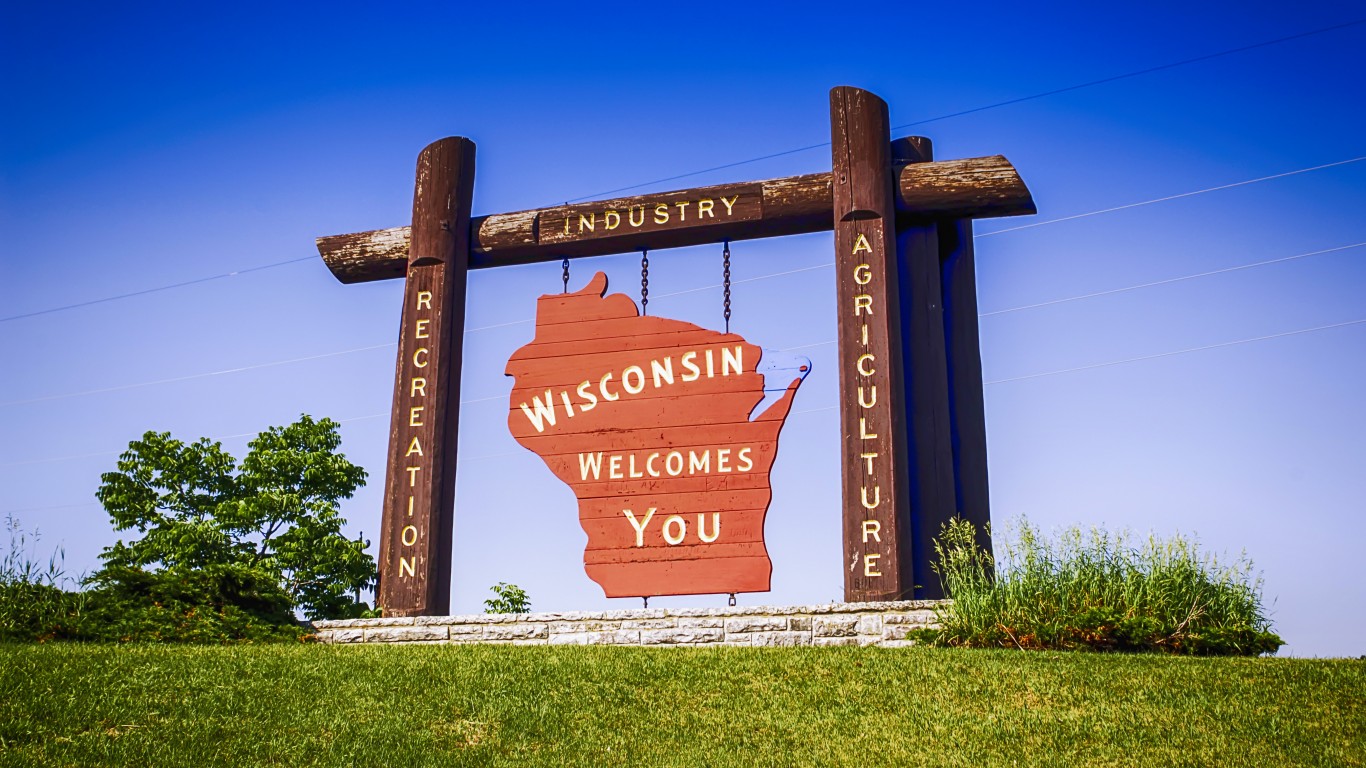
23. Wisconsin
> All Dunkin’ restaurants per 100K people: 1.2
> Total Dunkin’ restaurants: 70 — 21st lowest
> Total population in 2019: 5,822,434 — 19th highest
[in-text-ad]

22. West Virginia
> All Dunkin’ restaurants per 100K people: 1.3
> Total Dunkin’ restaurants: 23 — 10th lowest
> Total population in 2019: 1,792,147 — 9th lowest

21. Indiana
> All Dunkin’ restaurants per 100K people: 1.3
> Total Dunkin’ restaurants: 88 — 21st highest
> Total population in 2019: 6,732,219 — 16th highest
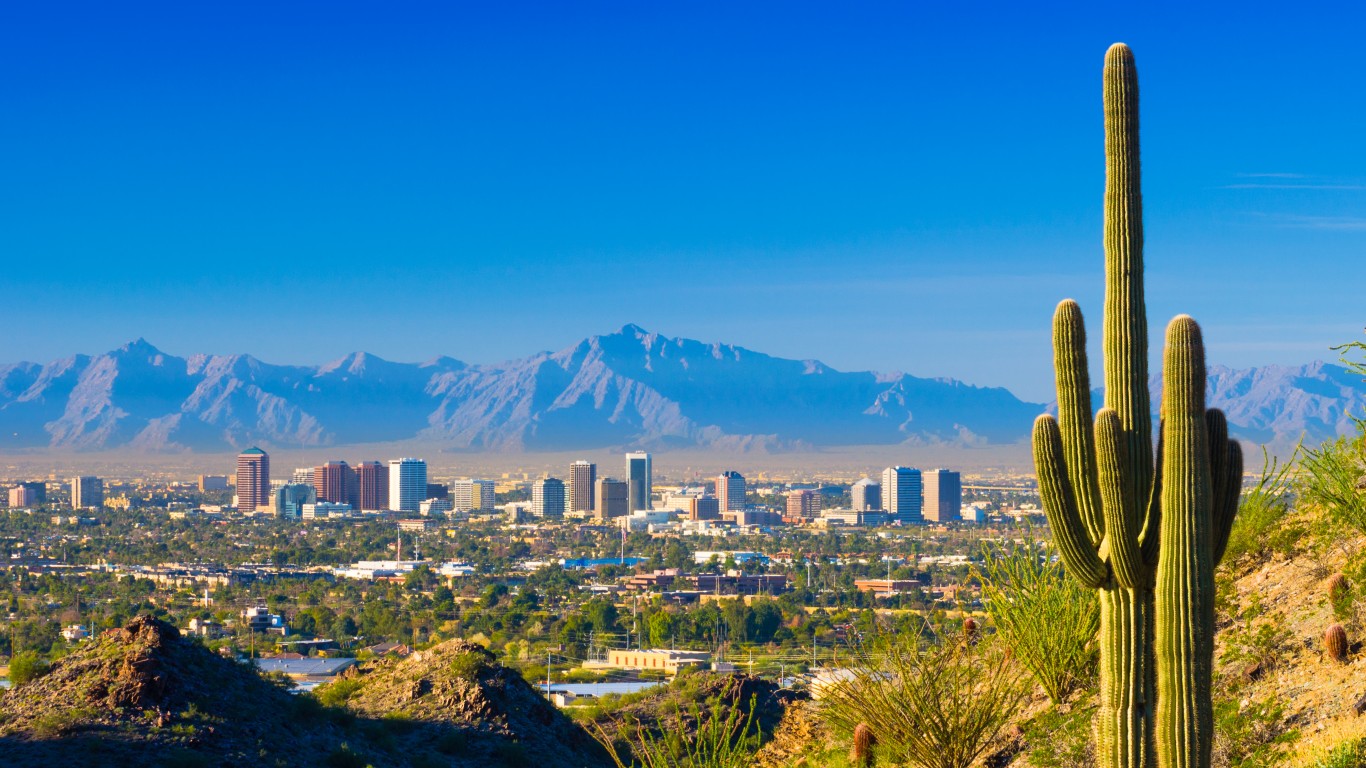
20. Arizona
> All Dunkin’ restaurants per 100K people: 1.3
> Total Dunkin’ restaurants: 95 — 20th highest
> Total population in 2019: 7,278,717 — 13th highest
[in-text-ad-2]

19. Tennessee
> All Dunkin’ restaurants per 100K people: 1.6
> Total Dunkin’ restaurants: 109 — 18th highest
> Total population in 2019: 6,829,174 — 15th highest

18. Ohio
> All Dunkin’ restaurants per 100K people: 1.9
> Total Dunkin’ restaurants: 222 — 11th highest
> Total population in 2019: 11,689,100 — 7th highest
[in-text-ad]
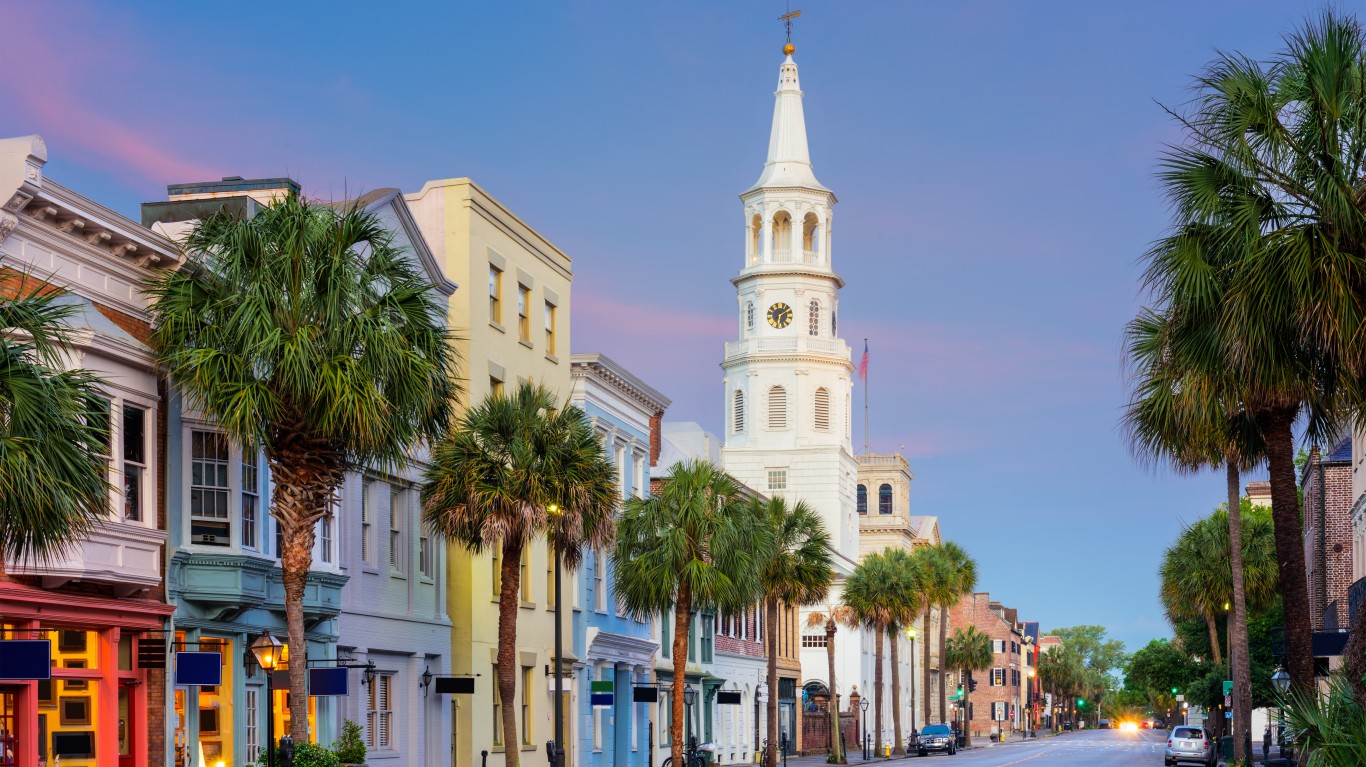
17. South Carolina
> All Dunkin’ restaurants per 100K people: 2.0
> Total Dunkin’ restaurants: 103 — 19th highest
> Total population in 2019: 5,148,714 — 22nd lowest

16. North Carolina
> All Dunkin’ restaurants per 100K people: 2.0
> Total Dunkin’ restaurants: 210 — 13th highest
> Total population in 2019: 10,488,084 — 9th highest

15. Georgia
> All Dunkin’ restaurants per 100K people: 2.2
> Total Dunkin’ restaurants: 234 — 10th highest
> Total population in 2019: 10,617,423 — 8th highest
[in-text-ad-2]

14. Virginia
> All Dunkin’ restaurants per 100K people: 2.8
> Total Dunkin’ restaurants: 239 — 9th highest
> Total population in 2019: 8,535,519 — 12th highest
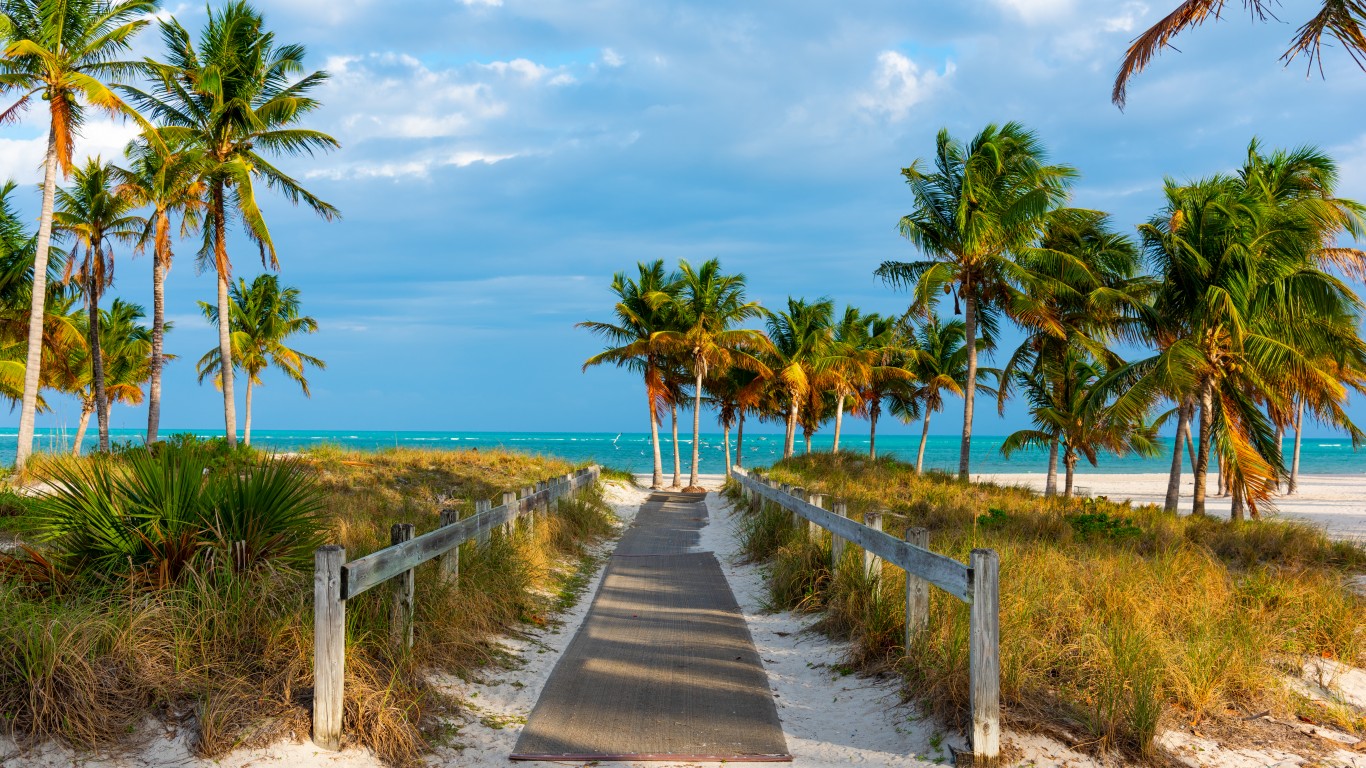
13. Florida
> All Dunkin’ restaurants per 100K people: 4.1
> Total Dunkin’ restaurants: 881 — 4th highest
> Total population in 2019: 21,477,737 — 3rd highest
[in-text-ad]
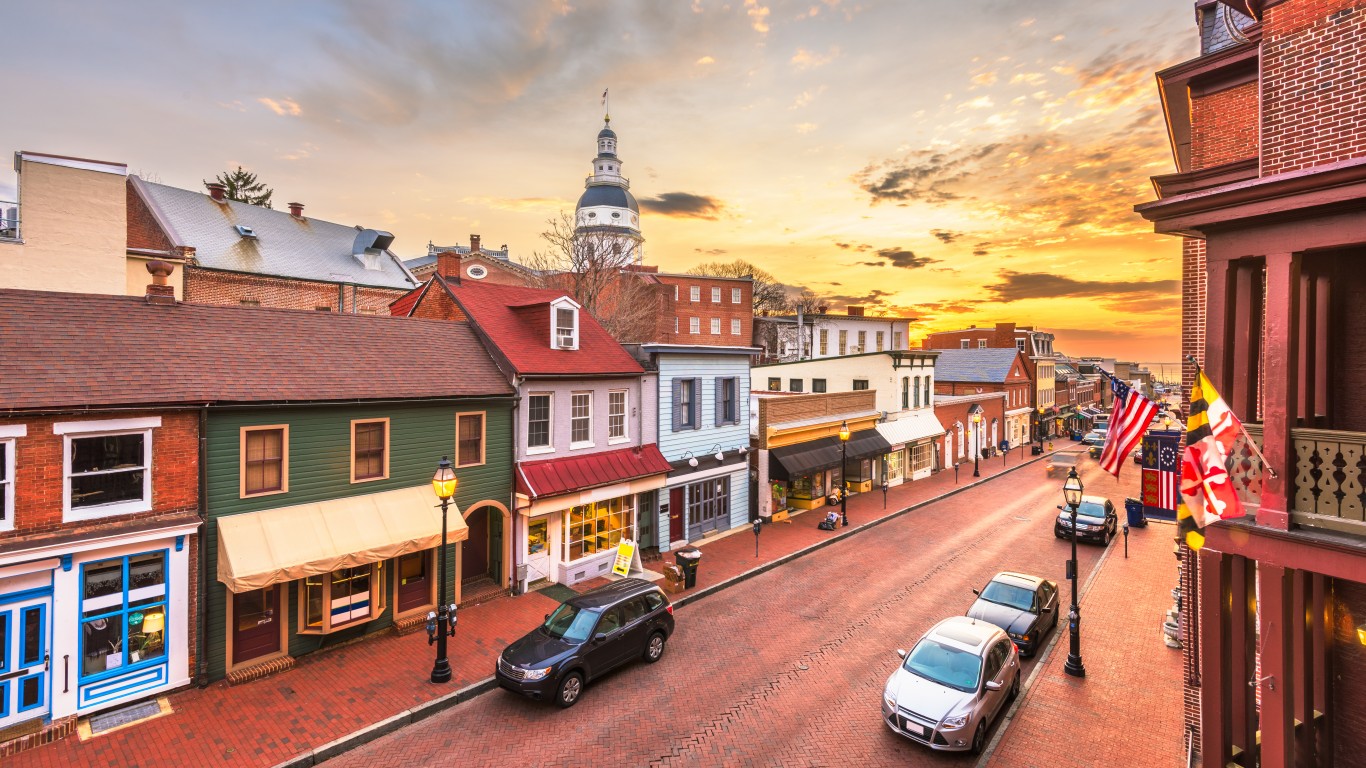
12. Maryland
> All Dunkin’ restaurants per 100K people: 4.7
> Total Dunkin’ restaurants: 284 — 8th highest
> Total population in 2019: 6,045,680 — 18th highest

11. Pennsylvania
> All Dunkin’ restaurants per 100K people: 5.1
> Total Dunkin’ restaurants: 653 — 6th highest
> Total population in 2019: 12,801,989 — 5th highest

10. Illinois
> All Dunkin’ restaurants per 100K people: 5.5
> Total Dunkin’ restaurants: 697 — 5th highest
> Total population in 2019: 12,671,821 — 6th highest
[in-text-ad-2]

9. Delaware
> All Dunkin’ restaurants per 100K people: 7.1
> Total Dunkin’ restaurants: 69 — 20th lowest
> Total population in 2019: 973,764 — 4th lowest

8. New York
> All Dunkin’ restaurants per 100K people: 7.6
> Total Dunkin’ restaurants: 1478 — the highest
> Total population in 2019: 19,453,561 — 4th highest
[in-text-ad]

7. Vermont
> All Dunkin’ restaurants per 100K people: 8.2
> Total Dunkin’ restaurants: 51 — 19th lowest
> Total population in 2019: 623,989 — 2nd lowest

6. New Jersey
> All Dunkin’ restaurants per 100K people: 10.1
> Total Dunkin’ restaurants: 897 — 3rd highest
> Total population in 2019: 8,882,190 — 11th highest

5. Maine
> All Dunkin’ restaurants per 100K people: 12.2
> Total Dunkin’ restaurants: 164 — 16th highest
> Total population in 2019: 1,344,212 — 6th lowest
[in-text-ad-2]

4. Connecticut
> All Dunkin’ restaurants per 100K people: 14.4
> Total Dunkin’ restaurants: 513 — 7th highest
> Total population in 2019: 3,565,287 — 17th lowest
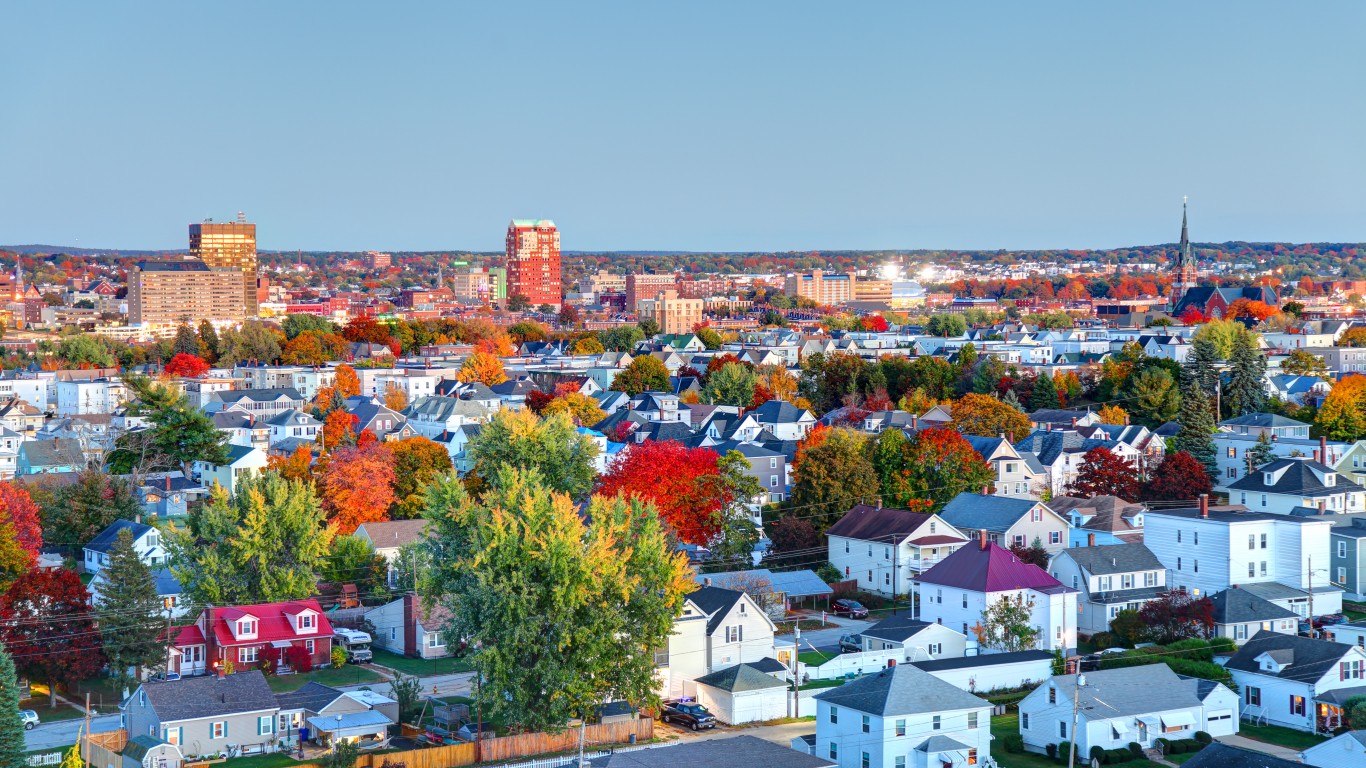
3. New Hampshire
> All Dunkin’ restaurants per 100K people: 16.2
> Total Dunkin’ restaurants: 220 — 12th highest
> Total population in 2019: 1,359,711 — 7th lowest
[in-text-ad]

2. Massachusetts
> All Dunkin’ restaurants per 100K people: 16.3
> Total Dunkin’ restaurants: 1123 — 2nd highest
> Total population in 2019: 6,892,503 — 14th highest

1. Rhode Island
> All Dunkin’ restaurants per 100K people: 16.4
> Total Dunkin’ restaurants: 174 — 15th highest
> Total population in 2019: 1,059,361 — 5th lowest
100 Million Americans Are Missing This Crucial Retirement Tool
The thought of burdening your family with a financial disaster is most Americans’ nightmare. However, recent studies show that over 100 million Americans still don’t have proper life insurance in the event they pass away.
Life insurance can bring peace of mind – ensuring your loved ones are safeguarded against unforeseen expenses and debts. With premiums often lower than expected and a variety of plans tailored to different life stages and health conditions, securing a policy is more accessible than ever.
A quick, no-obligation quote can provide valuable insight into what’s available and what might best suit your family’s needs. Life insurance is a simple step you can take today to help secure peace of mind for your loved ones tomorrow.
Click here to learn how to get a quote in just a few minutes.
Thank you for reading! Have some feedback for us?
Contact the 24/7 Wall St. editorial team.
 24/7 Wall St.
 24/7 Wall St.
 24/7 Wall St.

