Unusual weather and temperatures, especially heat, are key indicators of climate change. Climate change’s effects on the natural world and the human environment are most consequential to life on Earth. While there have been unusually cold winters in recent years, they have become less common. Much of the unusual weather tends to be hotter.
It is no secret that the planet is warming, and that the warming has happened more rapidly in recent years, with eight of the hottest 10 years on record in the contiguous United States occurring since 1998, according to the Environmental Protection Agency. (See how global warming is affecting every state.)
From January to September of this year, the average temperature of the lower 48 states was 1.9 degrees Fahrenheit hotter than the 20th century average. The month of September was particularly warm, measuring 3 degrees warmer than the 20 century average, making it the fifth warmest on record.
This past September, the Midwest, the Plains states, the Great Lakes region, and New England experienced some of the most unusually high temperatures.
To identify the U.S. cities with the most unusual weather this September, 24/7 Wall St. reviewed the National Climate Report – September 2021 released by the National Oceanic and Atmospheric Administration’s National Centers for Environmental Information.
The report included the average September temperature for 1901-2000 for U.S. cities. 24/7 Wall St. ranked cities based on the difference between their average temperature in September 2021 and their 20th-century average. Though cities with colder than usual temperatures were considered, all of the cities on the list happened to have hotter than normal Septembers.
A single month is not an indicator of a trend or pattern, but divergence from longer term trends highlight the capriciousness of weather as the planet warms, as exemplified by the September data.
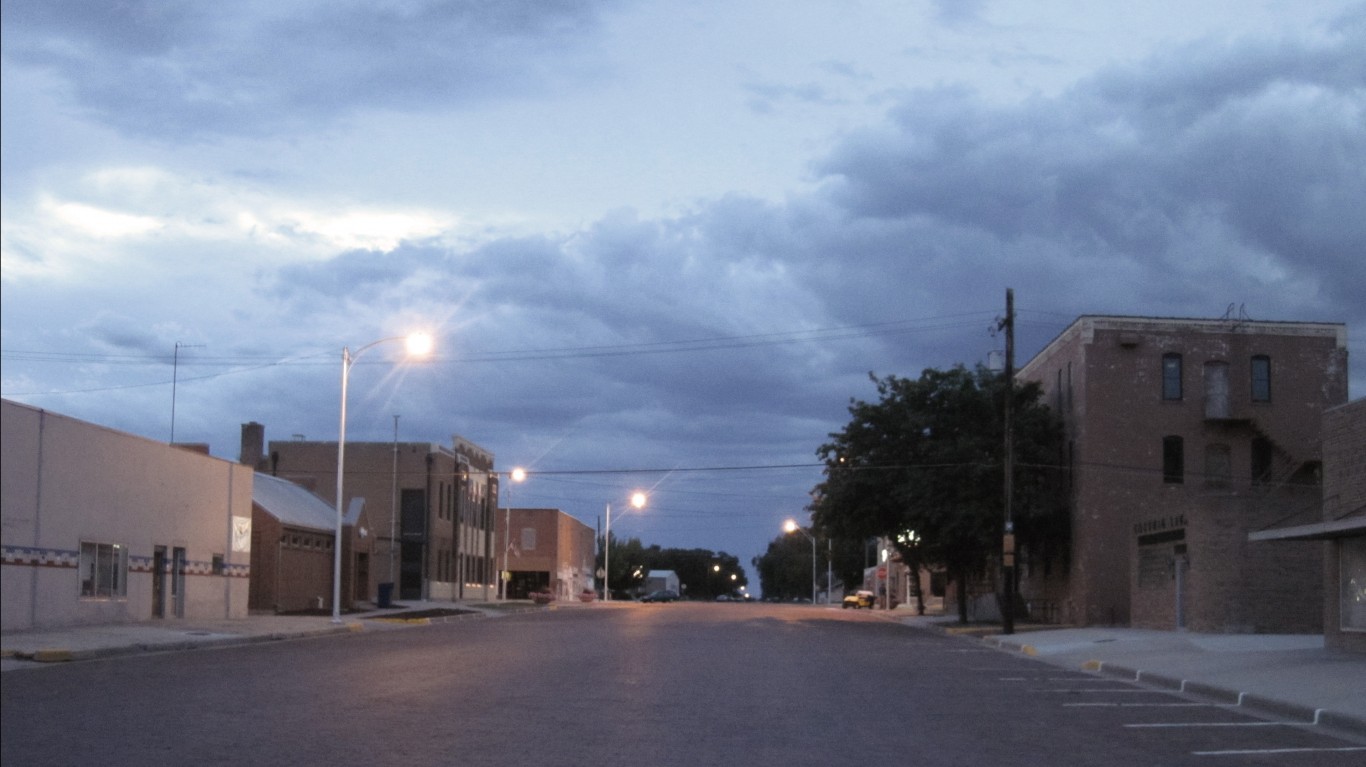
The two most extreme increases from average temperatures — 7.8 degrees in the case of Grand Forks, North Dakota, and 7.2 degrees in Goodland, Kansas — occurred in regions where the incidence of unusually hot days had decreased over the last 70 years. (This is the coldest town in every state.)
Here are the 25 U.S. cities with the greatest increases in average September temperatures.
Click here to see the US cities with the most unusual weather this year

25. Las Vegas, Nevada
> Avg. temperature, Sept. 2021: 86.3 °F
> Change from avg. Sept. temperature, 1901-2000: +5.2
> Hottest September on record: 2018 (Avg temperature: 87.7 °F)
[in-text-ad]
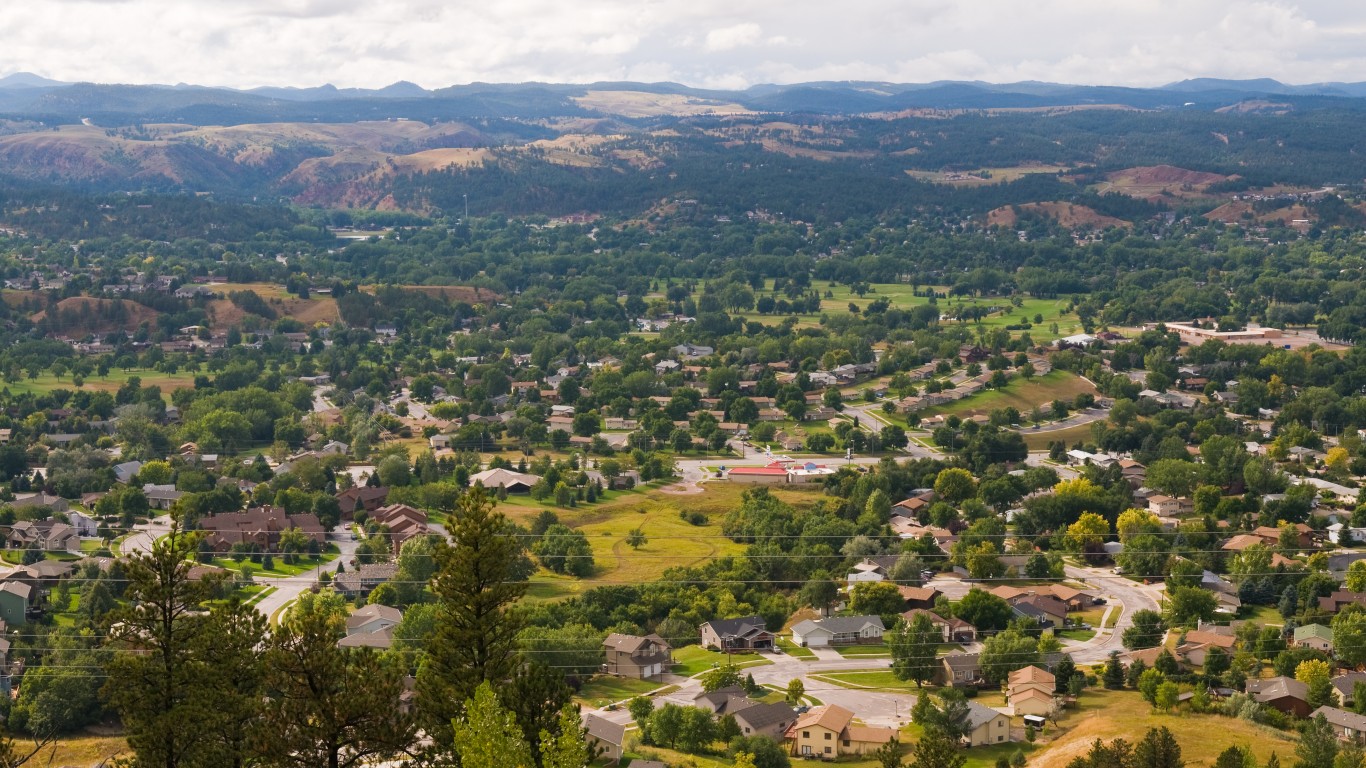
24. Rapid City, South Dakota
> Avg. temperature, Sept. 2021: 65.2 °F
> Change from avg. Sept. temperature, 1901-2000: +5.3
> Hottest September on record: 1998 (Avg temperature: 67.2 °F)
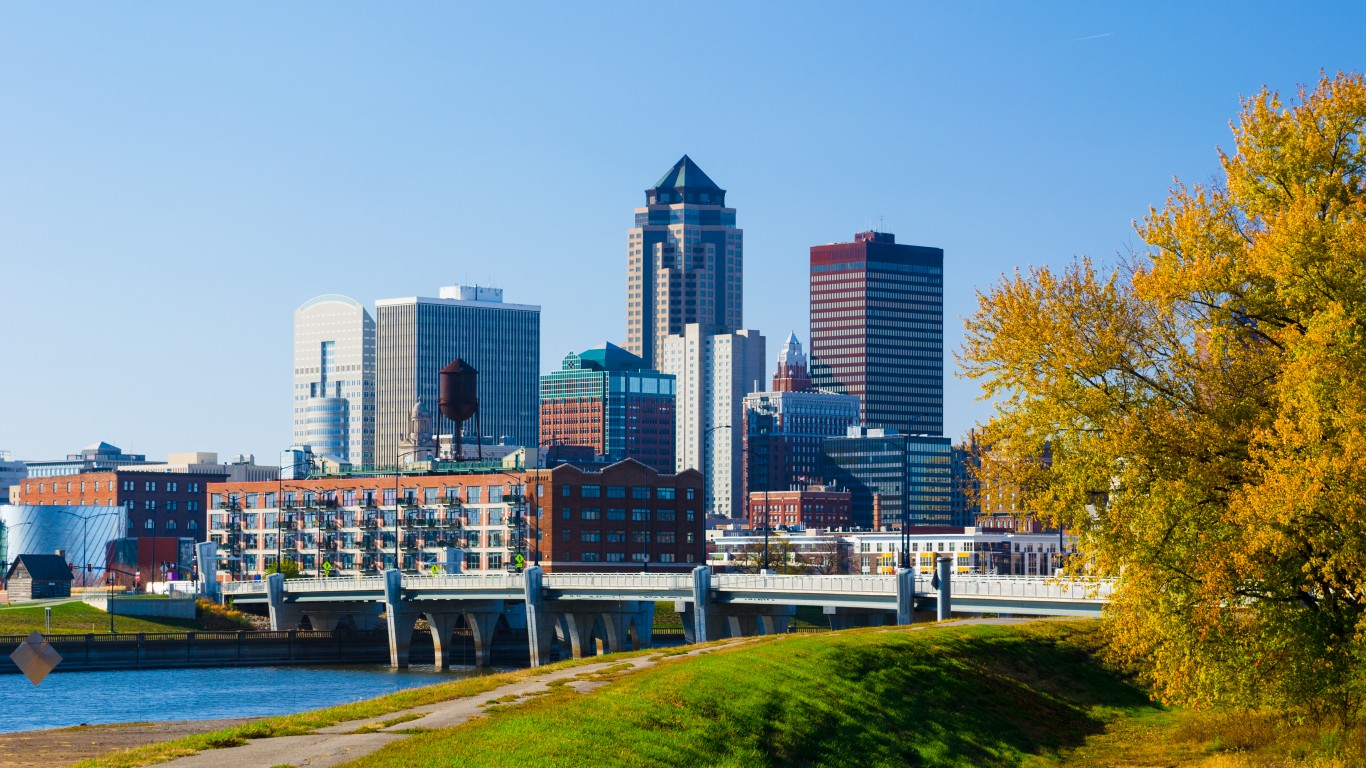
23. Des Moines, Iowa
> Avg. temperature, Sept. 2021: 70.4 °F
> Change from avg. Sept. temperature, 1901-2000: +5.3
> Hottest September on record: 2019 (Avg temperature: 71.6 °F)

22. Milwaukee, Wisconsin
> Avg. temperature, Sept. 2021: 68.3 °F
> Change from avg. Sept. temperature, 1901-2000: +5.3
> Hottest September on record: 2005 (Avg temperature: 69.9 °F)
[in-text-ad-2]
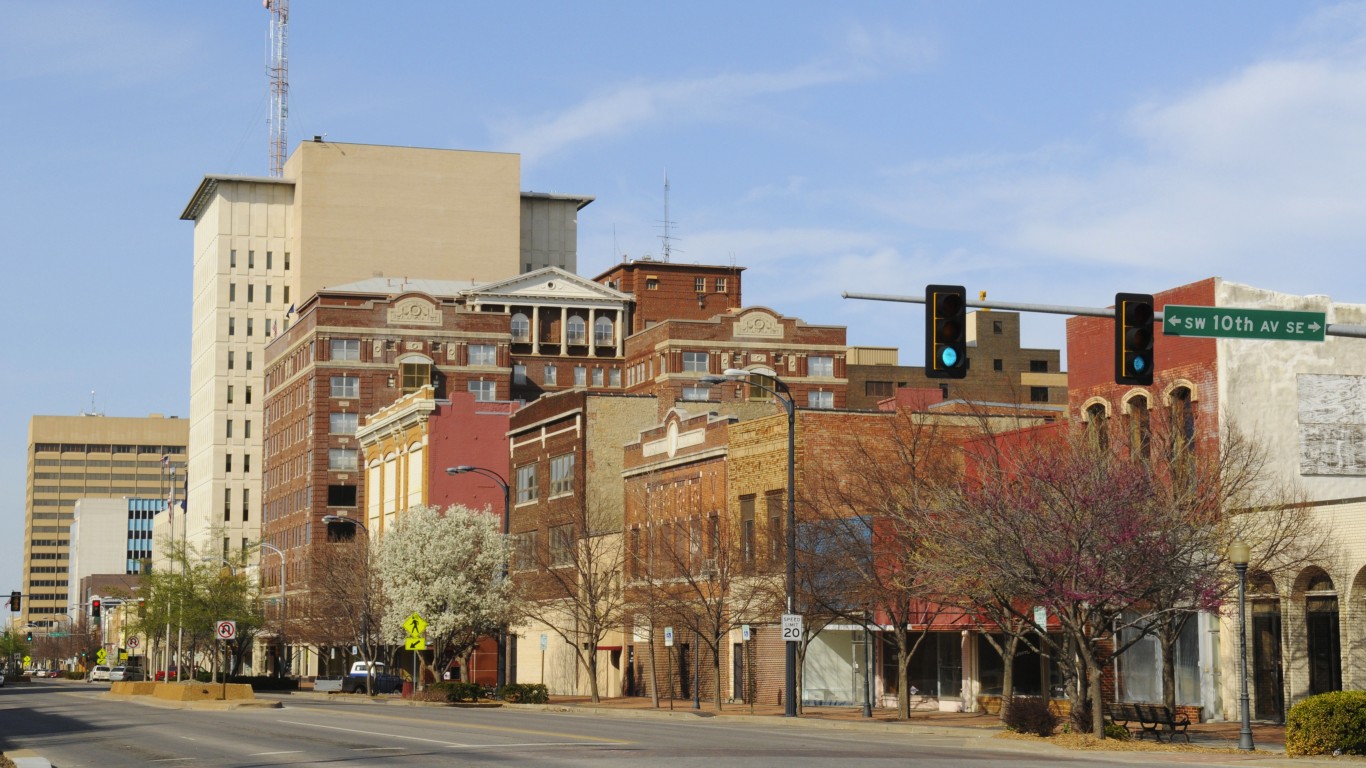
21. Topeka, Kansas
> Avg. temperature, Sept. 2021: 73.3 °F
> Change from avg. Sept. temperature, 1901-2000: +5.3
> Hottest September on record: 2019 (Avg temperature: 76.2 °F)

20. Lubbock, Texas
> Avg. temperature, Sept. 2021: 75.9 °F
> Change from avg. Sept. temperature, 1901-2000: +5.4
> Hottest September on record: 2019 (Avg temperature: 77.5 °F)
[in-text-ad]
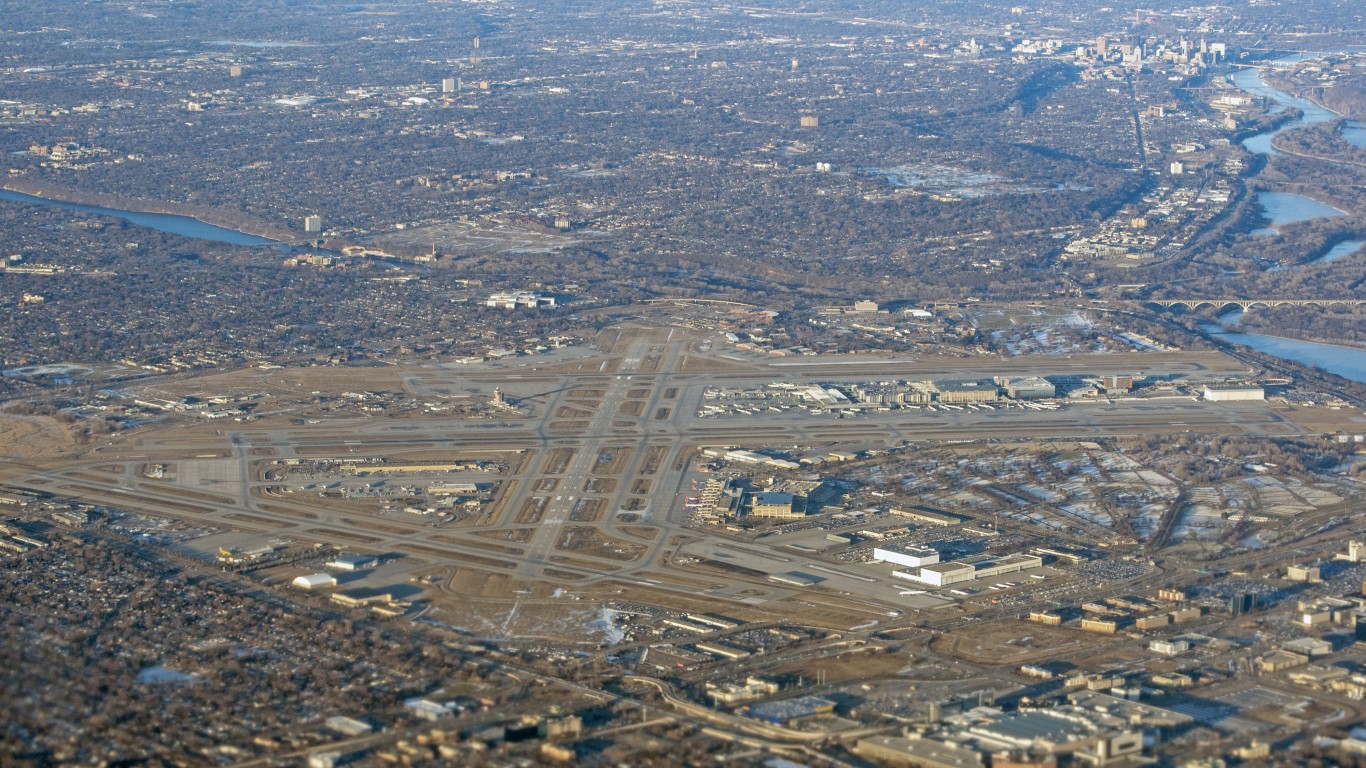
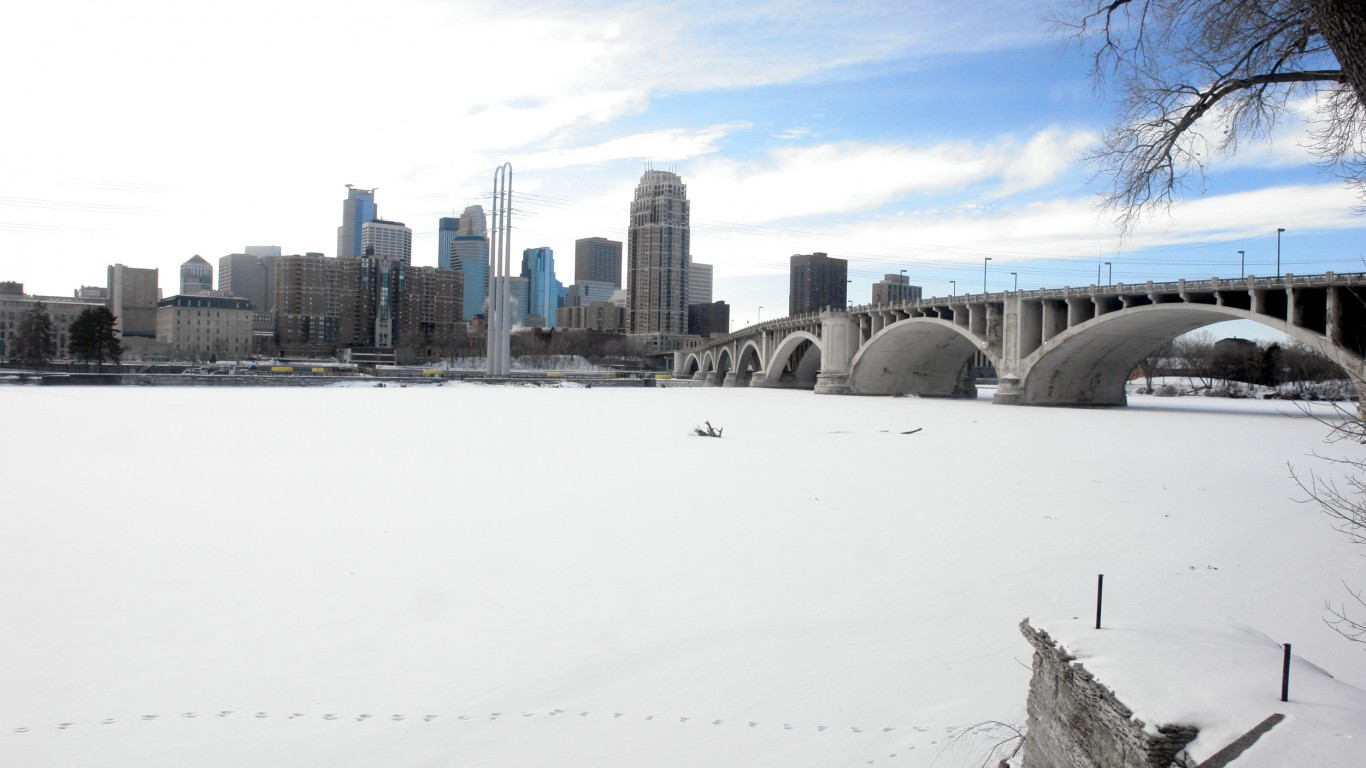
19. Minneapolis-St. Paul, Minnesota
> Avg. temperature, Sept. 2021: 66.5 °F
> Change from avg. Sept. temperature, 1901-2000: +5.4
> Hottest September on record: 2015 (Avg temperature: 67.9 °F)
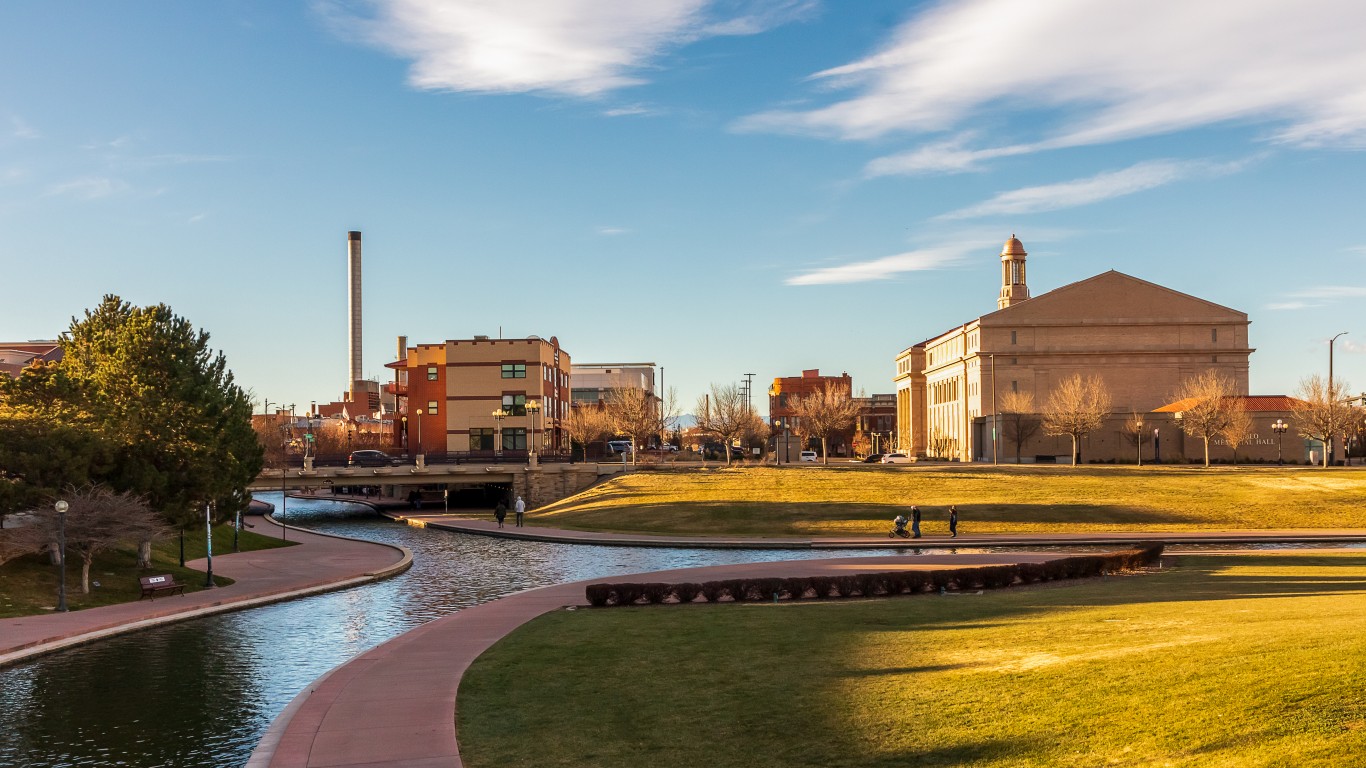
18. Pueblo, Colorado
> Avg. temperature, Sept. 2021: 70.3 °F
> Change from avg. Sept. temperature, 1901-2000: +5.6
> Hottest September on record: 2019 (Avg temperature: 72.8 °F)
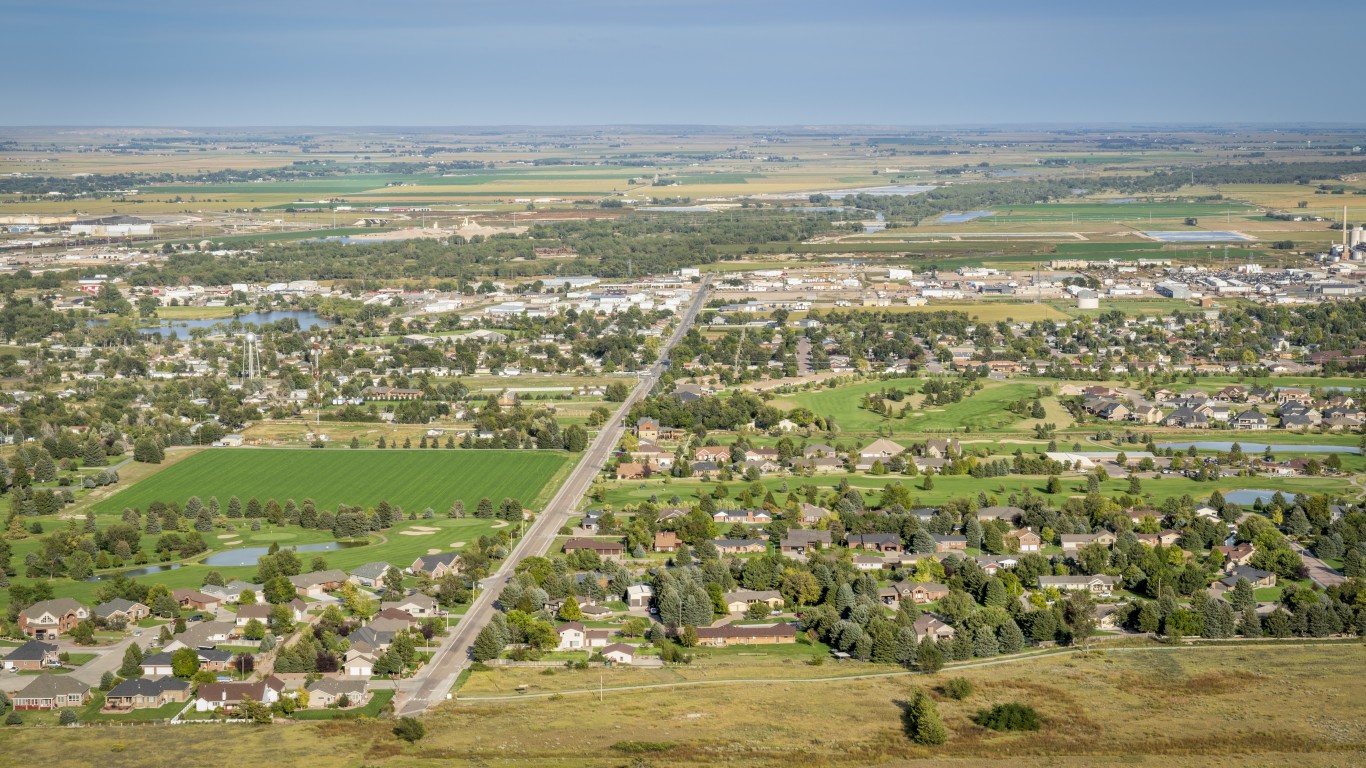
17. Scottsbluff, Nebraska
> Avg. temperature, Sept. 2021: 67.5 °F
> Change from avg. Sept. temperature, 1901-2000: +5.6
> Hottest September on record: 1998 (Avg temperature: 69.2 °F)
[in-text-ad-2]
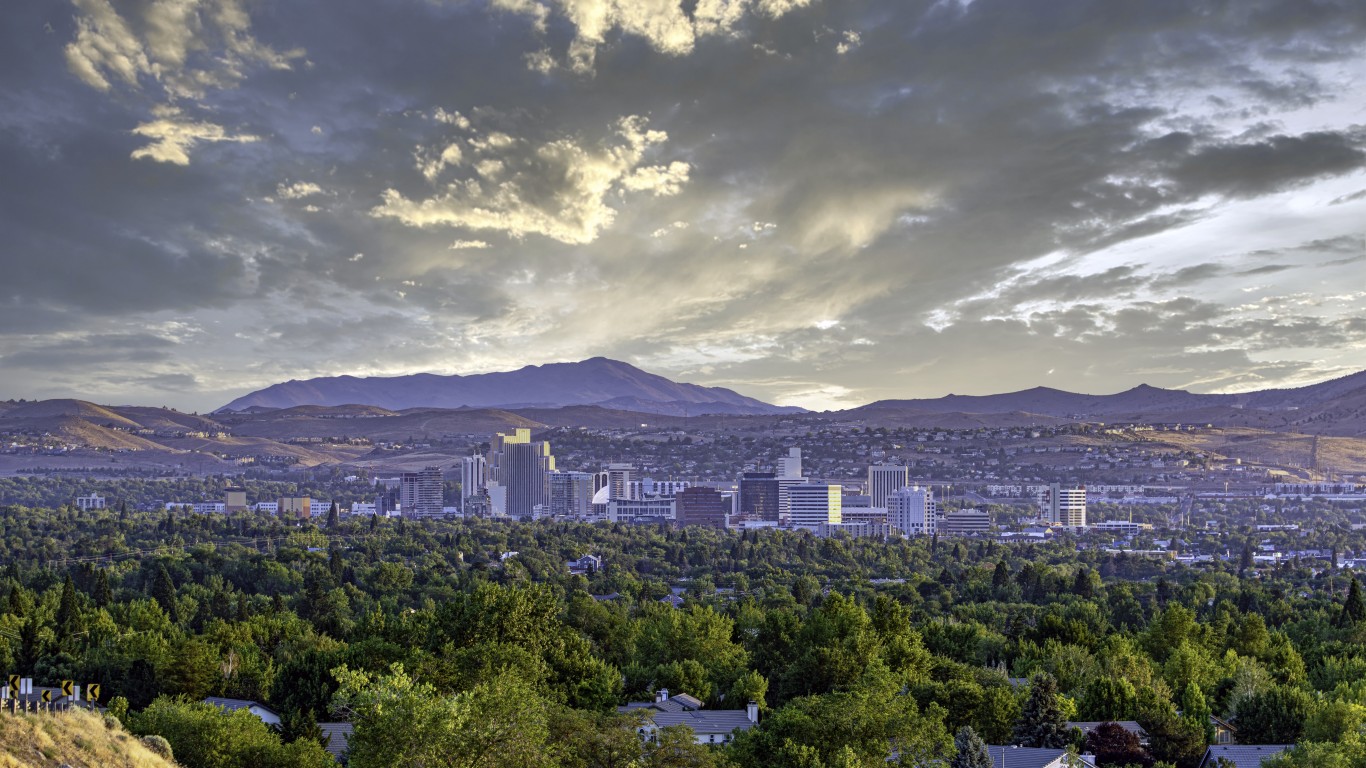
16. Reno, Nevada
> Avg. temperature, Sept. 2021: 68.3 °F
> Change from avg. Sept. temperature, 1901-2000: +5.6
> Hottest September on record: 2012 (Avg temperature: 70.4 °F)
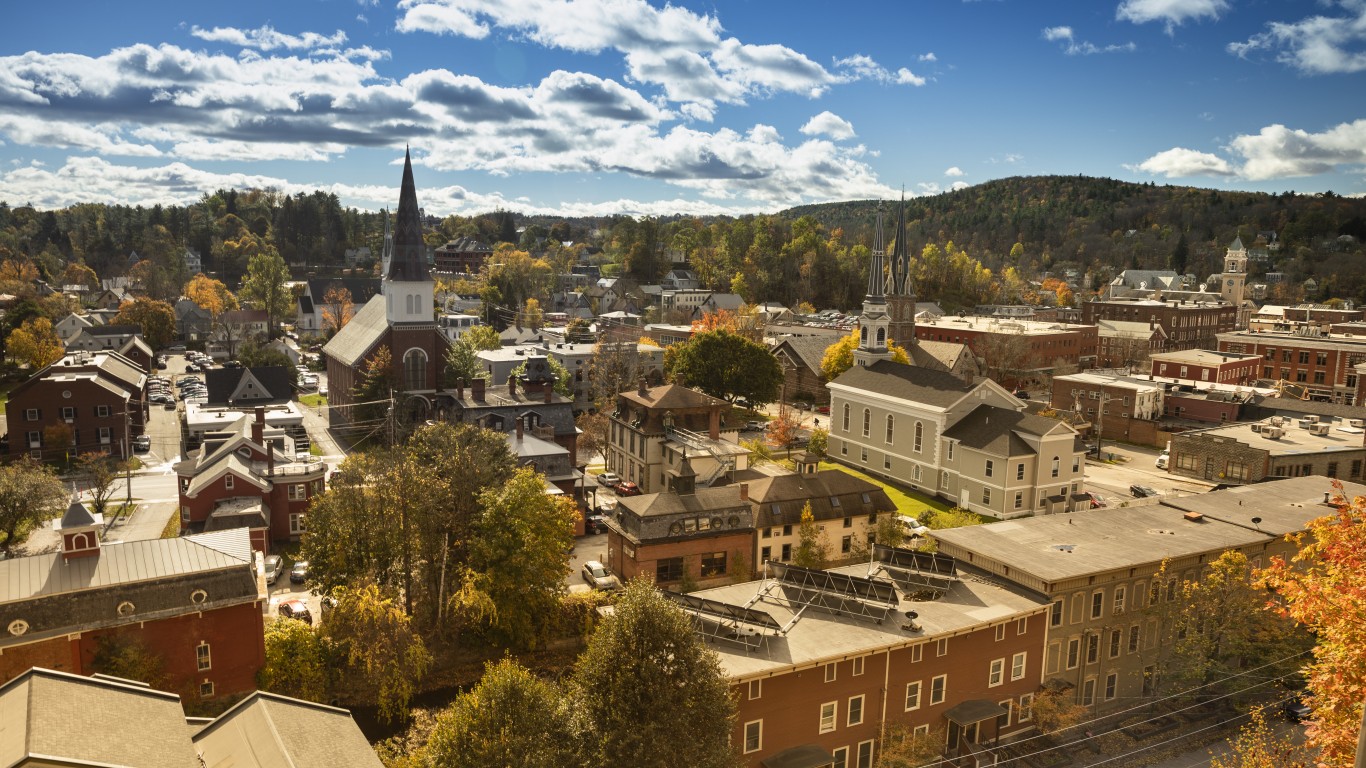
15. Montpelier, Vermont
> Avg. temperature, Sept. 2021: 61.1 °F
> Change from avg. Sept. temperature, 1901-2000: +5.8
> Hottest September on record: 1961 (Avg temperature: 63.1 °F)
[in-text-ad]
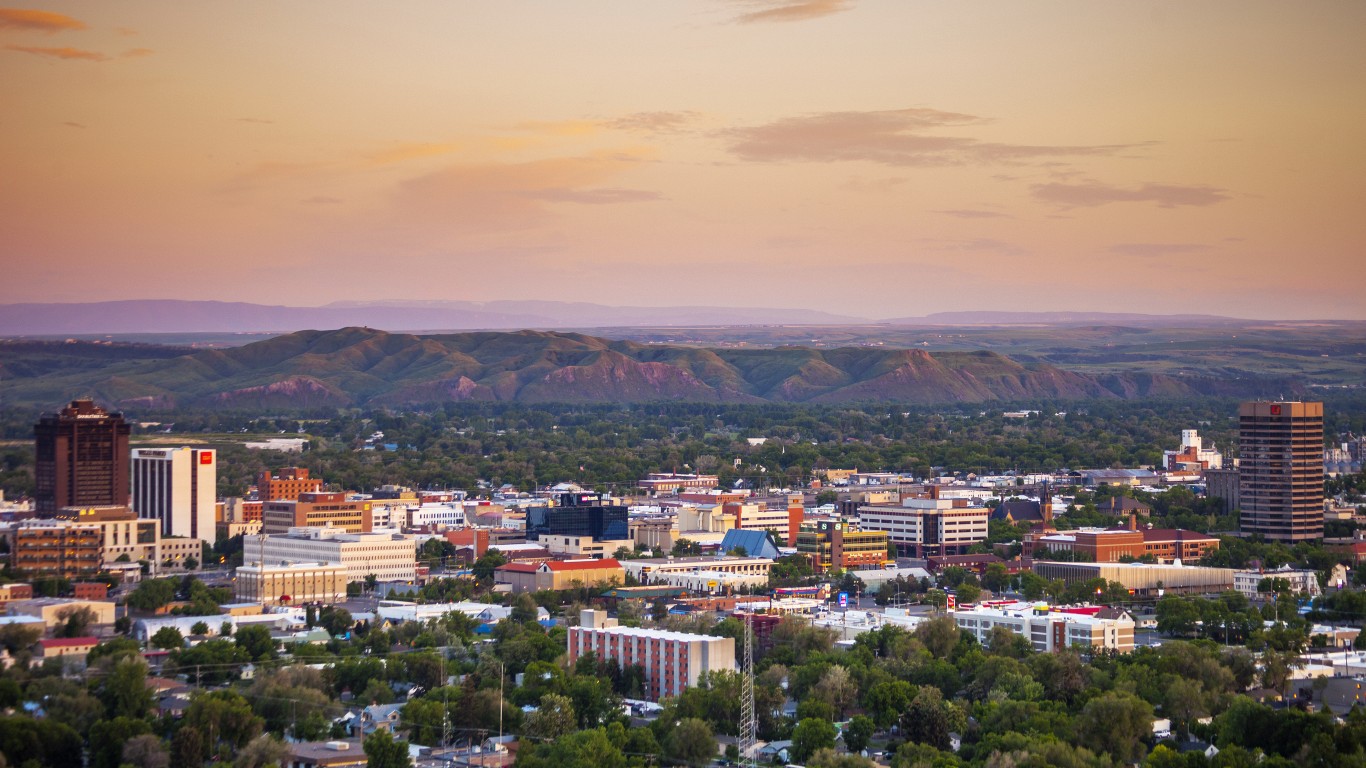
14. Billings, Montana
> Avg. temperature, Sept. 2021: 65.2 °F
> Change from avg. Sept. temperature, 1901-2000: +5.8
> Hottest September on record: 2009 (Avg temperature: 66.7 °F)
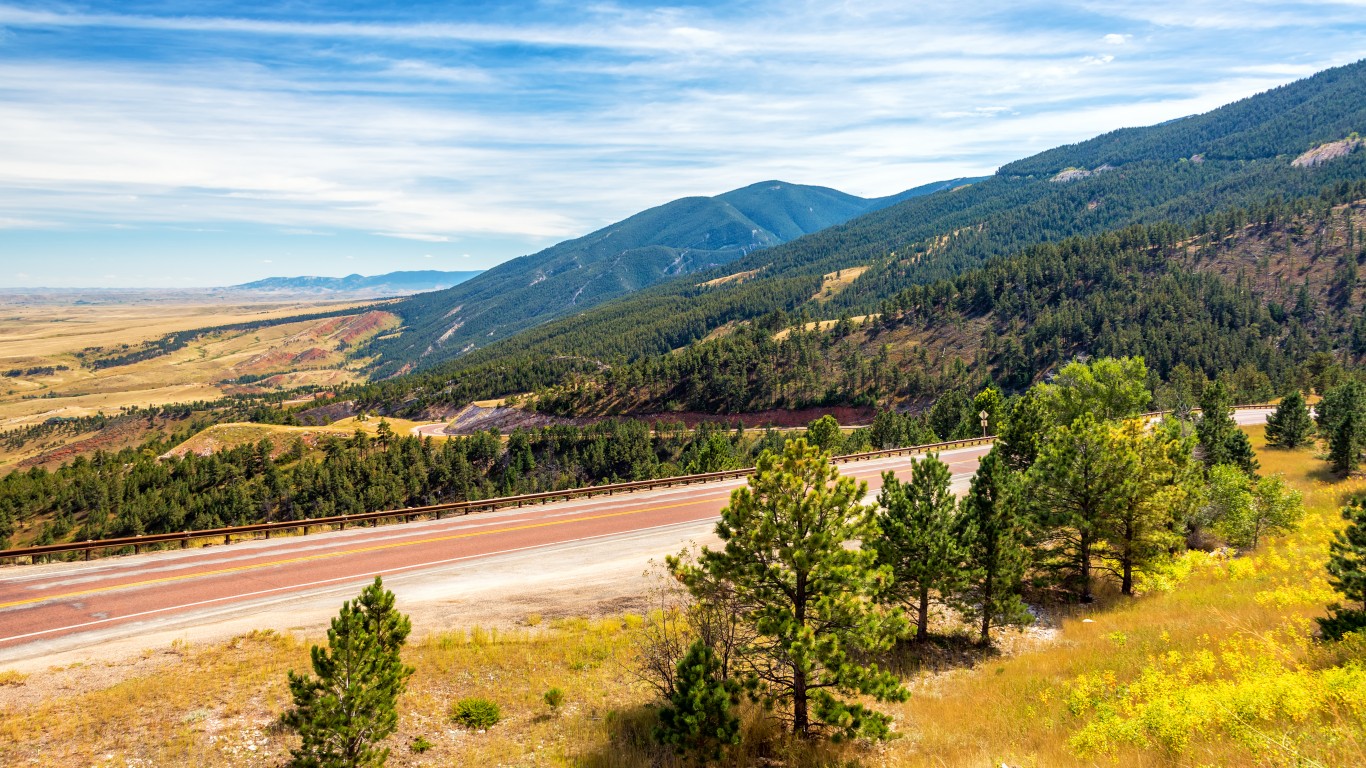
13. Sheridan, Wyoming
> Avg. temperature, Sept. 2021: 62.9 °F
> Change from avg. Sept. temperature, 1901-2000: +5.9
> Hottest September on record: 1963 (Avg temperature: 64.3 °F)
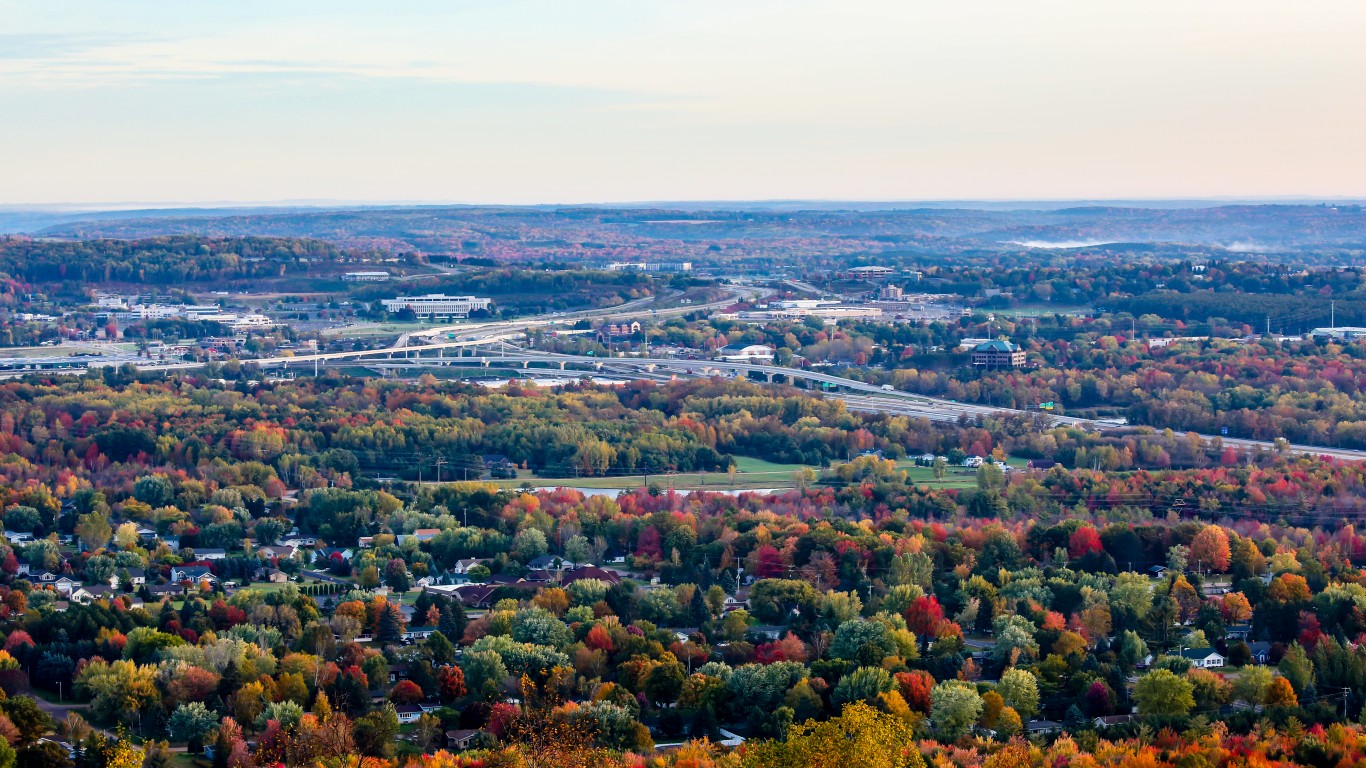
12. Wausau, Wisconsin
> Avg. temperature, Sept. 2021: 63.3 °F
> Change from avg. Sept. temperature, 1901-2000: +6.0
> Hottest September on record: 2015 (Avg temperature: 64.9 °F)
[in-text-ad-2]
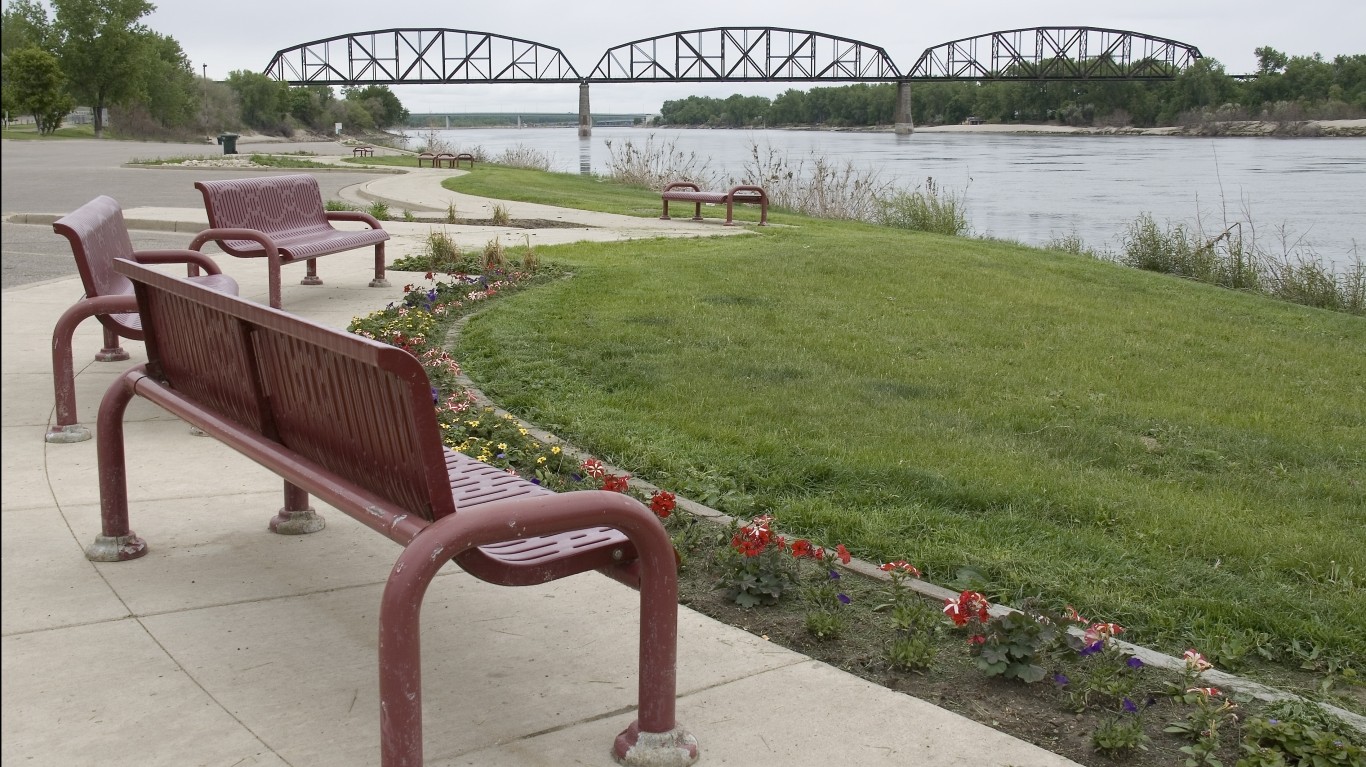
11. Bismarck, North Dakota
> Avg. temperature, Sept. 2021: 65.1 °F
> Change from avg. Sept. temperature, 1901-2000: +6.2
> Hottest September on record: 1948 (Avg temperature: 66.1 °F)
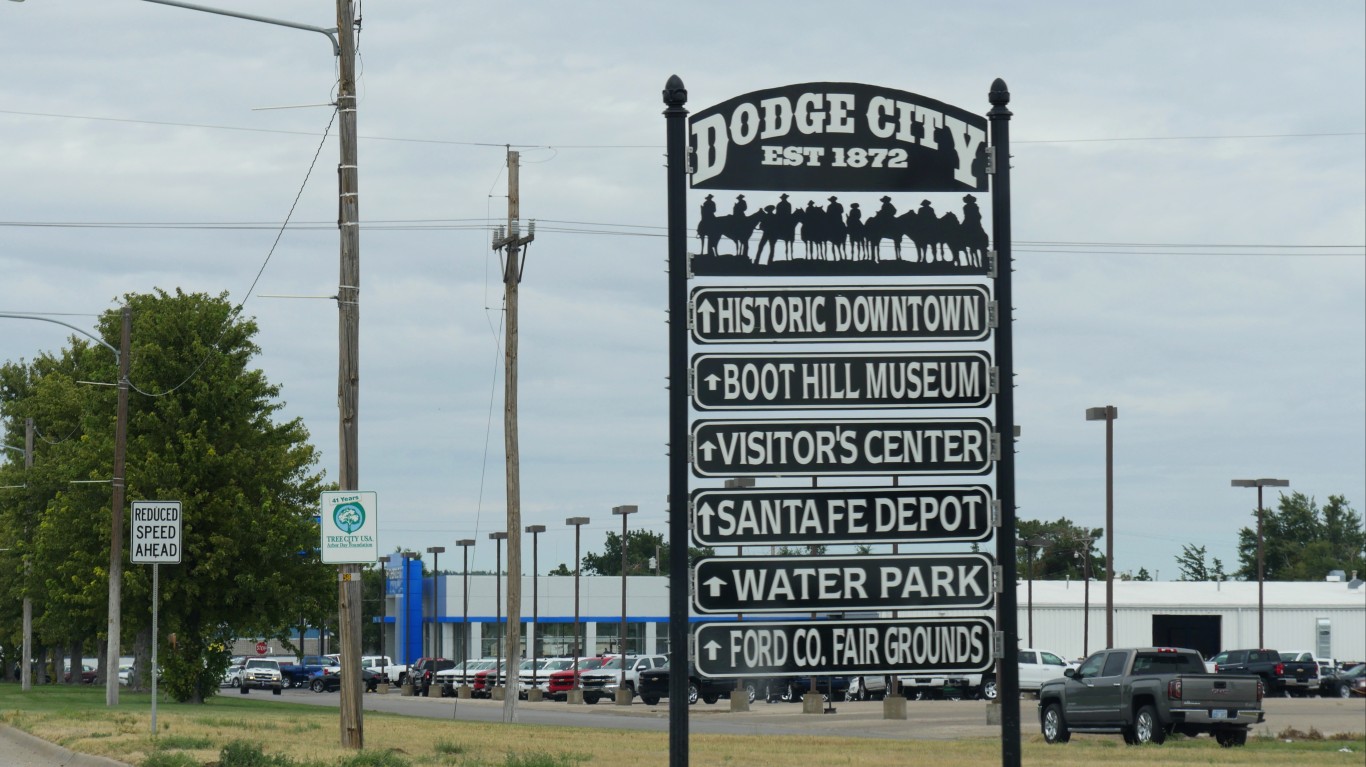
10. Dodge City, Kansas
> Avg. temperature, Sept. 2021: 74.7 °F
> Change from avg. Sept. temperature, 1901-2000: +6.2
> Hottest September on record: 2019 (Avg temperature: 78.0 °F)
[in-text-ad]
9. International Falls, Minnesota
> Avg. temperature, Sept. 2021: 59.0 °F
> Change from avg. Sept. temperature, 1901-2000: +6.3
> Hottest September on record: 2009 (Avg temperature: 60.1 °F)
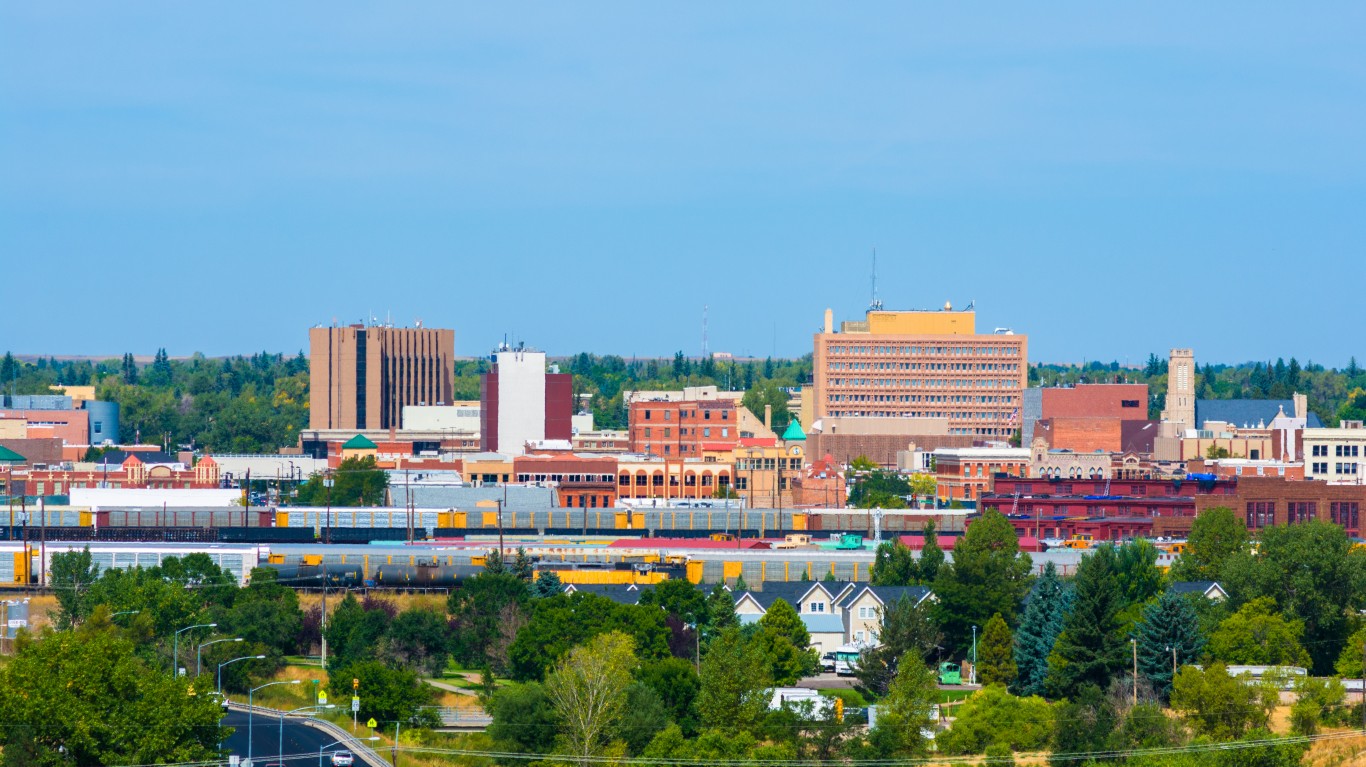
8. Cheyenne, Wyoming
> Avg. temperature, Sept. 2021: 63.5 °F
> Change from avg. Sept. temperature, 1901-2000: +6.6
> Hottest September on record: 2015 (Avg temperature: 64.7 °F)
7. Minot, North Dakota
> Avg. temperature, Sept. 2021: 65.0 °F
> Change from avg. Sept. temperature, 1901-2000: +6.8
> Hottest September on record: 2009 (Avg temperature: 66.1 °F)
[in-text-ad-2]
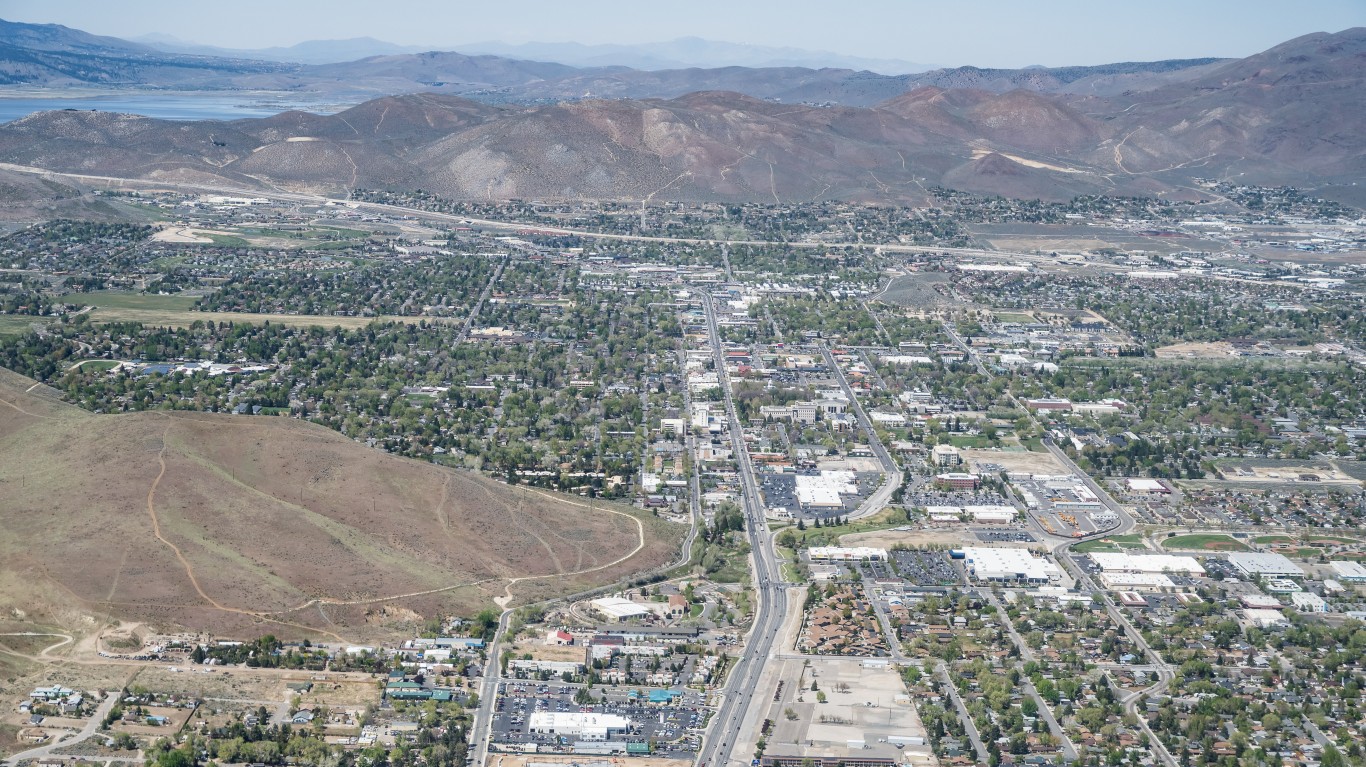
6. Carson City, Nevada
> Avg. temperature, Sept. 2021: 70.2 °F
> Change from avg. Sept. temperature, 1901-2000: +6.8
> Hottest September on record: 2012 (Avg temperature: 70.7 °F)
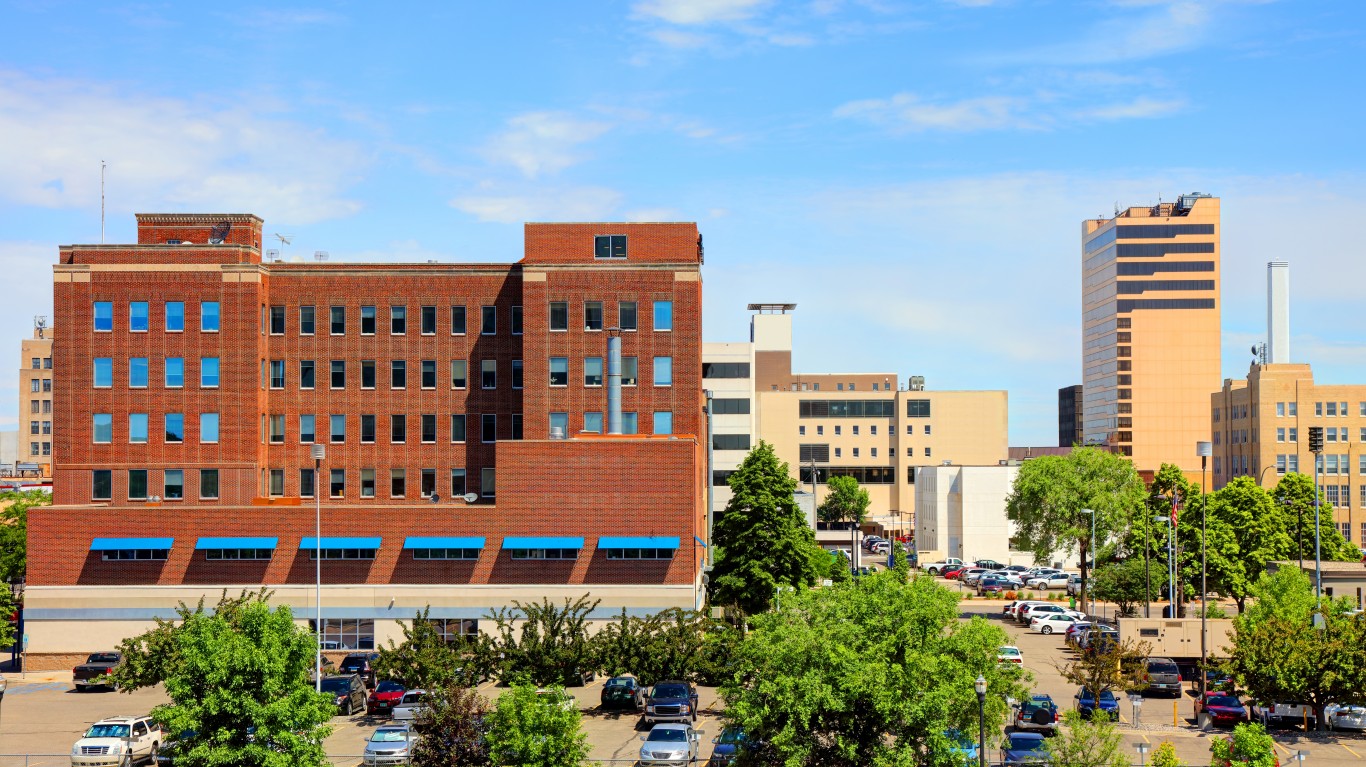
5. Fargo, North Dakota
> Avg. temperature, Sept. 2021: 64.4 °F
> Change from avg. Sept. temperature, 1901-2000: +6.8
> Hottest September on record: 2015 (Avg temperature: 65.1 °F)
[in-text-ad]
4. Dickinson, North Dakota
> Avg. temperature, Sept. 2021: 63.6 °F
> Change from avg. Sept. temperature, 1901-2000: +6.9
> Hottest September on record: 1998 (Avg temperature: 63.9 °F)
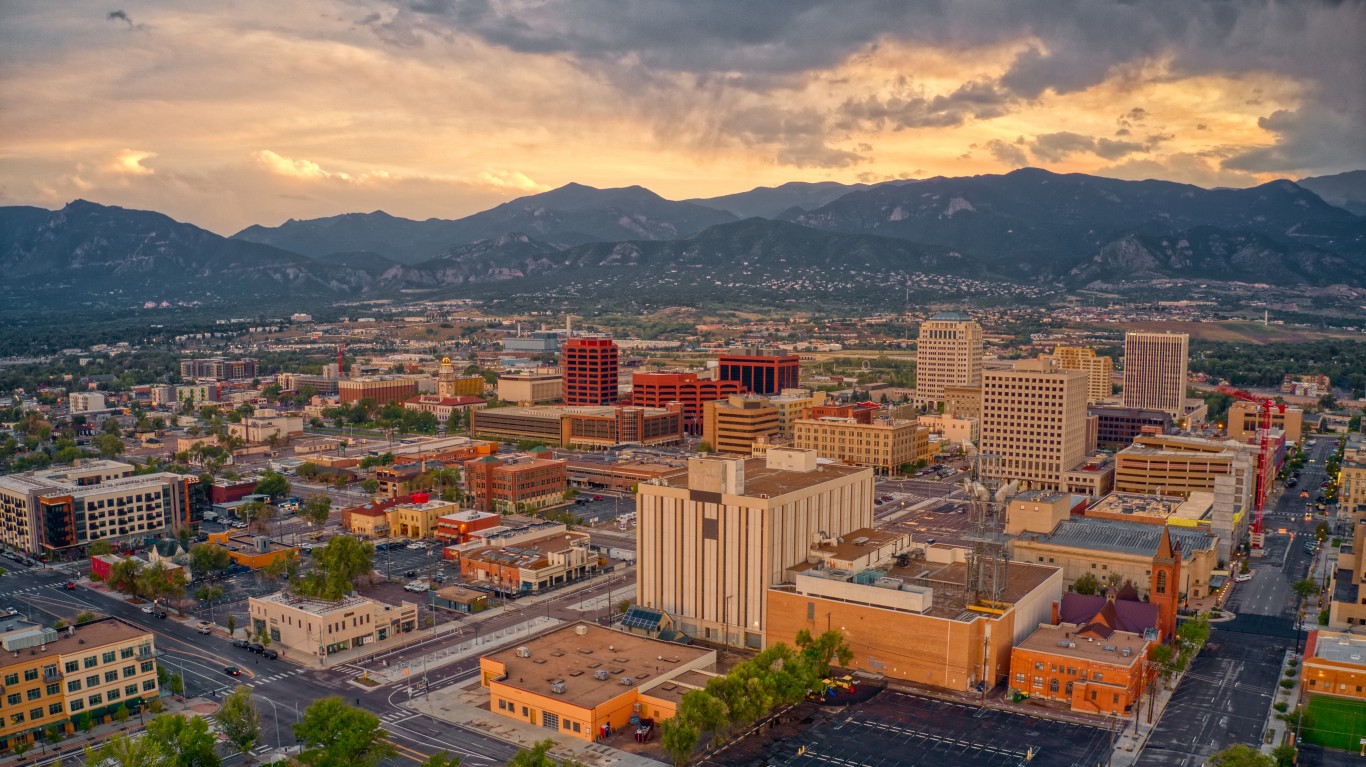
3. Colorado Springs, Colorado
> Avg. temperature, Sept. 2021: 68.0 °F
> Change from avg. Sept. temperature, 1901-2000: +7.2
> Hottest September on record: 2019 (Avg temperature: 68.7 °F)
2. Goodland, Kansas
> Avg. temperature, Sept. 2021: 71.4 °F
> Change from avg. Sept. temperature, 1901-2000: +7.2
> Hottest September on record: 2021 (Avg temperature: 71.4 °F)
[in-text-ad-2]
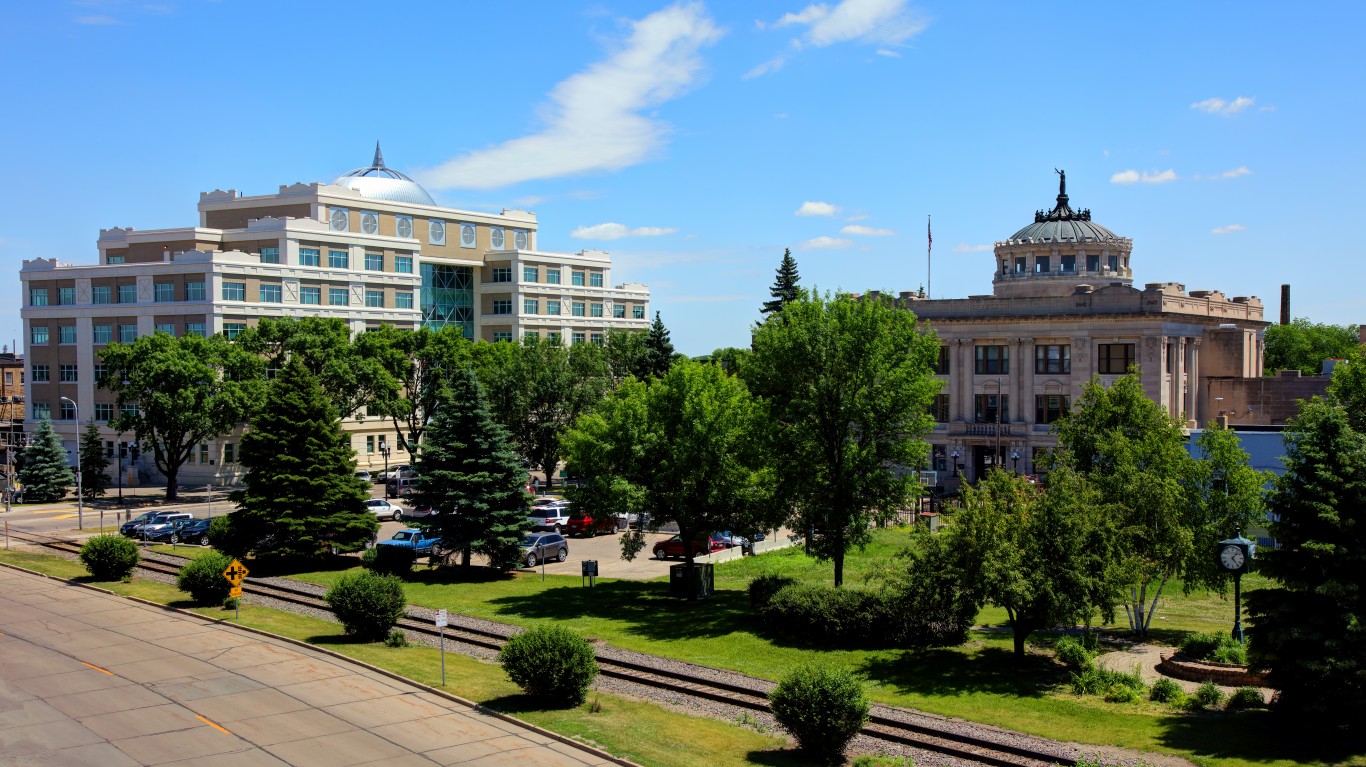
1. Grand Forks, North Dakota
> Avg. temperature, Sept. 2021: 63.0 °F
> Change from avg. Sept. temperature, 1901-2000: +7.8
> Hottest September on record: 2009 (Avg temperature: 64.1 °F)
Is Your Money Earning the Best Possible Rate? (Sponsor)
Let’s face it: If your money is just sitting in a checking account, you’re losing value every single day. With most checking accounts offering little to no interest, the cash you worked so hard to save is gradually being eroded by inflation.
However, by moving that money into a high-yield savings account, you can put your cash to work, growing steadily with little to no effort on your part. In just a few clicks, you can set up a high-yield savings account and start earning interest immediately.
There are plenty of reputable banks and online platforms that offer competitive rates, and many of them come with zero fees and no minimum balance requirements. Click here to see if you’re earning the best possible rate on your money!
Thank you for reading! Have some feedback for us?
Contact the 24/7 Wall St. editorial team.
 24/7 Wall St.
 24/7 Wall St.
 24/7 Wall St.