
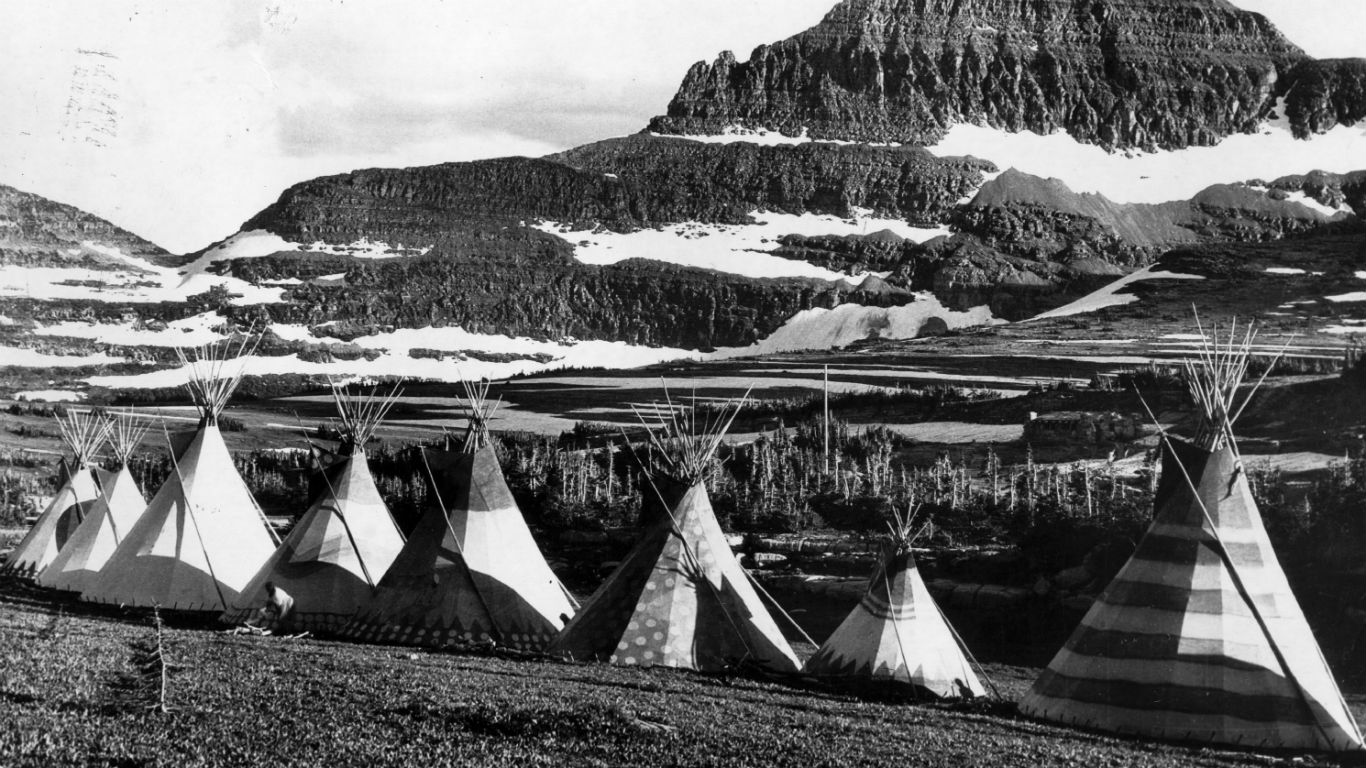
Long before European map-makers laid out the contours of what would become the United States and Canada, Indigenous peoples populated the continent. As Europeans arrived in greater numbers, conflict arose between the newcomers and those whose ancestors had been living in North America for many thousands of years.
Though Indian reservations date back to the mid-18th century, the Indian Removal Act of 1830 had a calamitous effect, forcing native inhabitants out of most areas east of the Mississippi River and onto reservations in the western parts of the continent — away from European-based population centers. Marginalization of Indigenous peoples continued for decades afterward, leaving a legacy of broken promises and dishonored treaties.
Today, some 78% of Indigenous peoples live in towns and cities around the country, while the rest live on reservations and other designated tribal areas. These areas are protected by the U.S. government, which assures the sovereignty of tribes. (These are the states with the most Indian reservations or tribal areas.)
To identify the number of Native Americans in every state (or the number of Alaska Natives in the case of Alaska), 24/7 Wall St. reviewed U.S. Census Bureau data on the American Indian and Alaska Native (AIAN) population in each state.
Click here to see the number of Native Americans in every state
According to the Census Bureau, as of 2021, our population of Native Americans and Alaska Natives stands at 6.79 million, about 2.09% of the total population. The great majority of them live in the Southern and Western states, though each U.S. state has an Indigenous population, and seven states have more than 100,000 Native Americans. (Here’s a list of every state with a Native American name.)
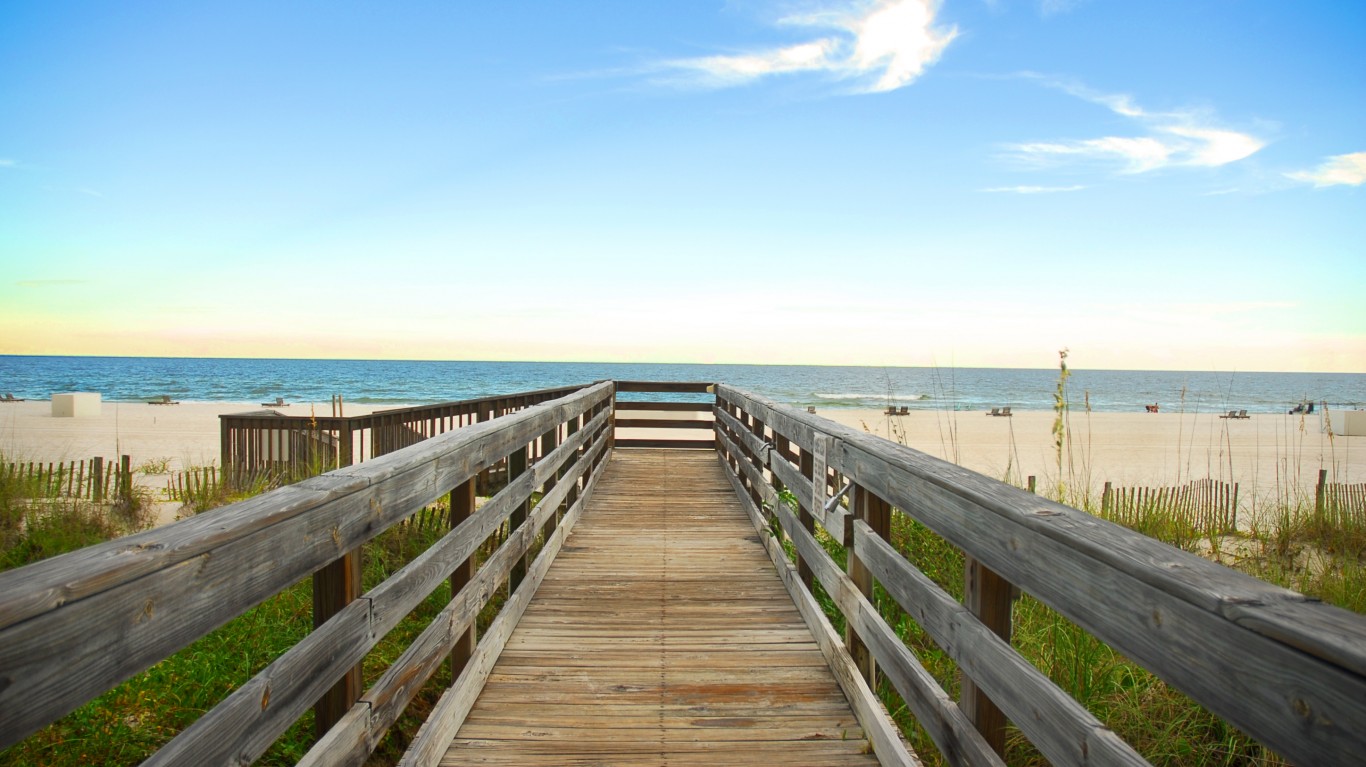
Alabama
> Indigenous population: 25,565
> Pct. of all Alabama residents: 0.52% (25th highest)
[in-text-ad]
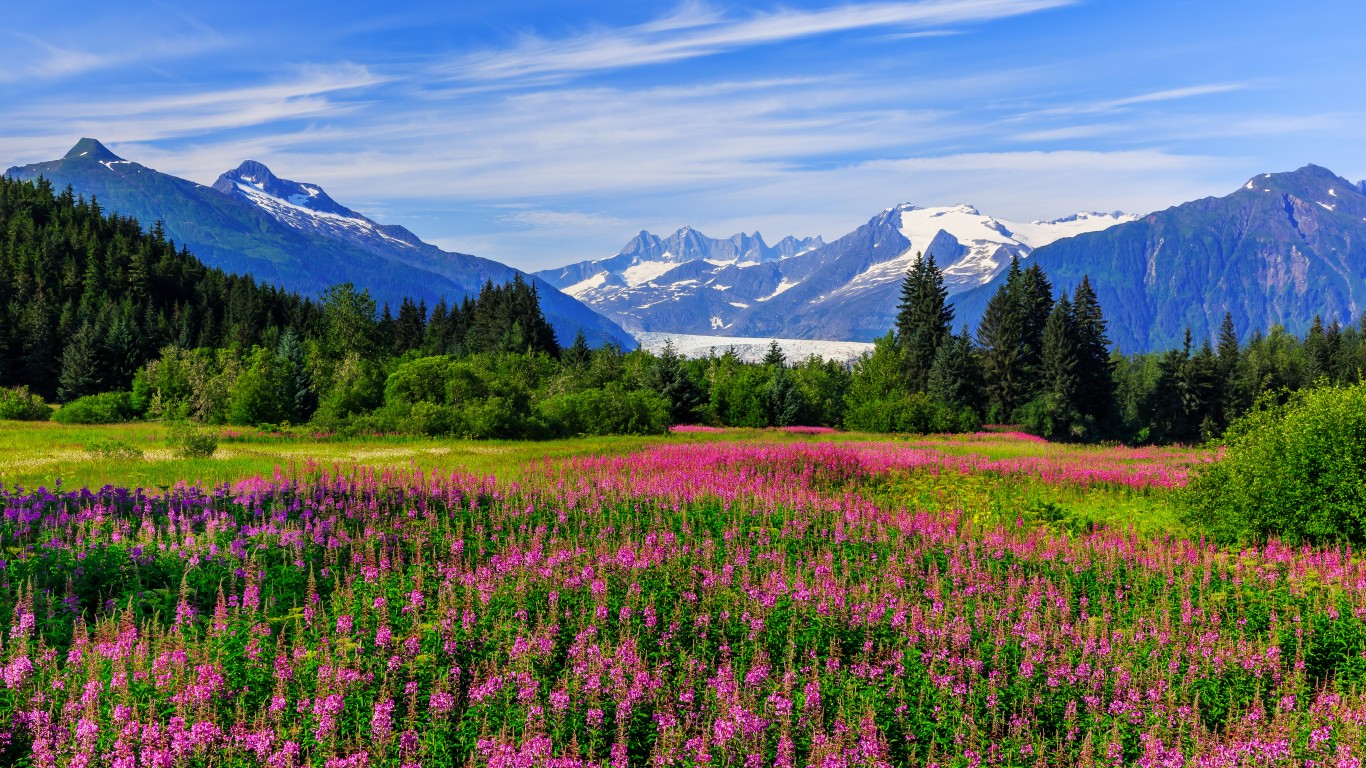
Alaska
> Indigenous population (Alaska Natives): 109,751
> Pct. of all Alaska residents: 14.89% (the highest)
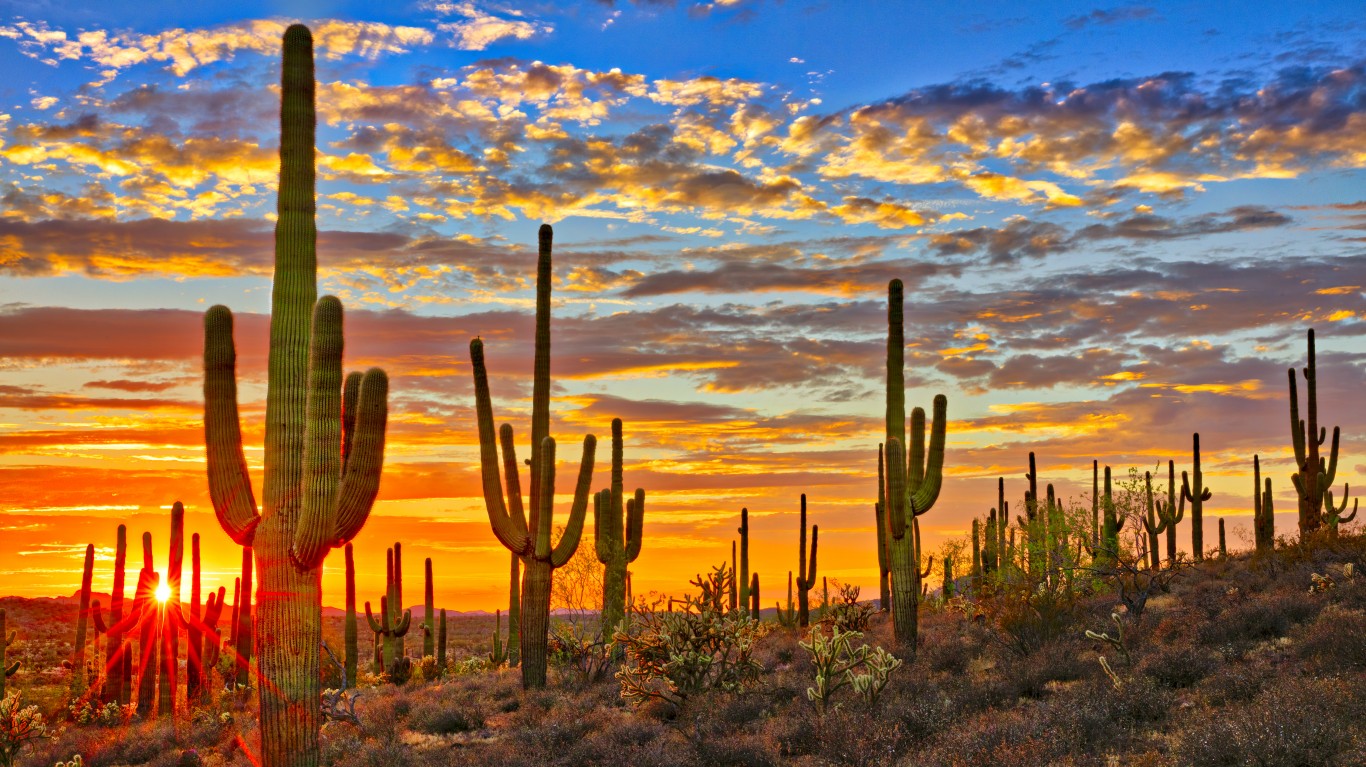
Arizona
> Indigenous population: 317,414
> Pct. of all Arizona residents: 4.50% (7th highest)
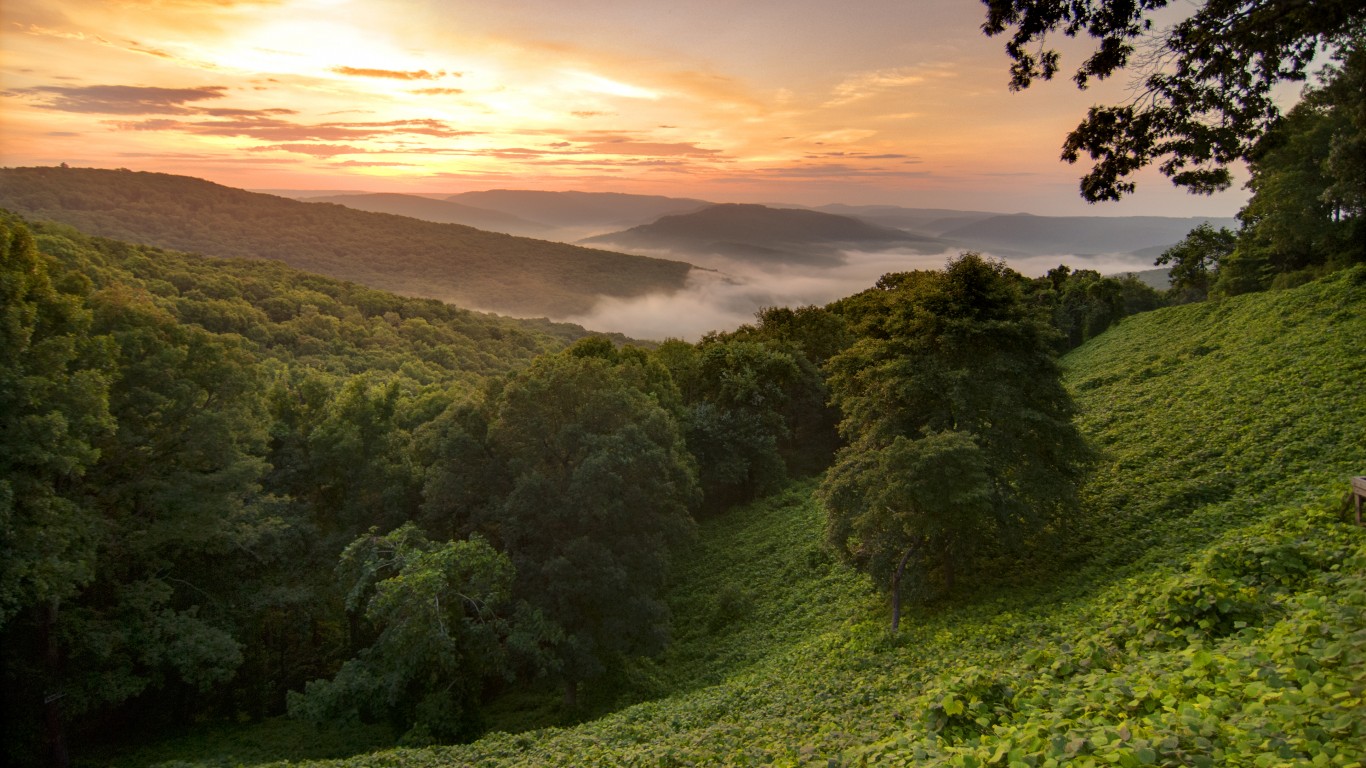
Arkansas
> Indigenous population: 20,434
> Pct. of all Arkansas residents: 0.68% (21st highest)
[in-text-ad-2]

California
> Indigenous population: 303,998
> Pct. of all California residents: 0.77% (20th highest)
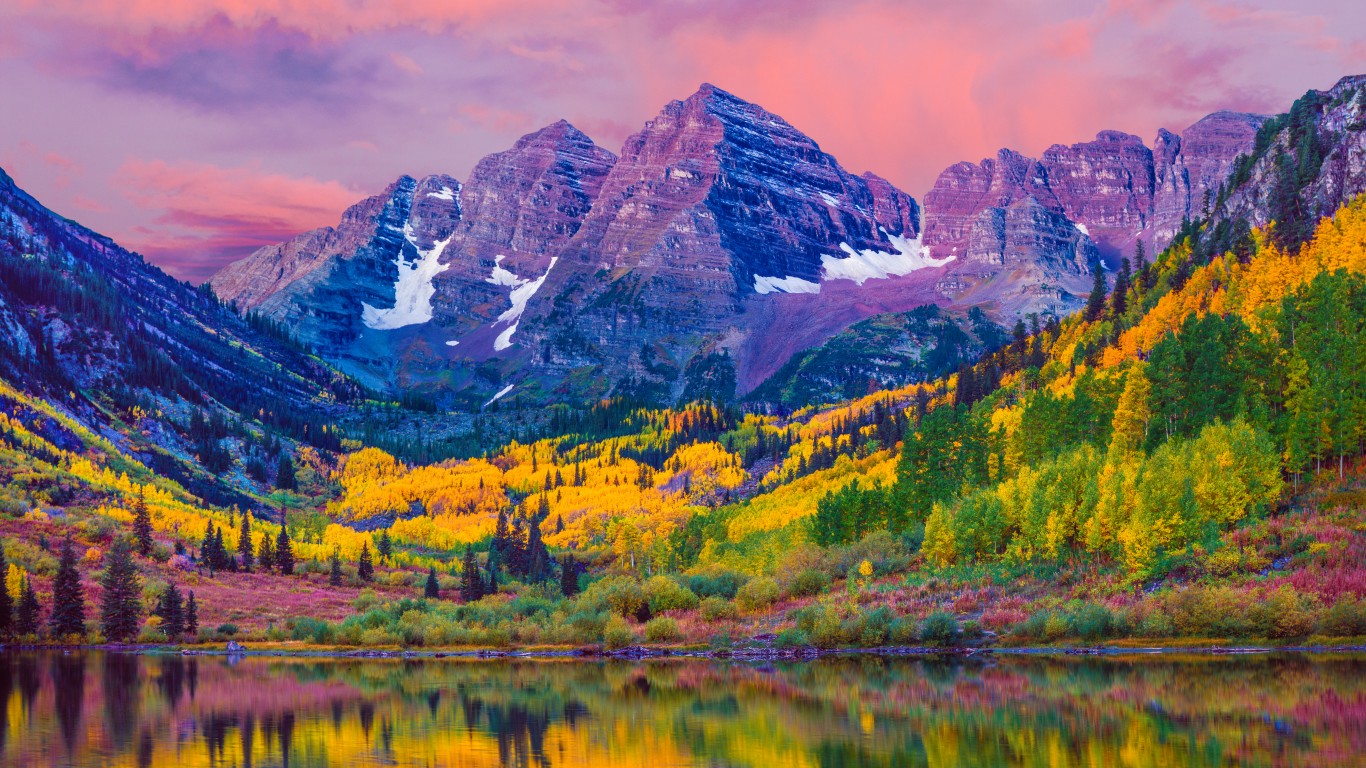
Colorado
> Indigenous population: 54,847
> Pct. of all Colorado residents: 0.98% (16th highest)
[in-text-ad]
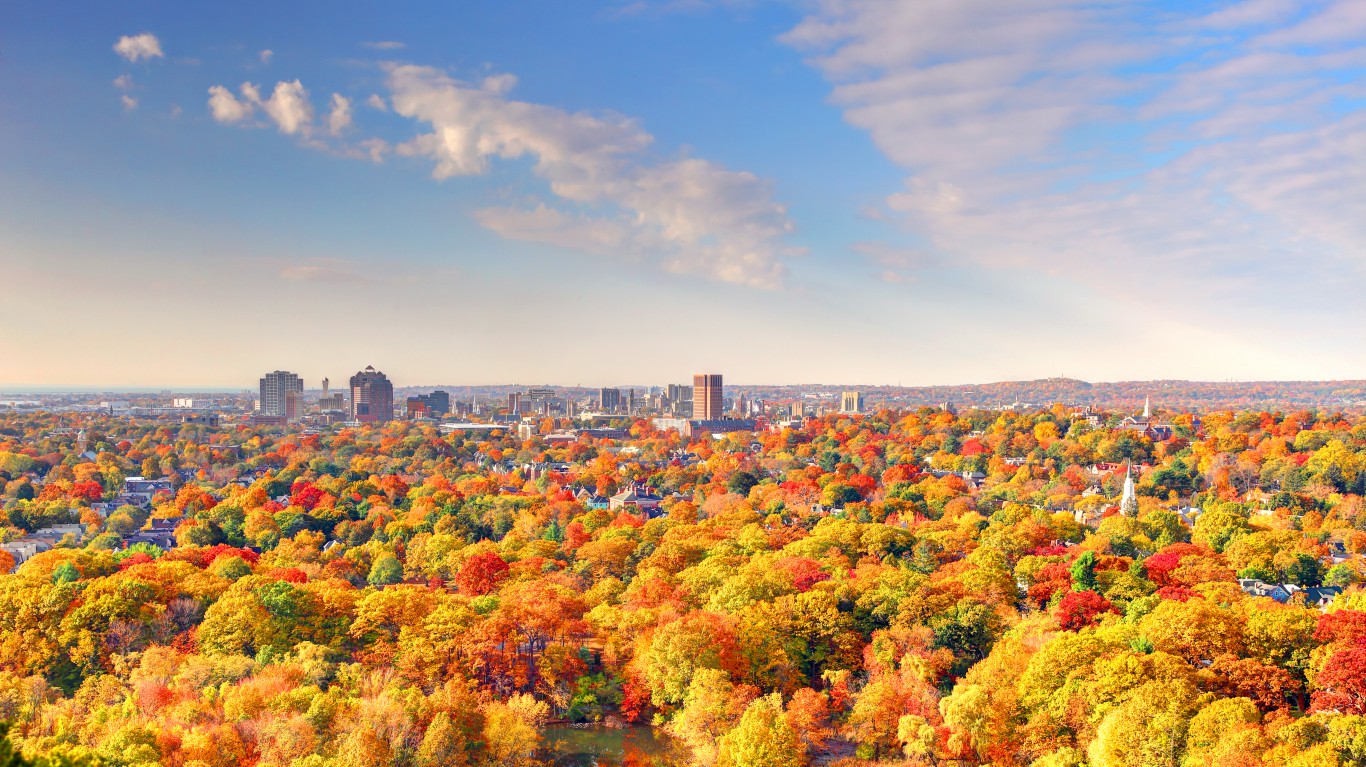
Connecticut
> Indigenous population: 9,955
> Pct. of all Connecticut residents: 0.28% (12th lowest)
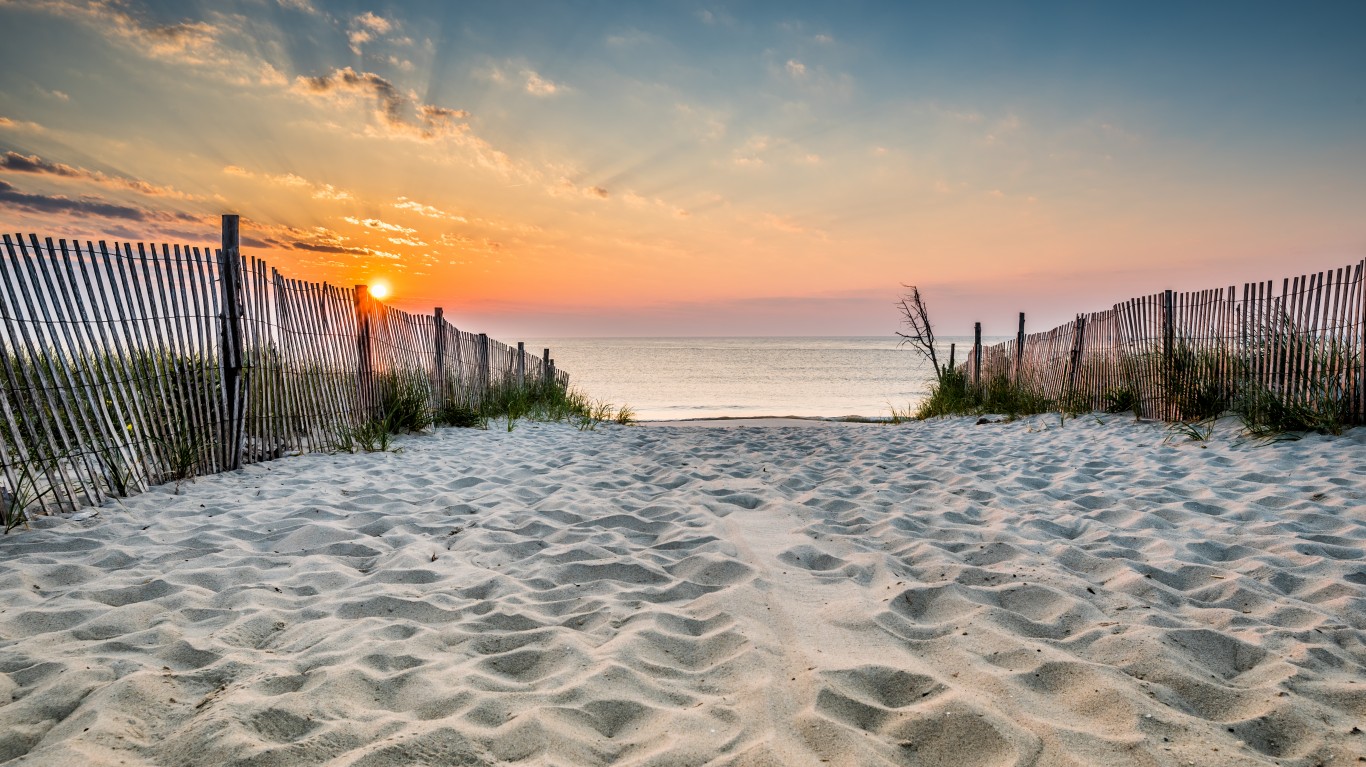
Delaware
> Indigenous population: 3,729
> Pct. of all Delaware residents: 0.39% (20th lowest)

Florida
> Indigenous population: 59,320
> Pct. of all Florida residents: 0.28% (15th lowest)
[in-text-ad-2]
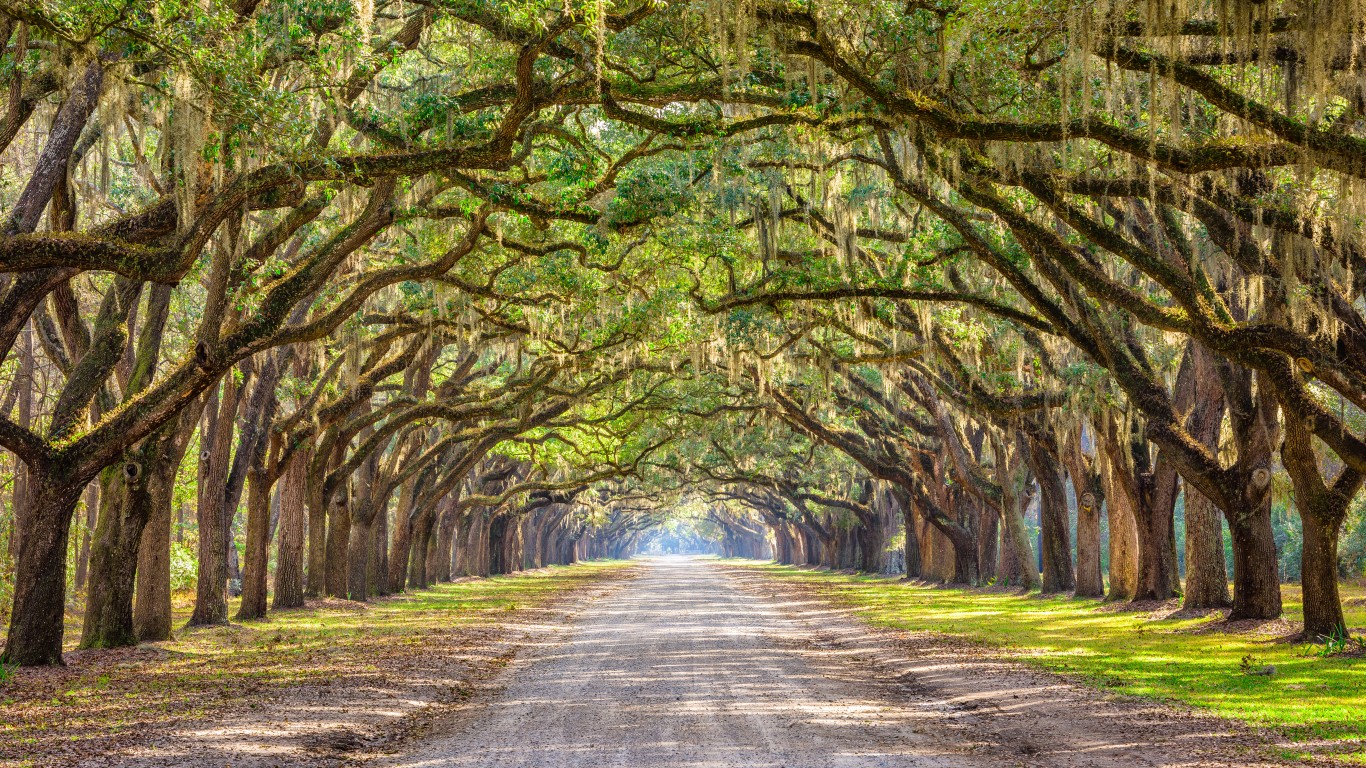
Georgia
> Indigenous population: 37,440
> Pct. of all Georgia residents: 0.36% (18th lowest)
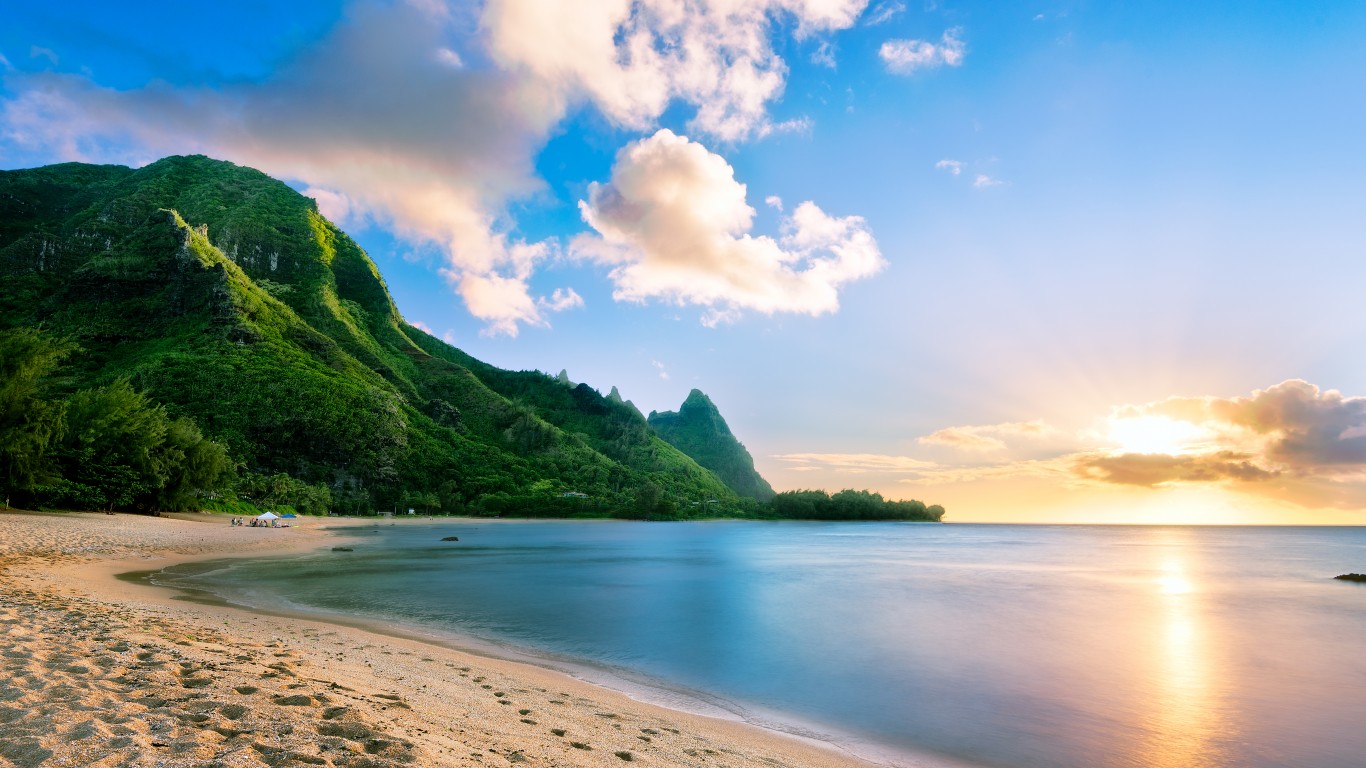
Hawaii
> Indigenous population: 3,710
> Pct. of all Hawaii residents: 0.26% (9th lowest)
[in-text-ad]
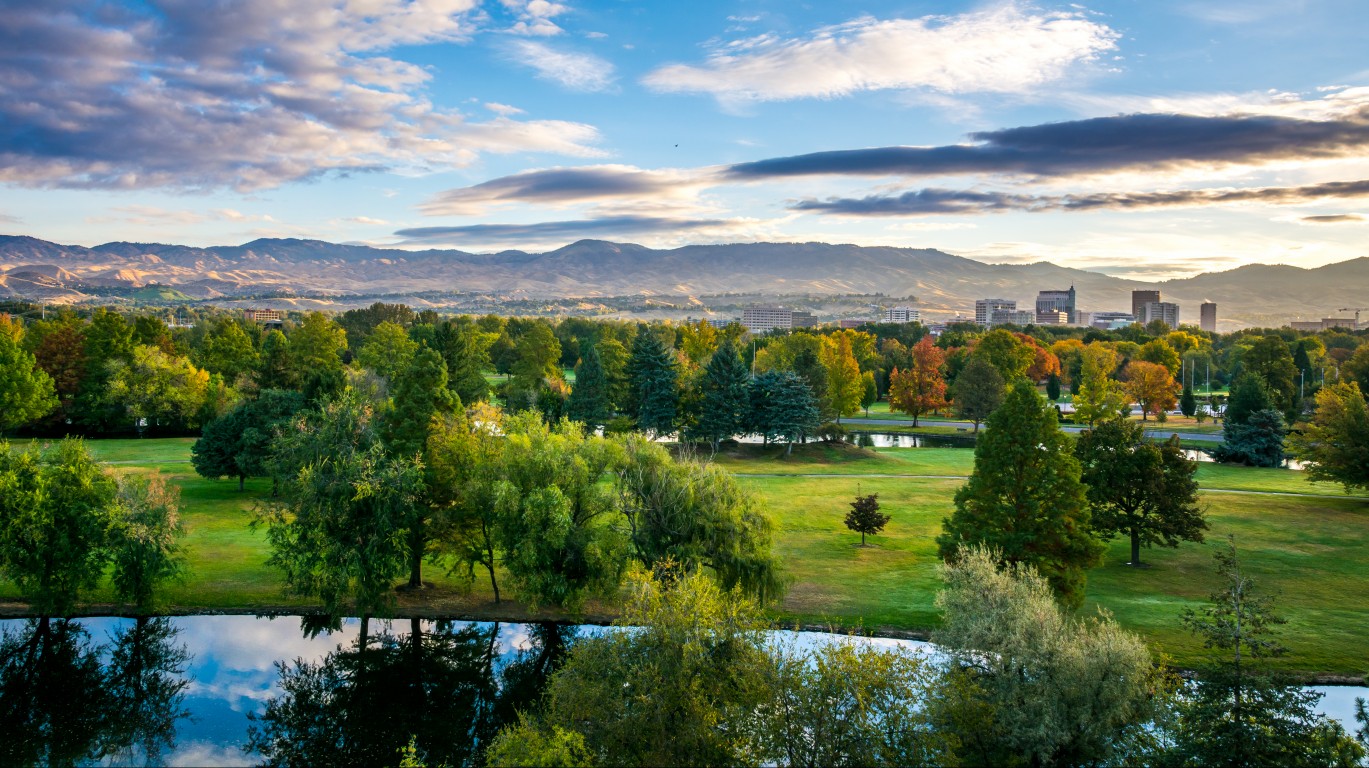
Idaho
> Indigenous population: 23,136
> Pct. of all Idaho residents: 1.35% (9th highest)
Illinois
> Indigenous population: 33,460
> Pct. of all Illinois residents: 0.26% (10th lowest)
Indiana
> Indigenous population: 15,782
> Pct. of all Indiana residents: 0.24% (8th lowest)
[in-text-ad-2]
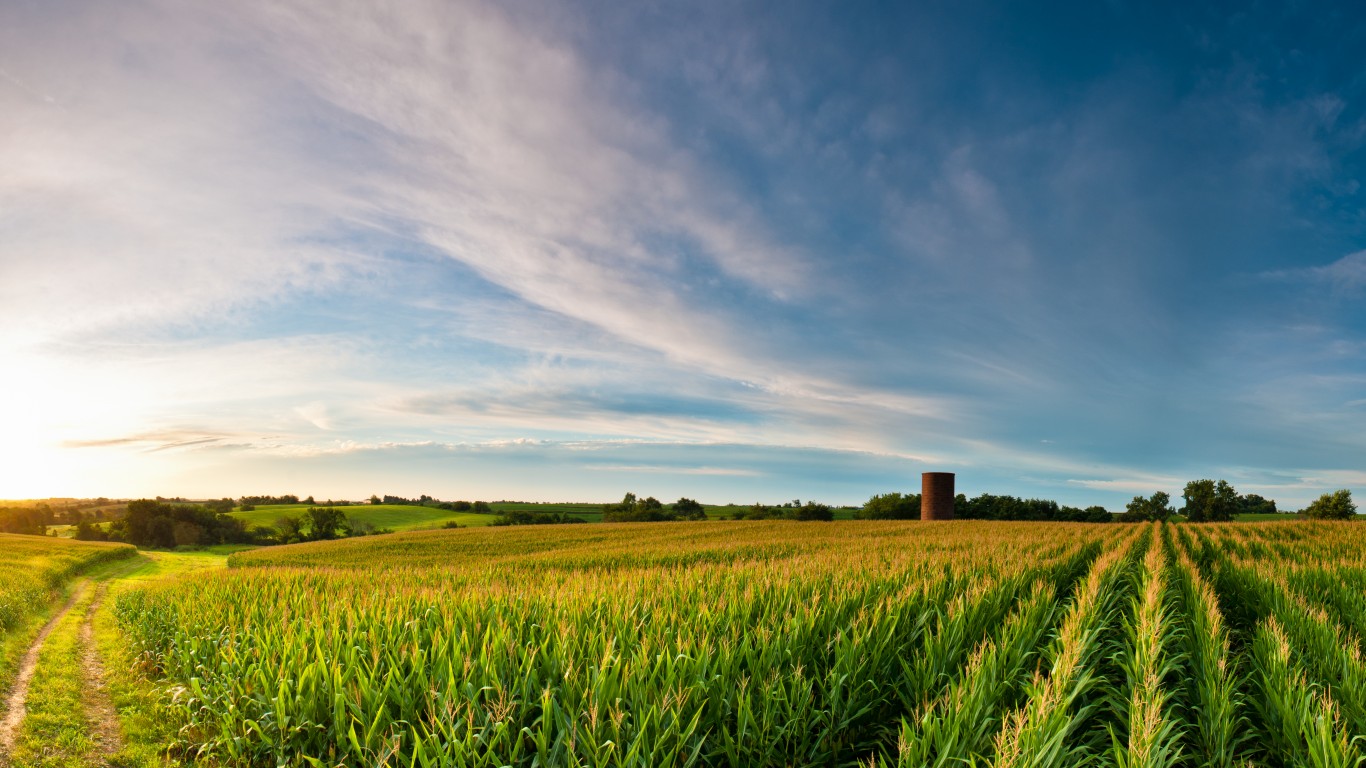
Iowa
> Indigenous population: 11,976
> Pct. of all Iowa residents: 0.38% (19th lowest)
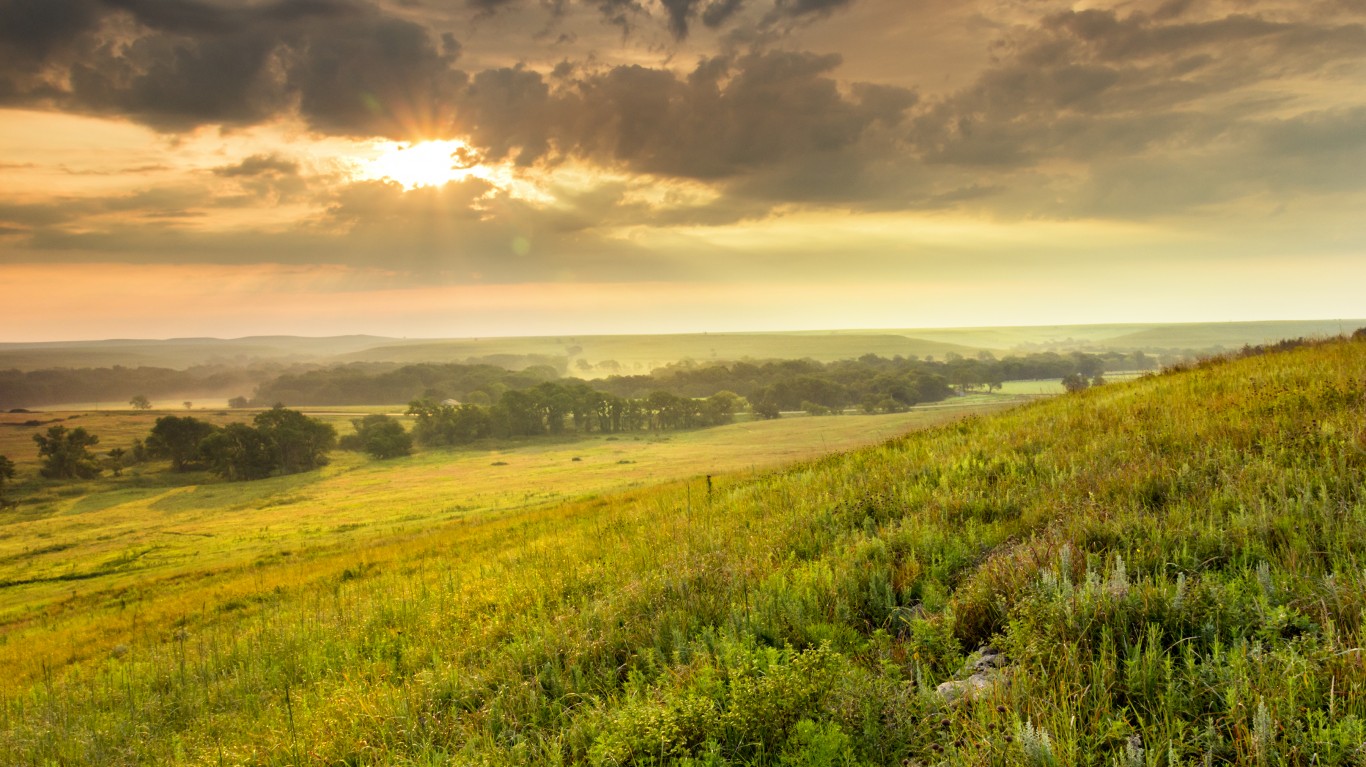
Kansas
> Indigenous population: 24,010
> Pct. of all Kansas residents: 0.82% (19th highest)
[in-text-ad]
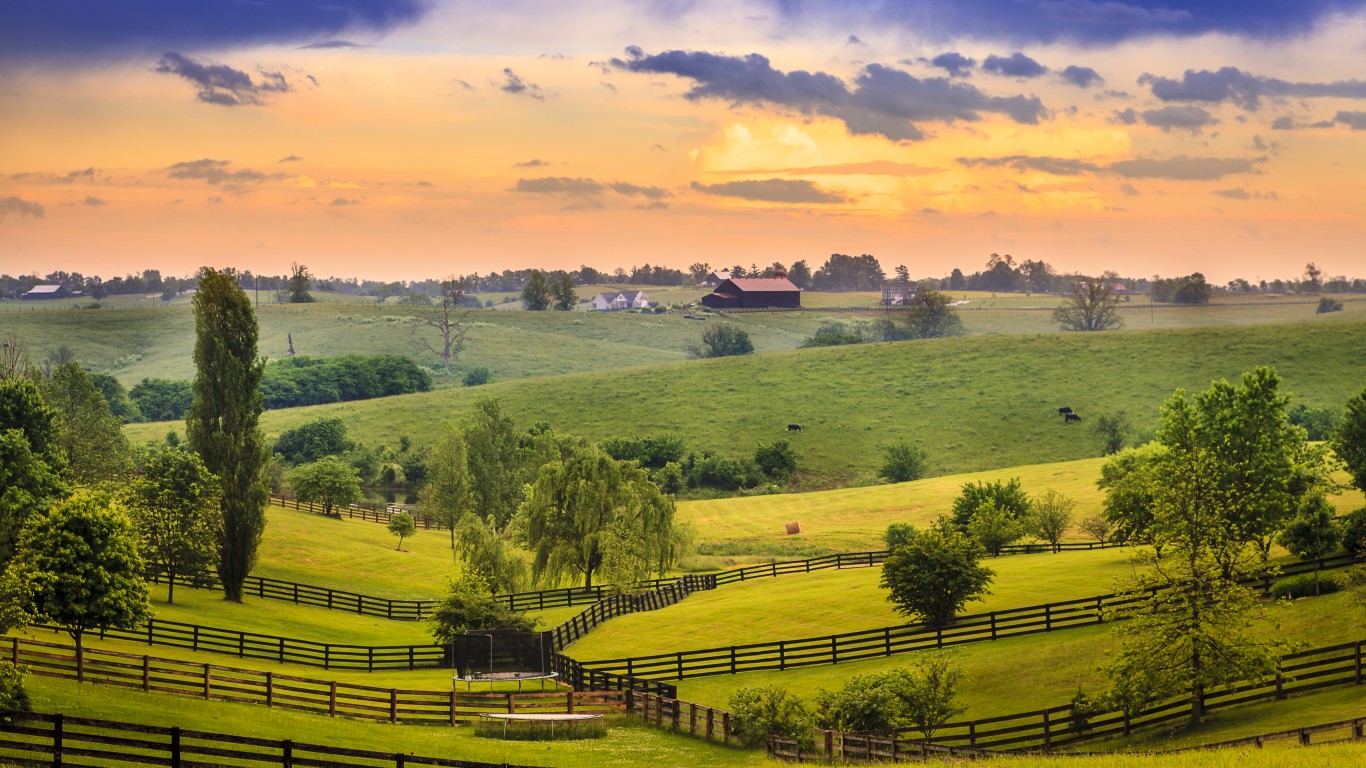
Kentucky
> Indigenous population: 9,386
> Pct. of all Kentucky residents: 0.21% (5th lowest)
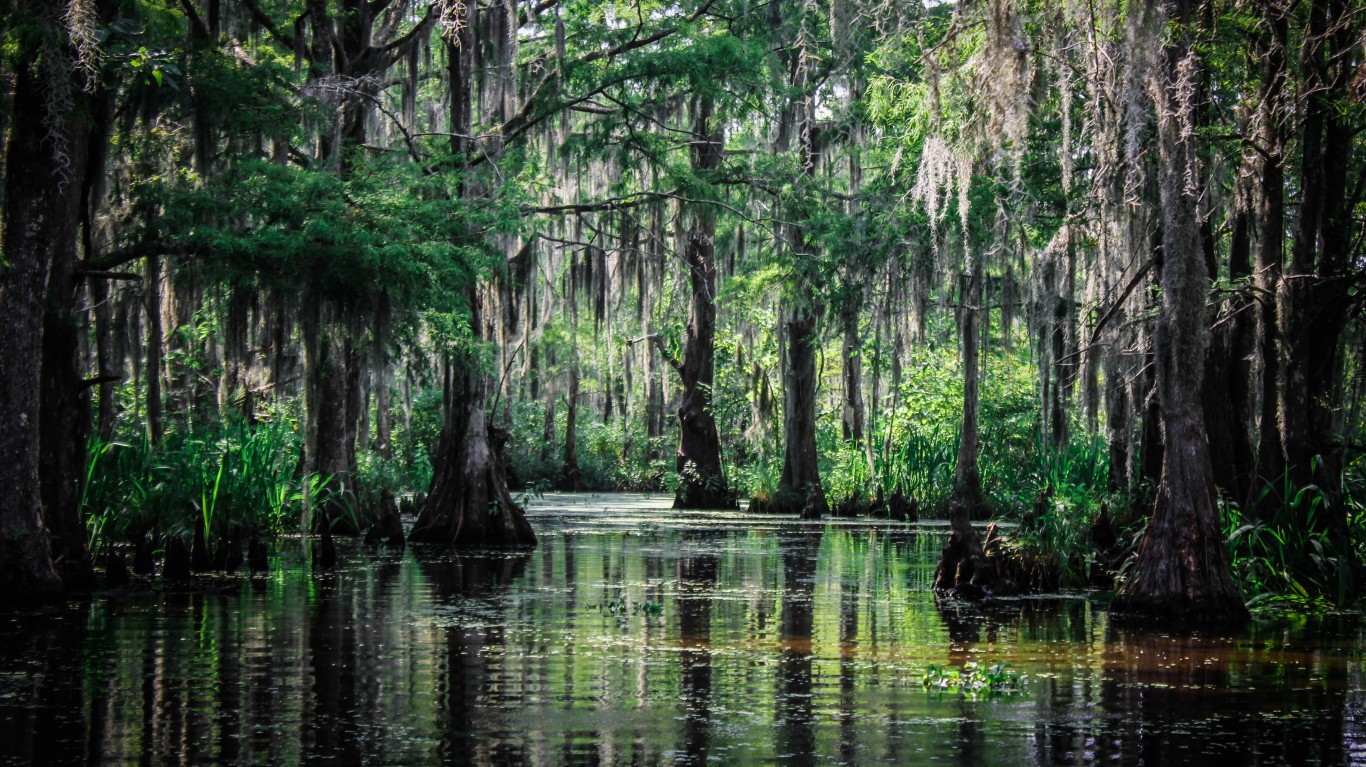
Louisiana
> Indigenous population: 26,361
> Pct. of all Louisiana residents: 0.57% (23rd highest)
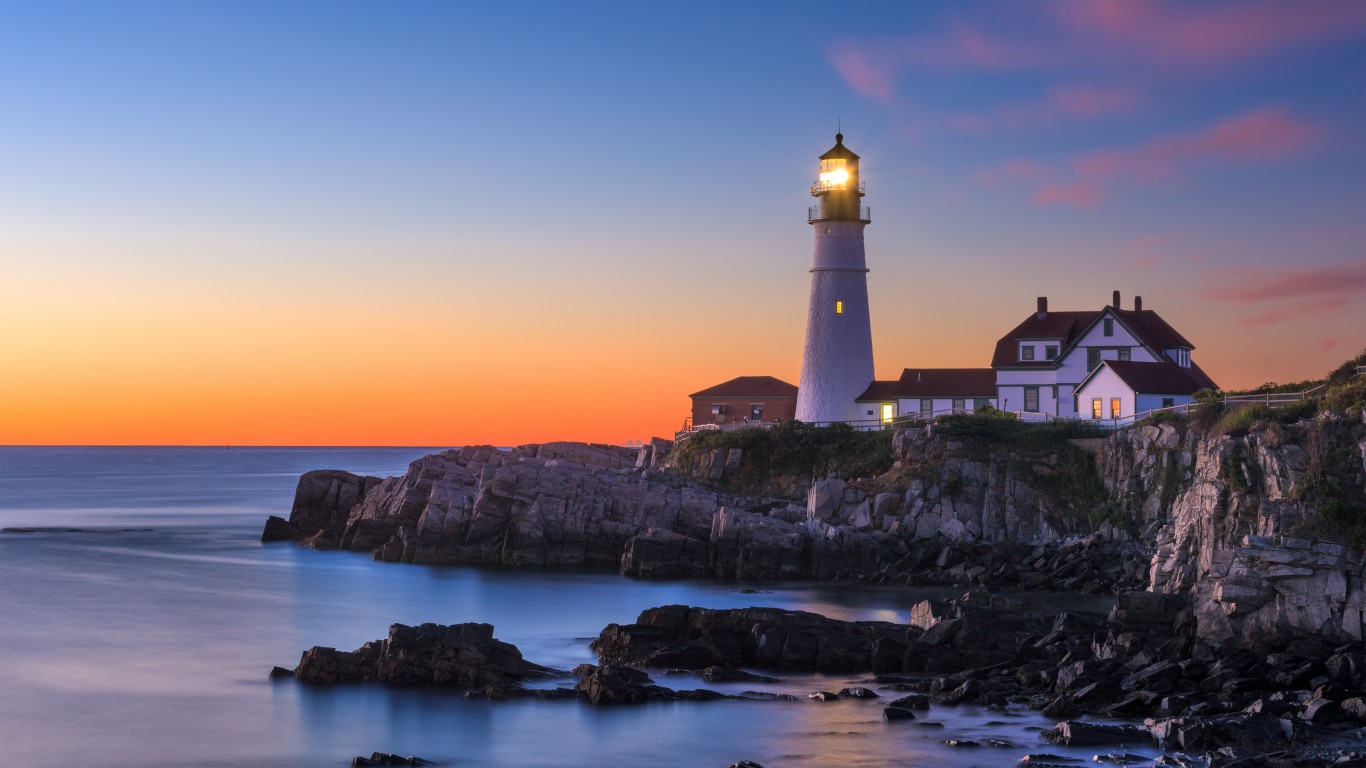
Maine
> Indigenous population: 8,660
> Pct. of all Maine residents: 0.65% (22nd highest)
[in-text-ad-2]
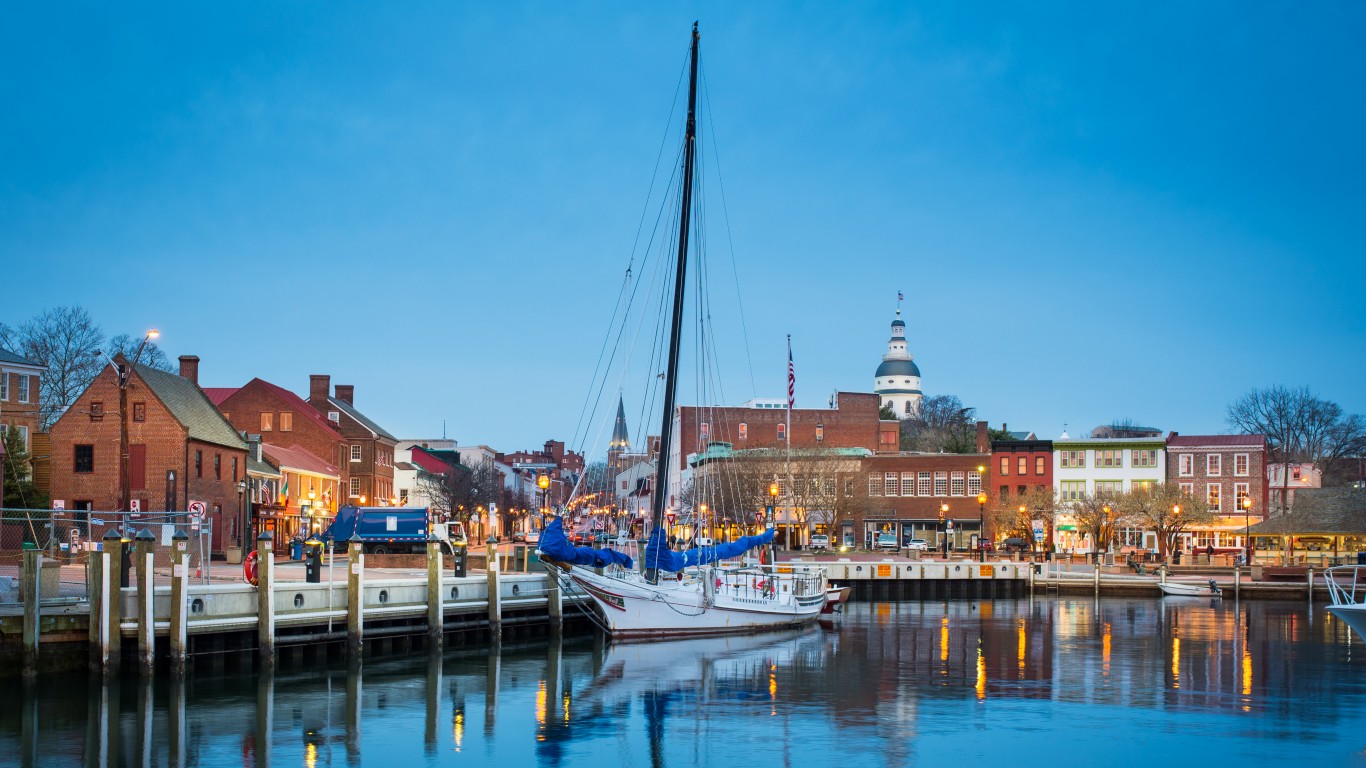
Maryland
> Indigenous population: 16,762
> Pct. of all Maryland residents: 0.28% (13th lowest)
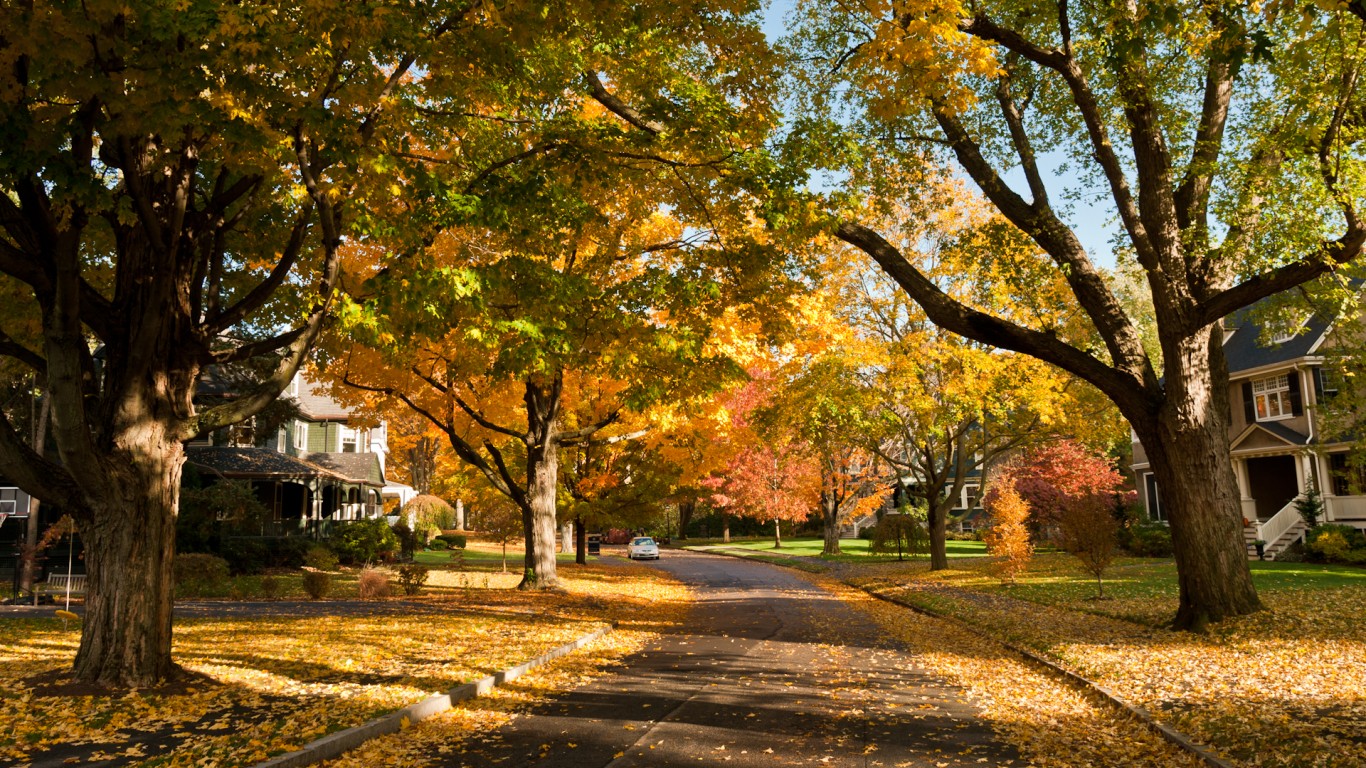
Massachusetts
> Indigenous population: 14,764
> Pct. of all Massachusetts residents: 0.22% (6th lowest)
[in-text-ad]

Michigan
> Indigenous population: 53,316
> Pct. of all Michigan residents: 0.54% (24th highest)
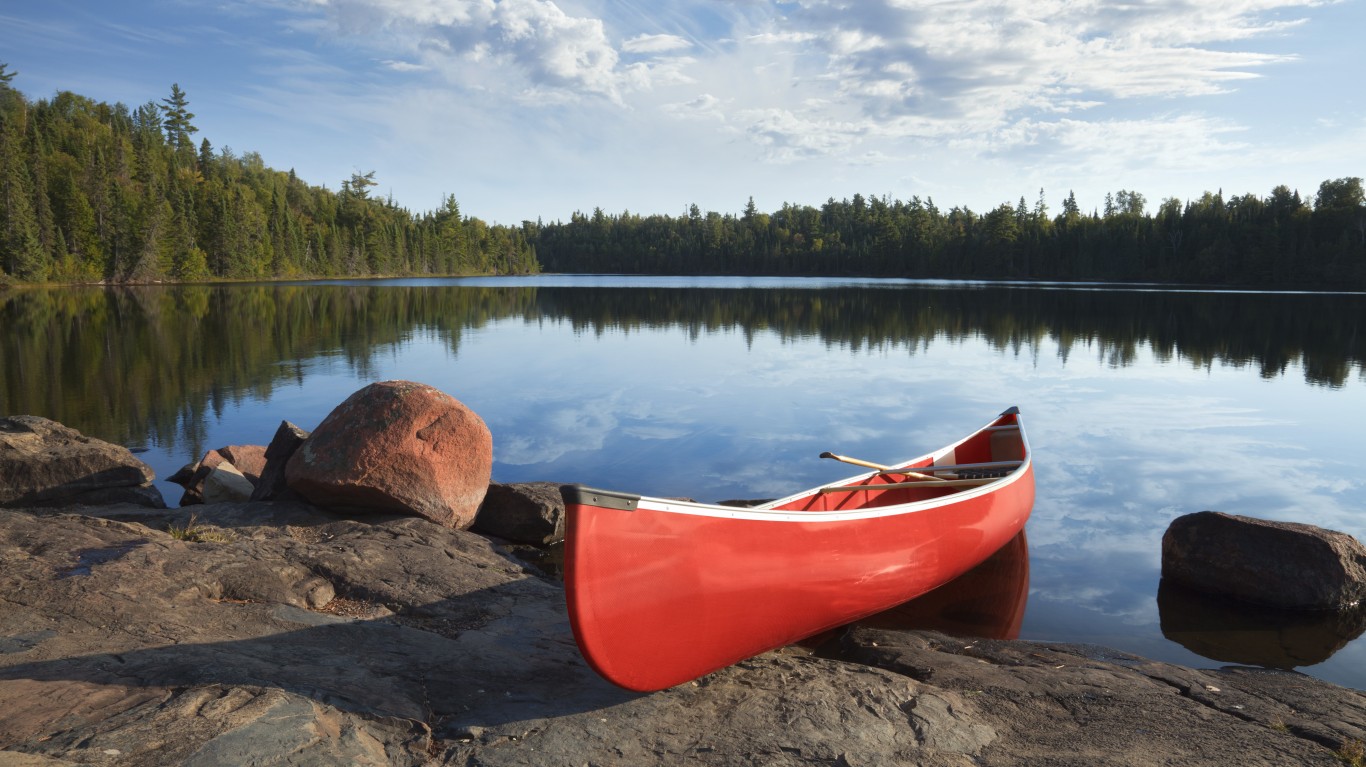
Minnesota
> Indigenous population: 58,011
> Pct. of all Minnesota residents: 1.04% (15th highest)
Mississippi
> Indigenous population: 14,269
> Pct. of all Mississippi residents: 0.48% (23rd lowest)
[in-text-ad-2]
Missouri
> Indigenous population: 27,084
> Pct. of all Missouri residents: 0.44% (22nd lowest)
Montana
> Indigenous population: 66,839
> Pct. of all Montana residents: 6.36% (5th highest)
[in-text-ad]
Nebraska
> Indigenous population: 17,673
> Pct. of all Nebraska residents: 0.92% (17th highest)
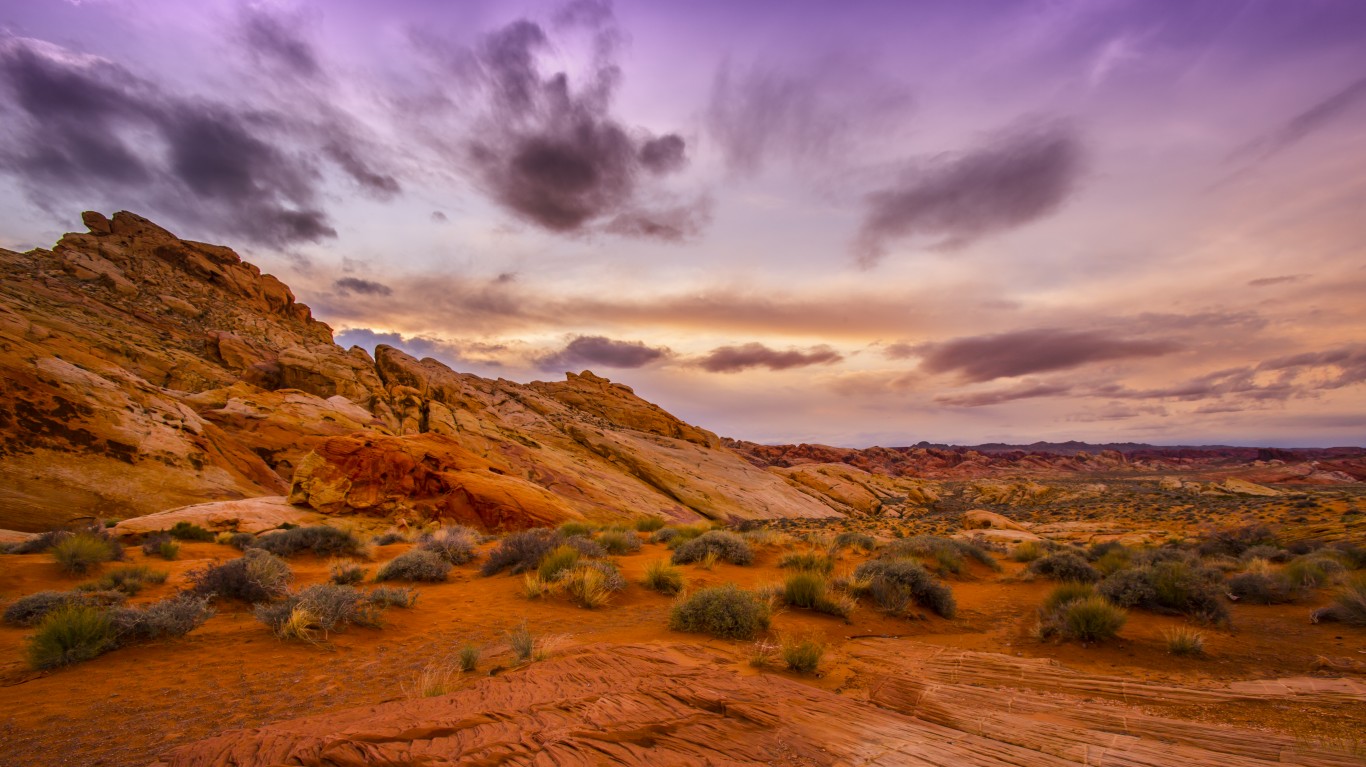
Nevada
> Indigenous population: 38,026
> Pct. of all Nevada residents: 1.28% (10th highest)
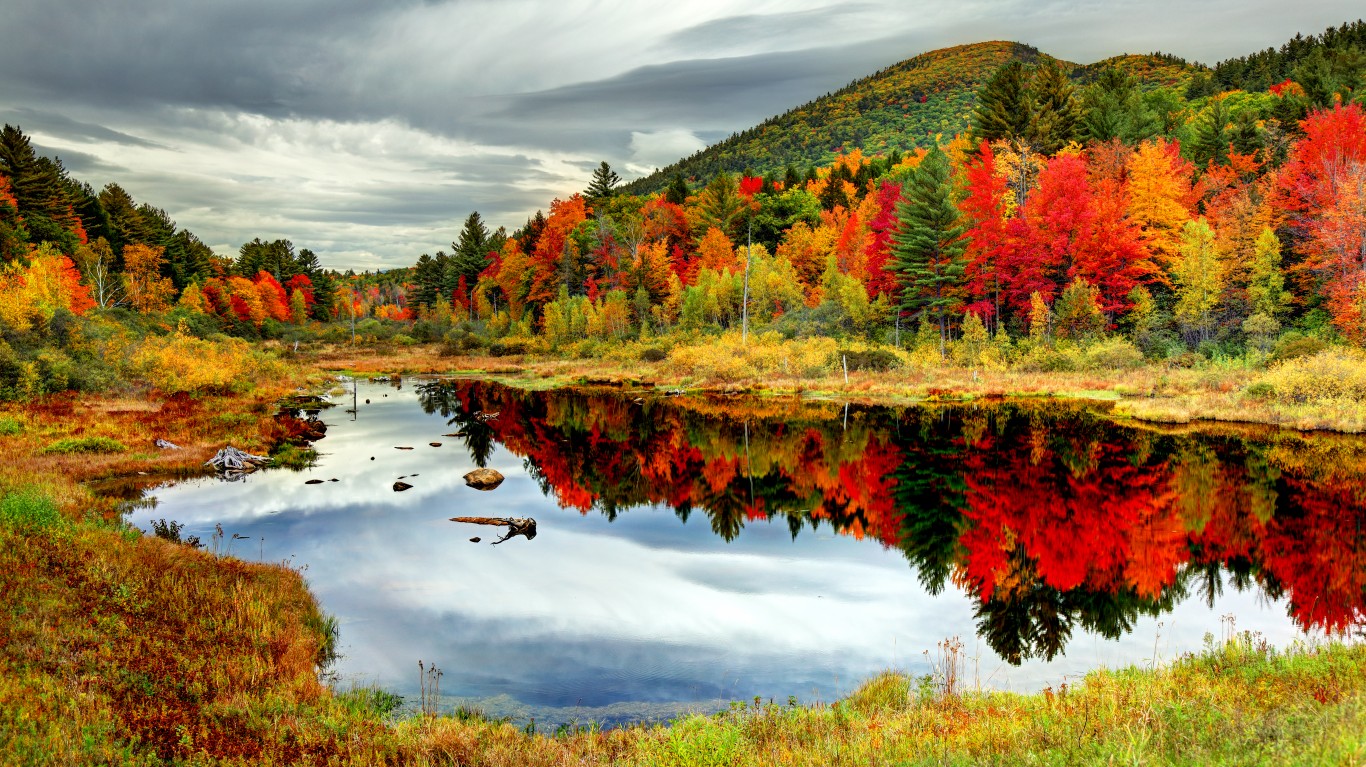
New Hampshire
> Indigenous population: 2,036
> Pct. of all New Hampshire residents: 0.15% (the lowest)
[in-text-ad-2]
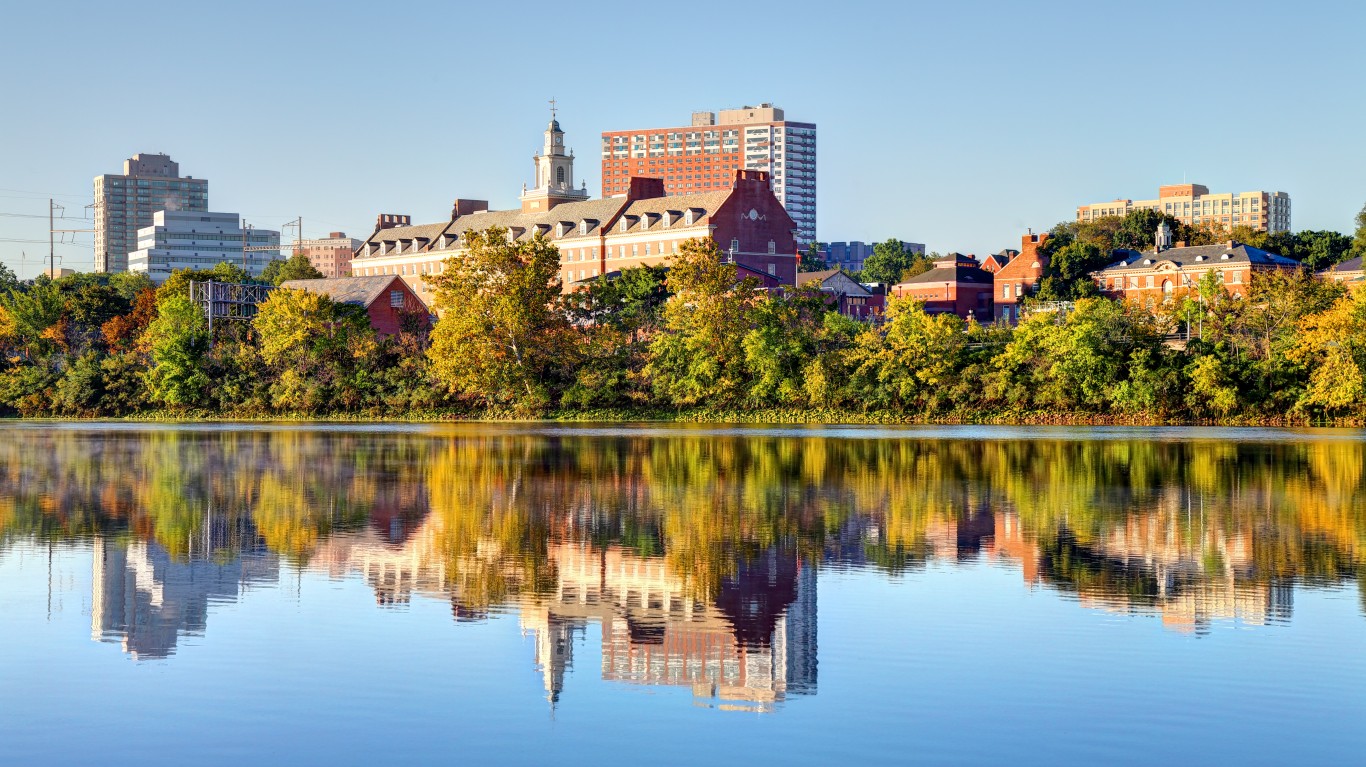
New Jersey
> Indigenous population: 19,711
> Pct. of all New Jersey residents: 0.22% (7th lowest)
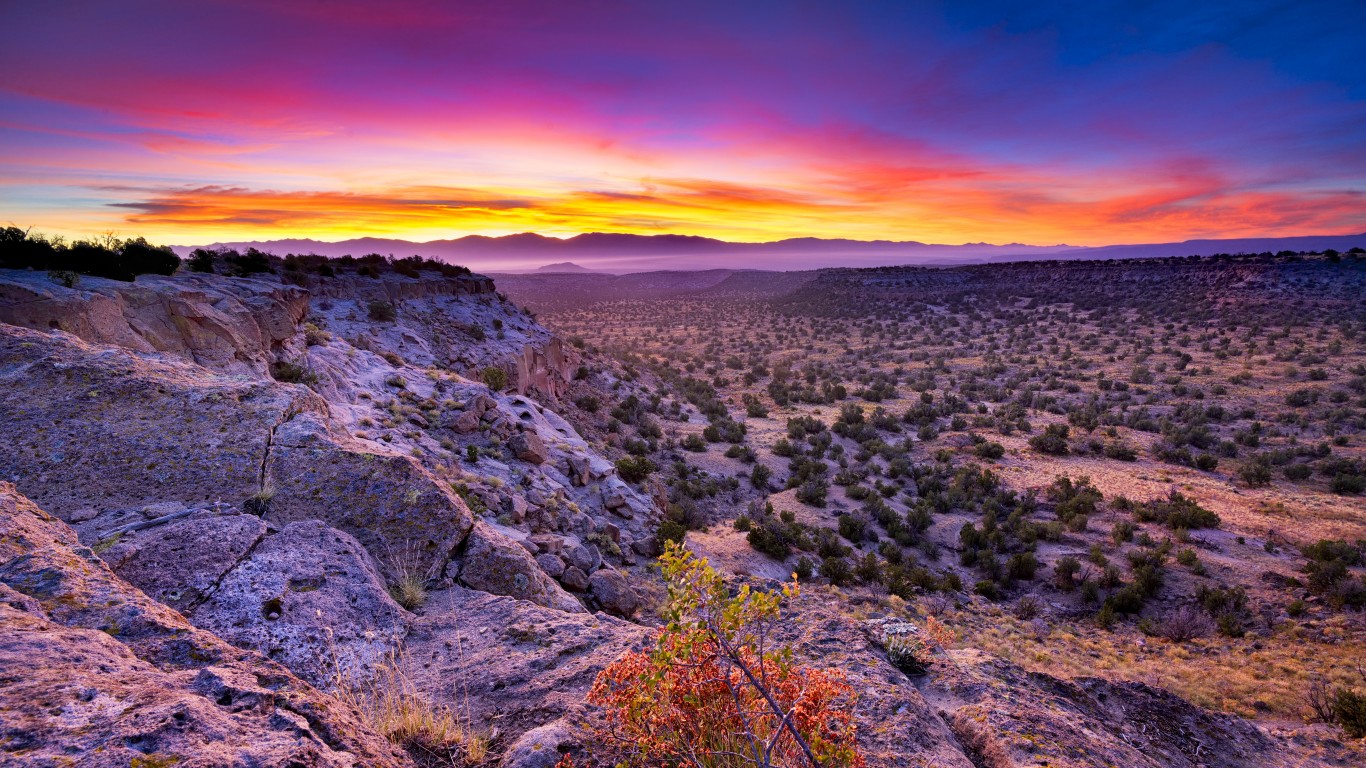
New Mexico
> Indigenous population: 199,845
> Pct. of all New Mexico residents: 9.55% (2nd highest)
[in-text-ad]
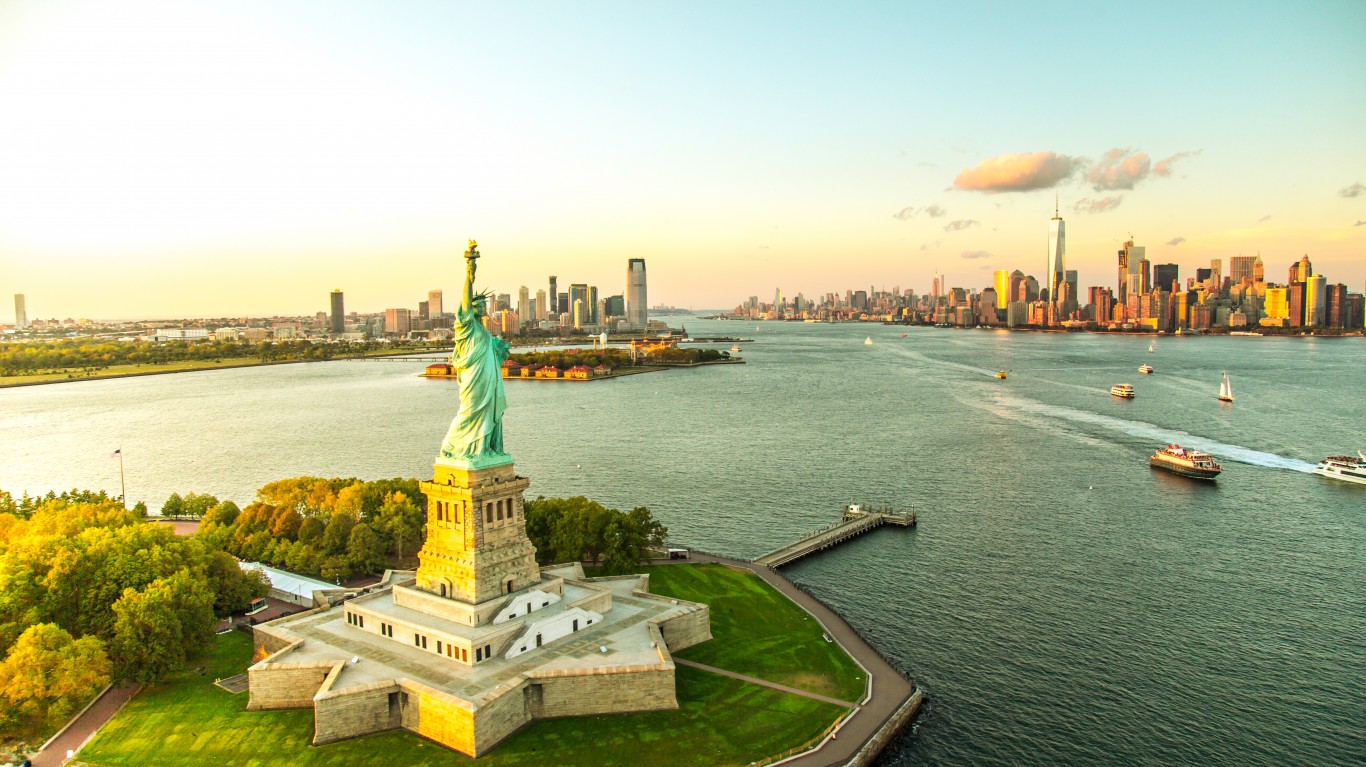
New York
> Indigenous population: 79,512
> Pct. of all New York residents: 0.41% (21st lowest)
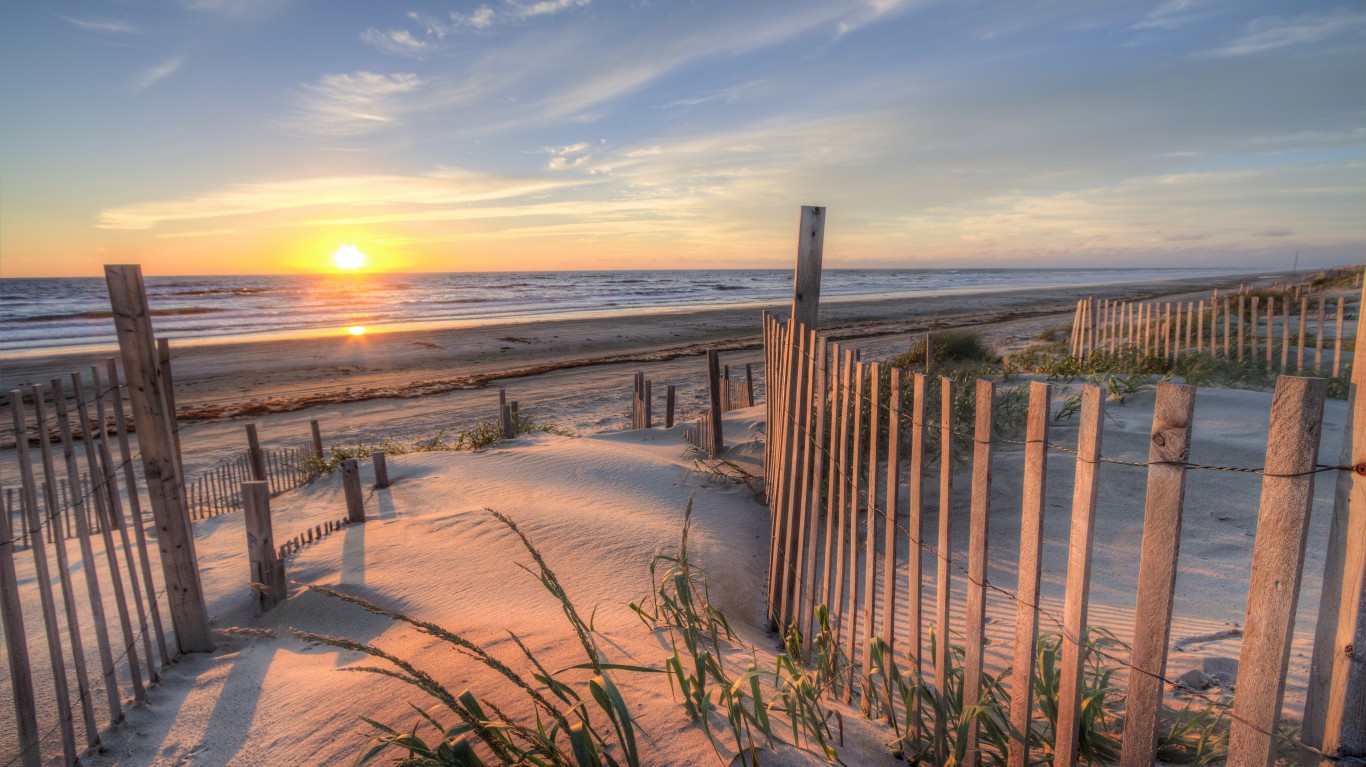
North Carolina
> Indigenous population: 123,952
> Pct. of all North Carolina residents: 1.21% (12th highest)
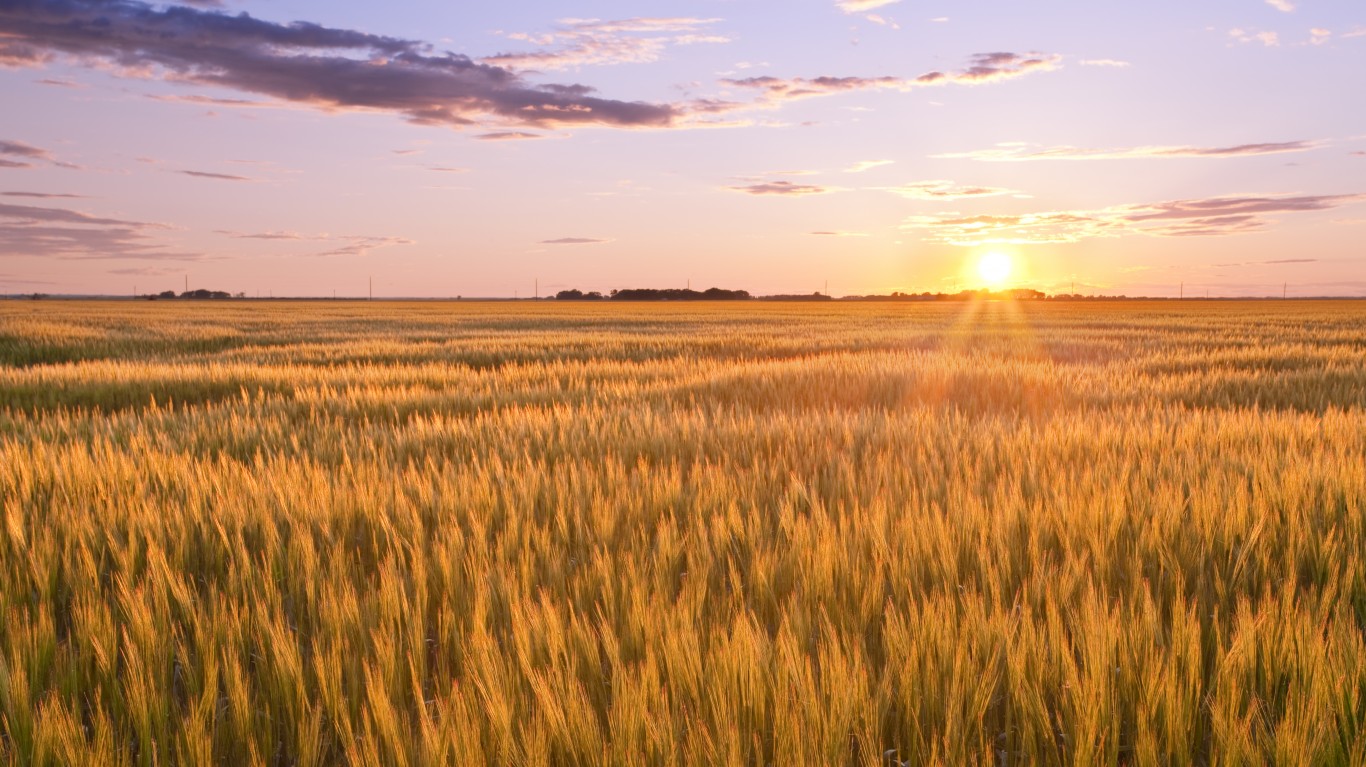
North Dakota
> Indigenous population: 40,006
> Pct. of all North Dakota residents: 5.29% (6th highest)
[in-text-ad-2]
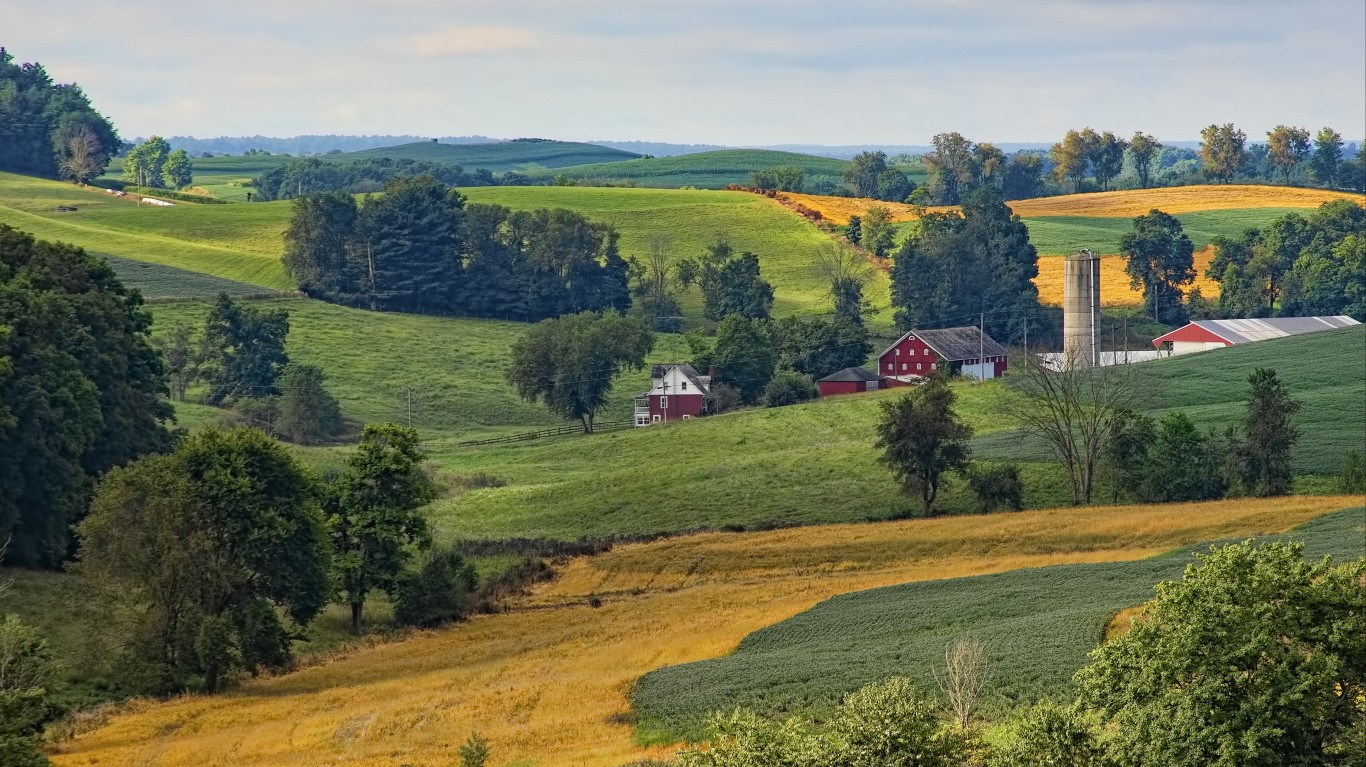
Ohio
> Indigenous population: 22,816
> Pct. of all Ohio residents: 0.20% (3rd lowest)
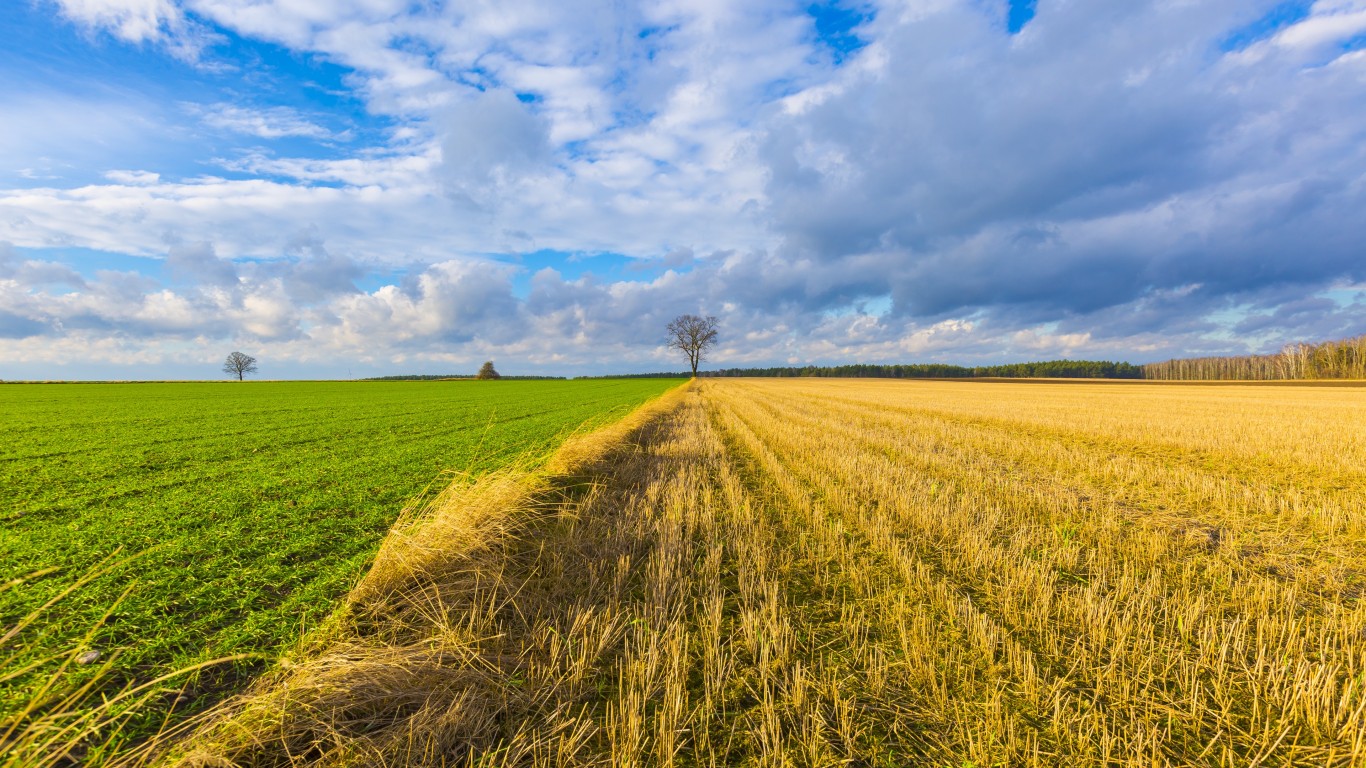
Oklahoma
> Indigenous population: 299,621
> Pct. of all Oklahoma residents: 7.62% (4th highest)
[in-text-ad]
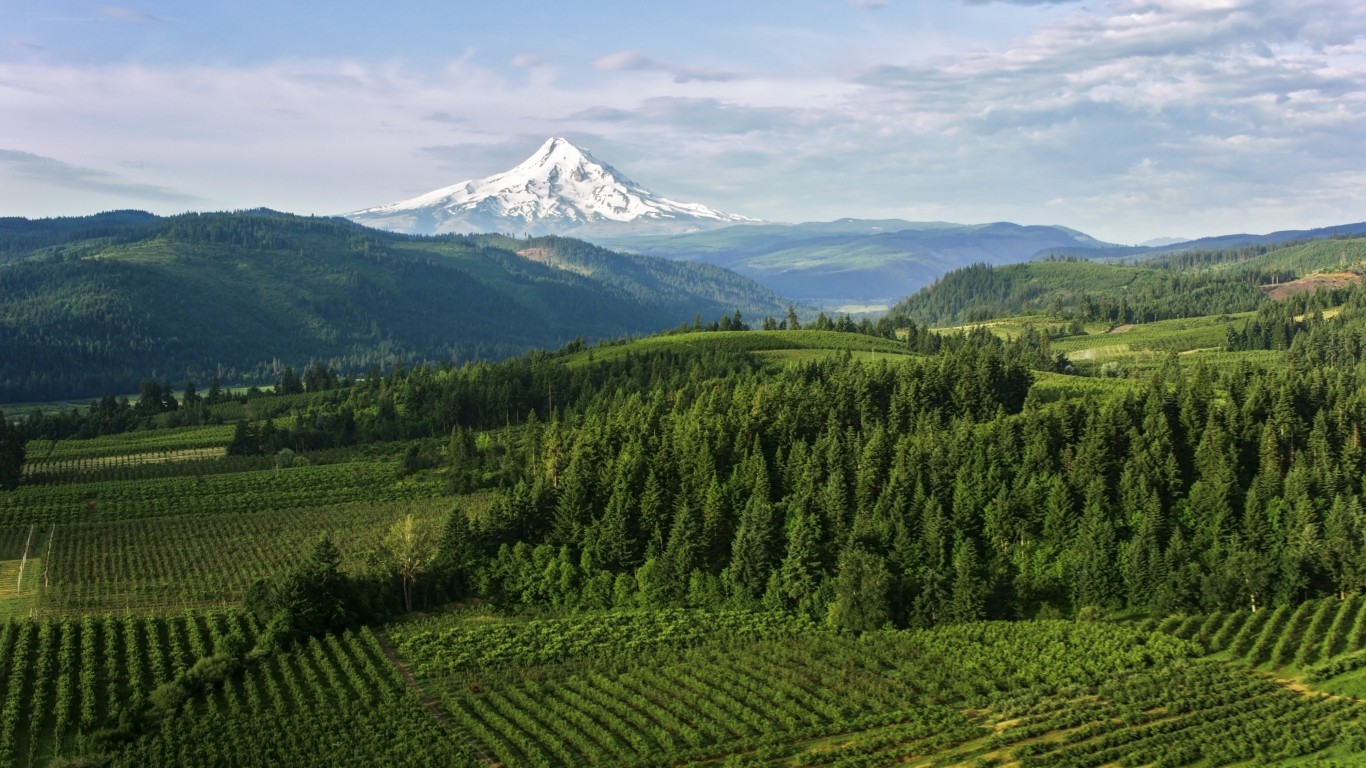
Oregon
> Indigenous population: 48,060
> Pct. of all Oregon residents: 1.16% (13th highest)
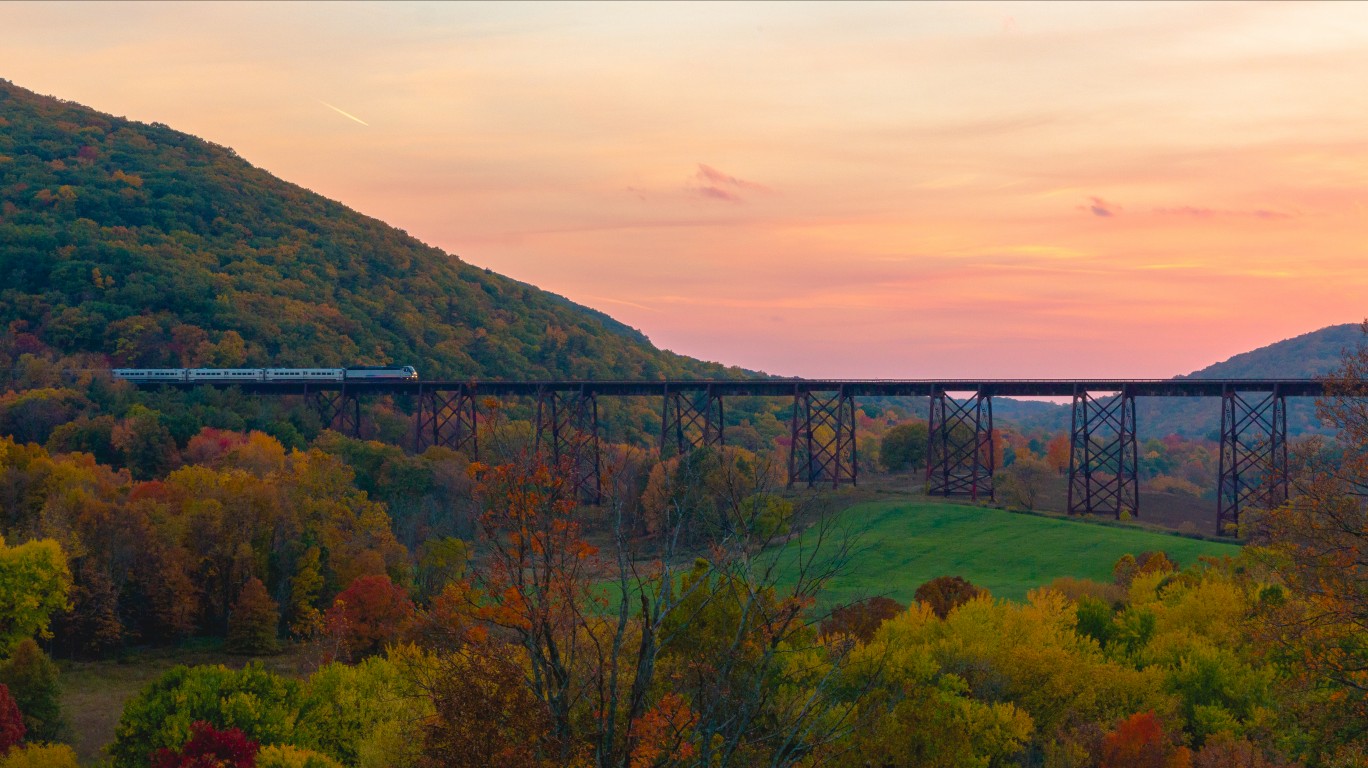
Pennsylvania
> Indigenous population: 24,691
> Pct. of all Pennsylvania residents: 0.19% (2nd lowest)
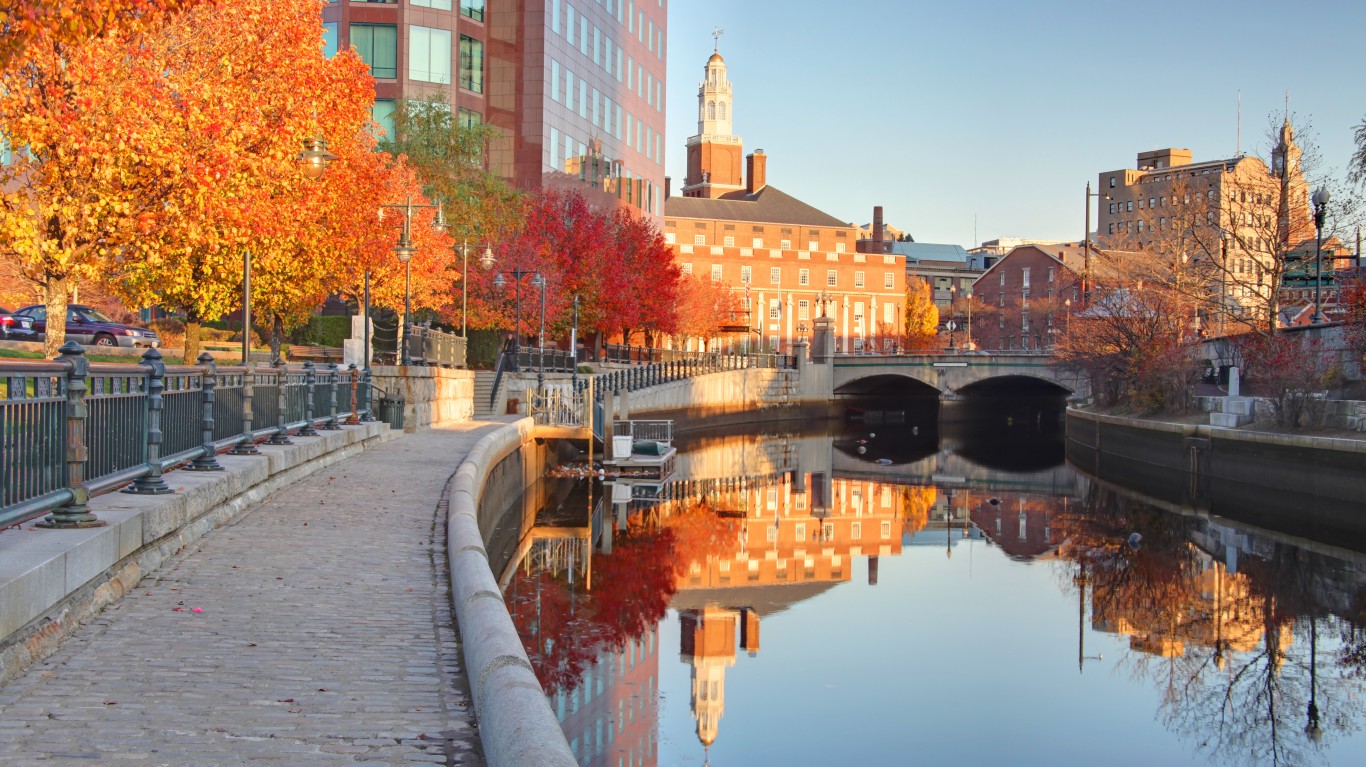
Rhode Island
> Indigenous population: 5,277
> Pct. of all Rhode Island residents: 0.50% (24th lowest)
[in-text-ad-2]
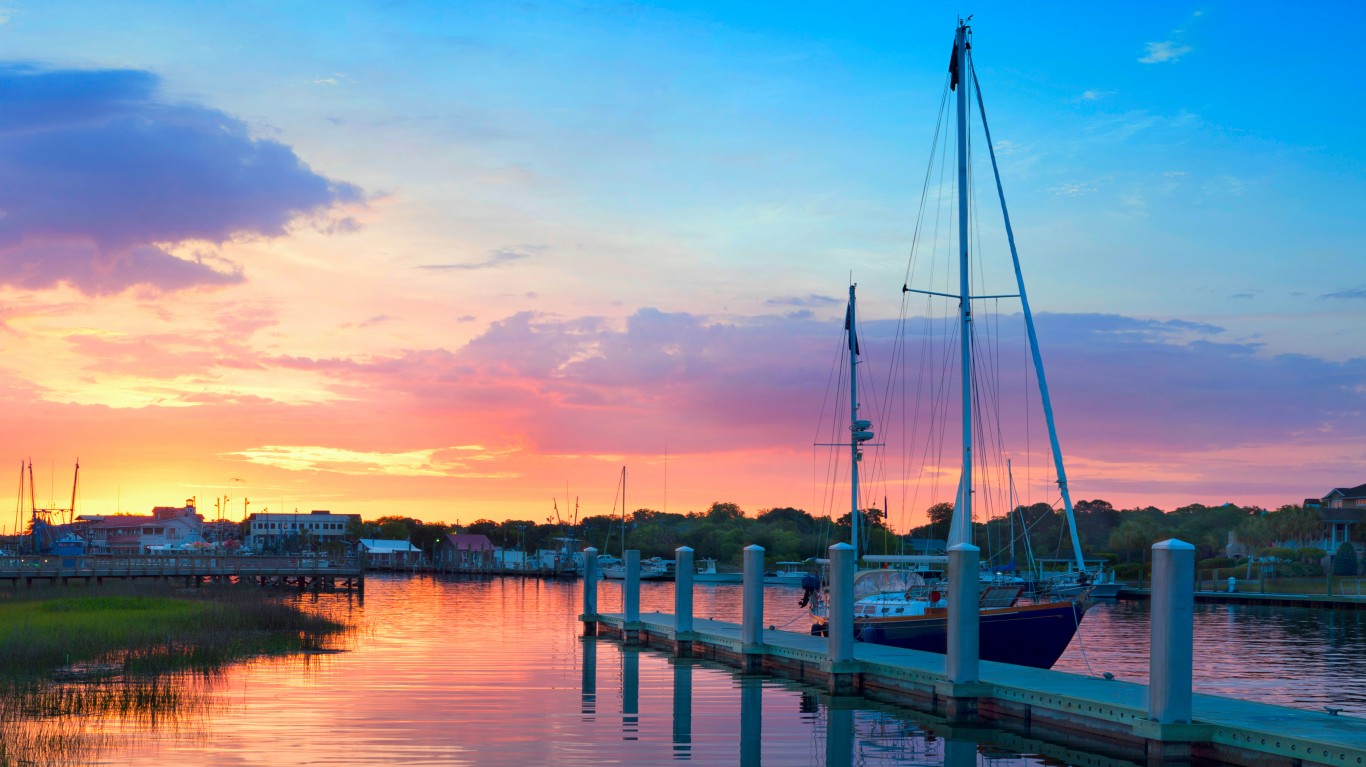
South Carolina
> Indigenous population: 17,645
> Pct. of all South Carolina residents: 0.35% (17th lowest)
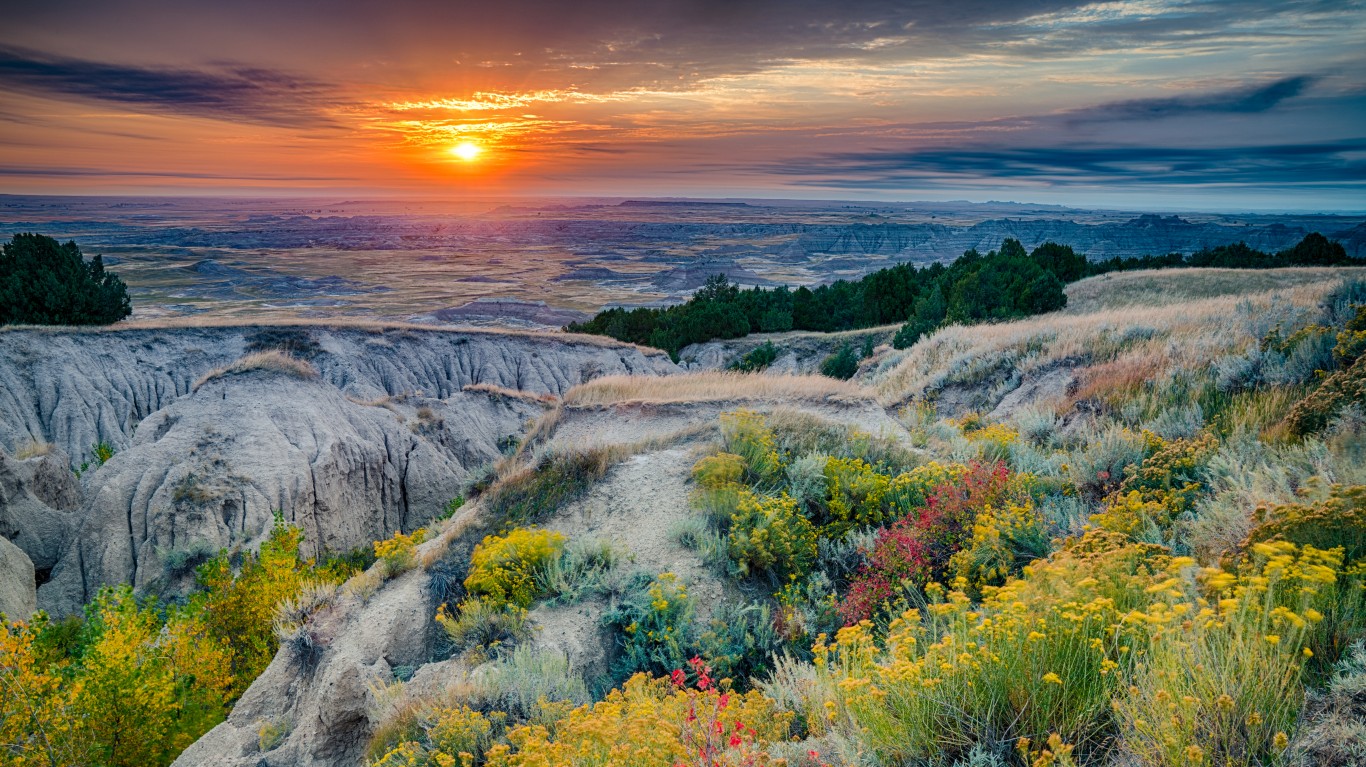
South Dakota
> Indigenous population: 76,190
> Pct. of all South Dakota residents: 8.75% (3rd highest)
[in-text-ad]
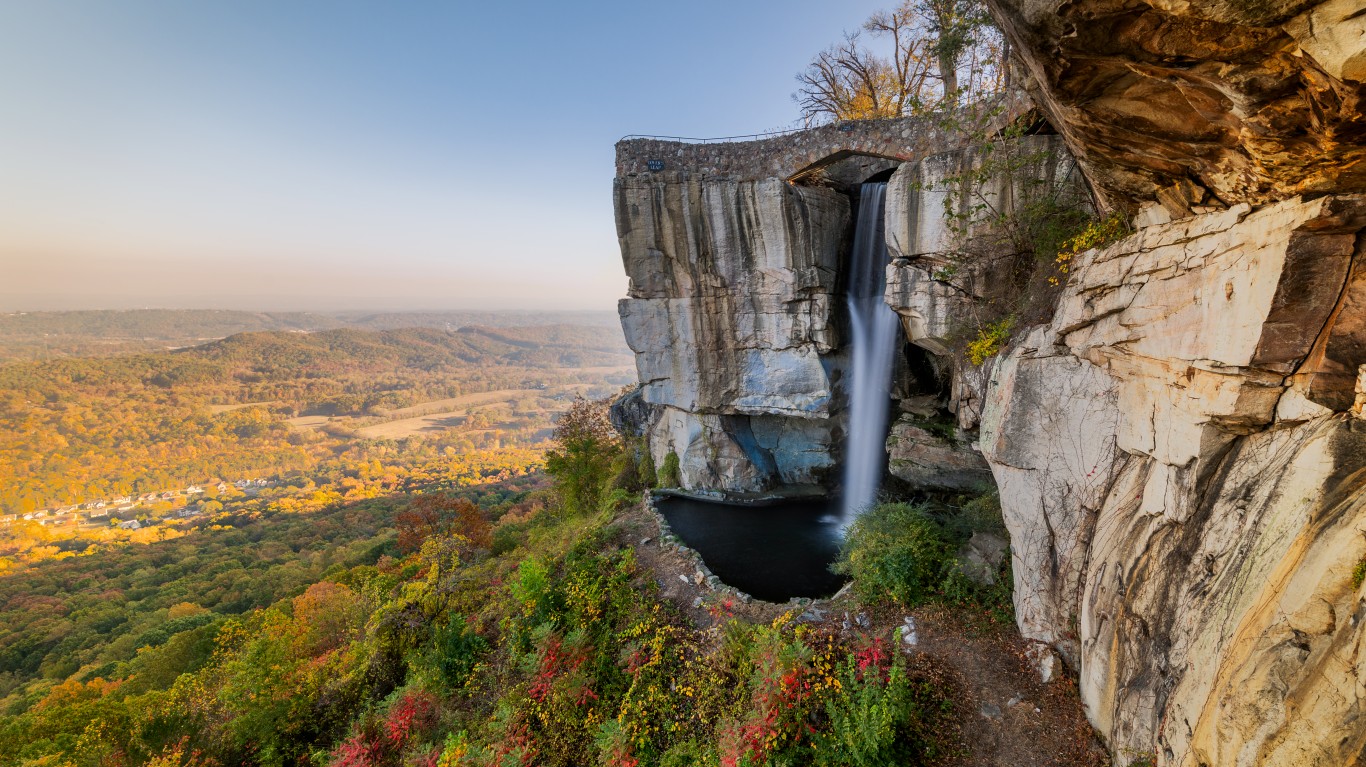
Tennessee
> Indigenous population: 18,189
> Pct. of all Tennessee residents: 0.27% (11th lowest)
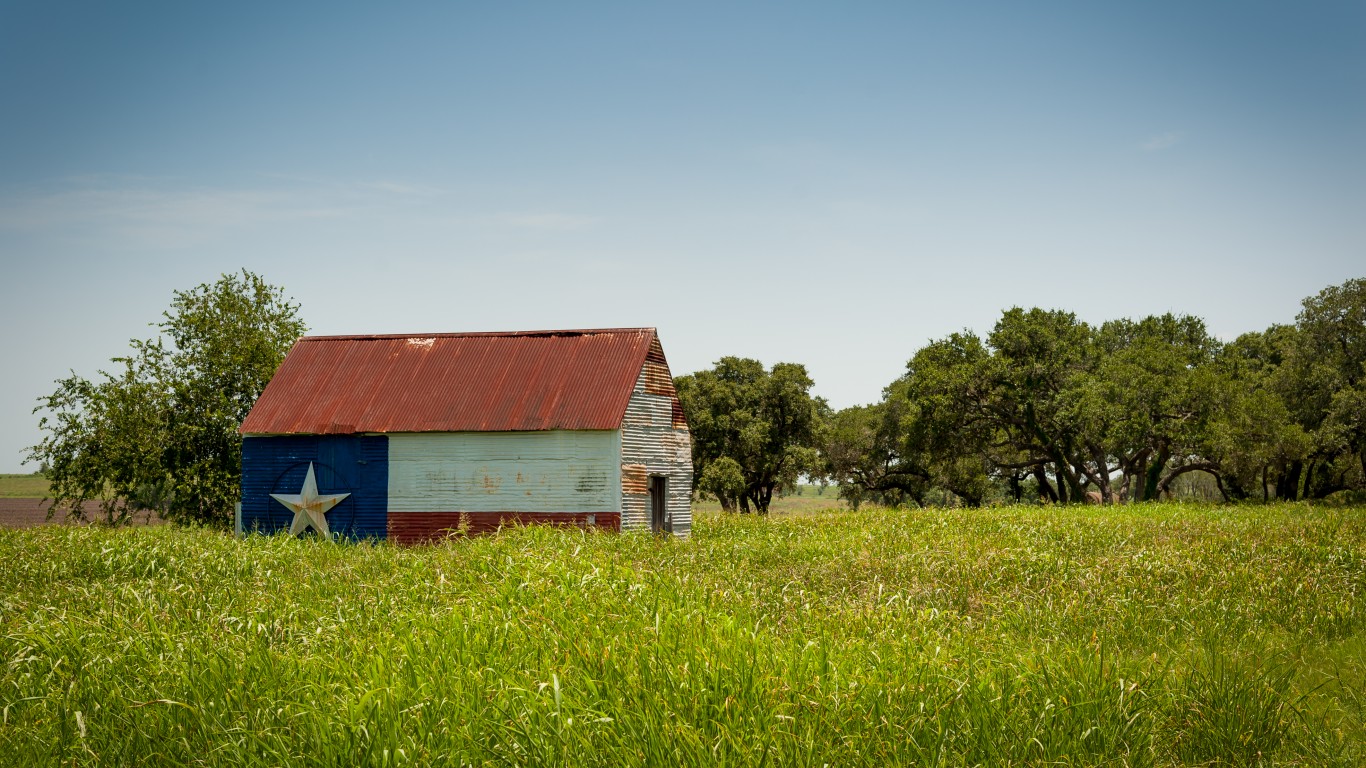
Texas
> Indigenous population: 141,425
> Pct. of all Texas residents: 0.50% (25th lowest)
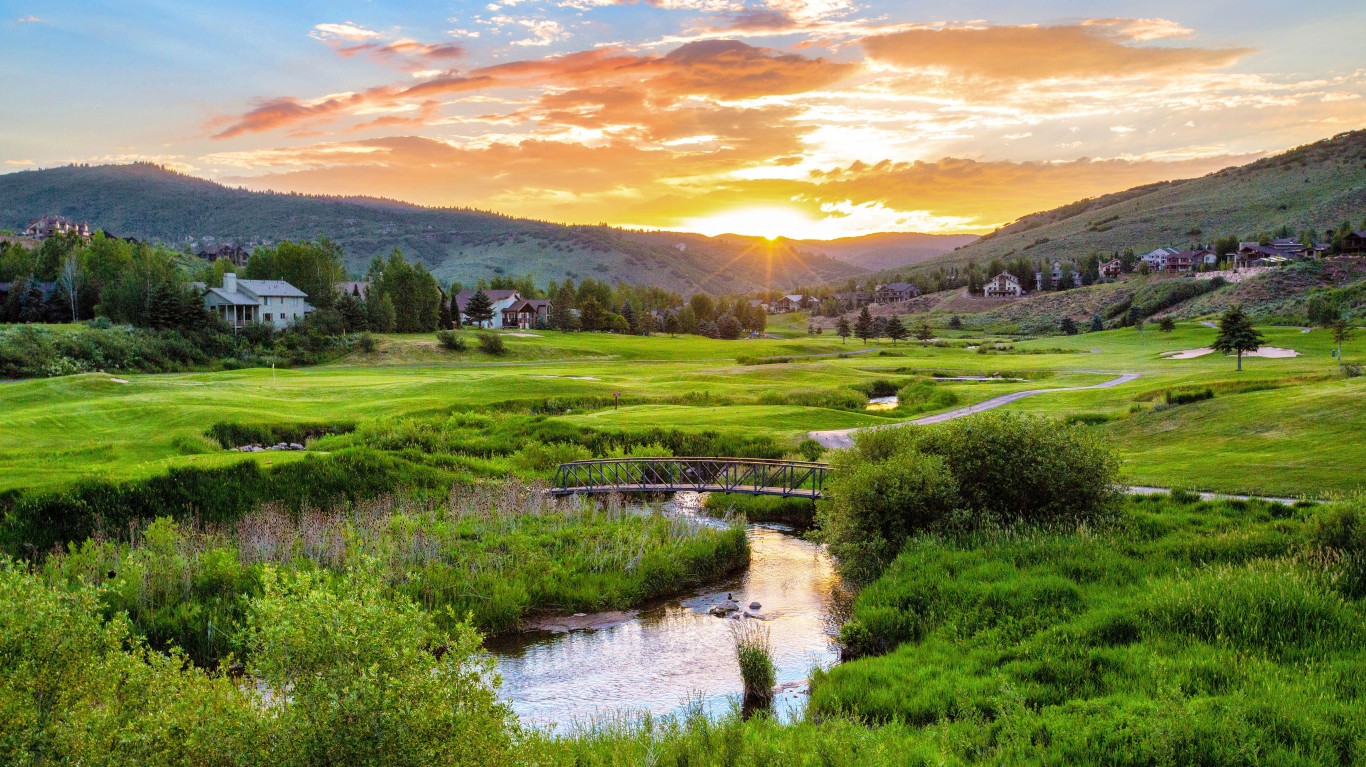
Utah
> Indigenous population: 33,721
> Pct. of all Utah residents: 1.09% (14th highest)
[in-text-ad-2]
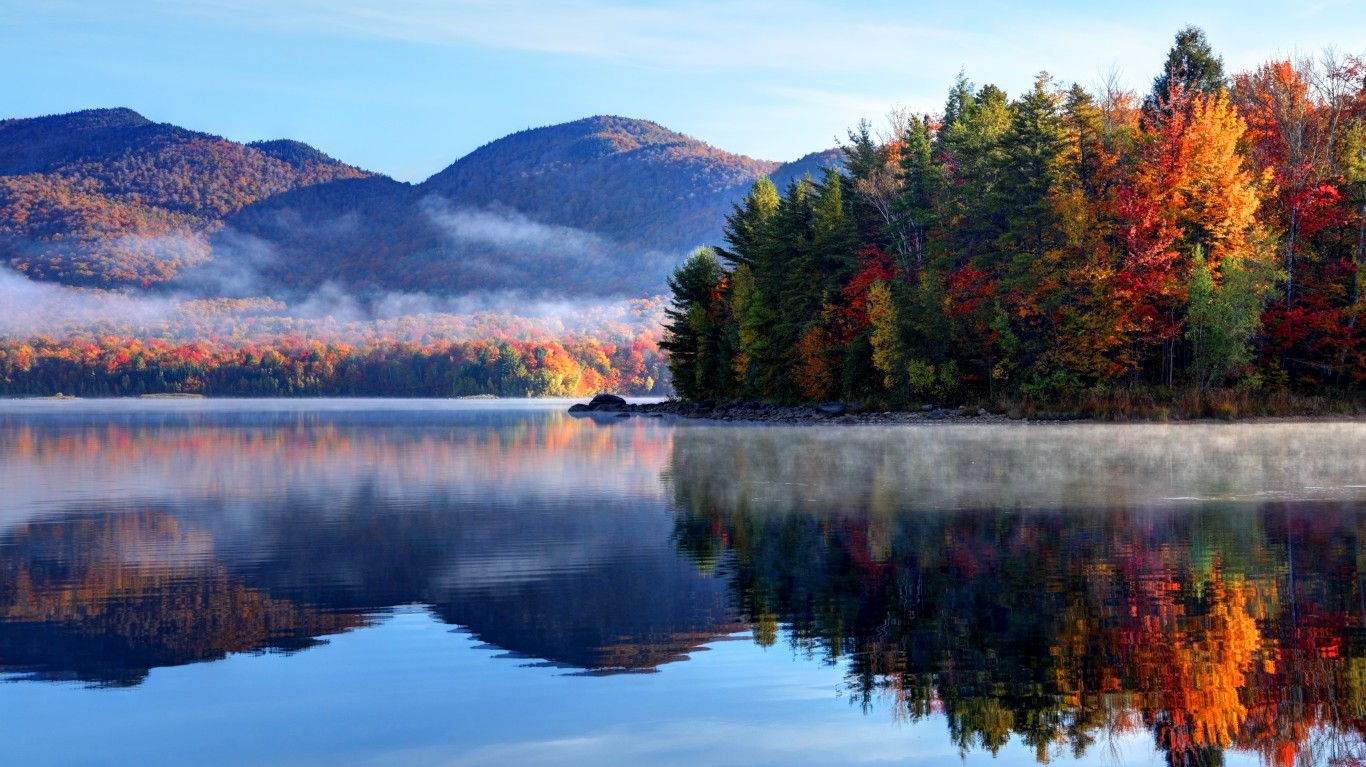
Vermont
> Indigenous population: 2,132
> Pct. of all Vermont residents: 0.34% (16th lowest)

Virginia
> Indigenous population: 23,873
> Pct. of all Virginia residents: 0.28% (14th lowest)
[in-text-ad]

Washington
> Indigenous population: 94,449
> Pct. of all Washington residents: 1.28% (11th highest)
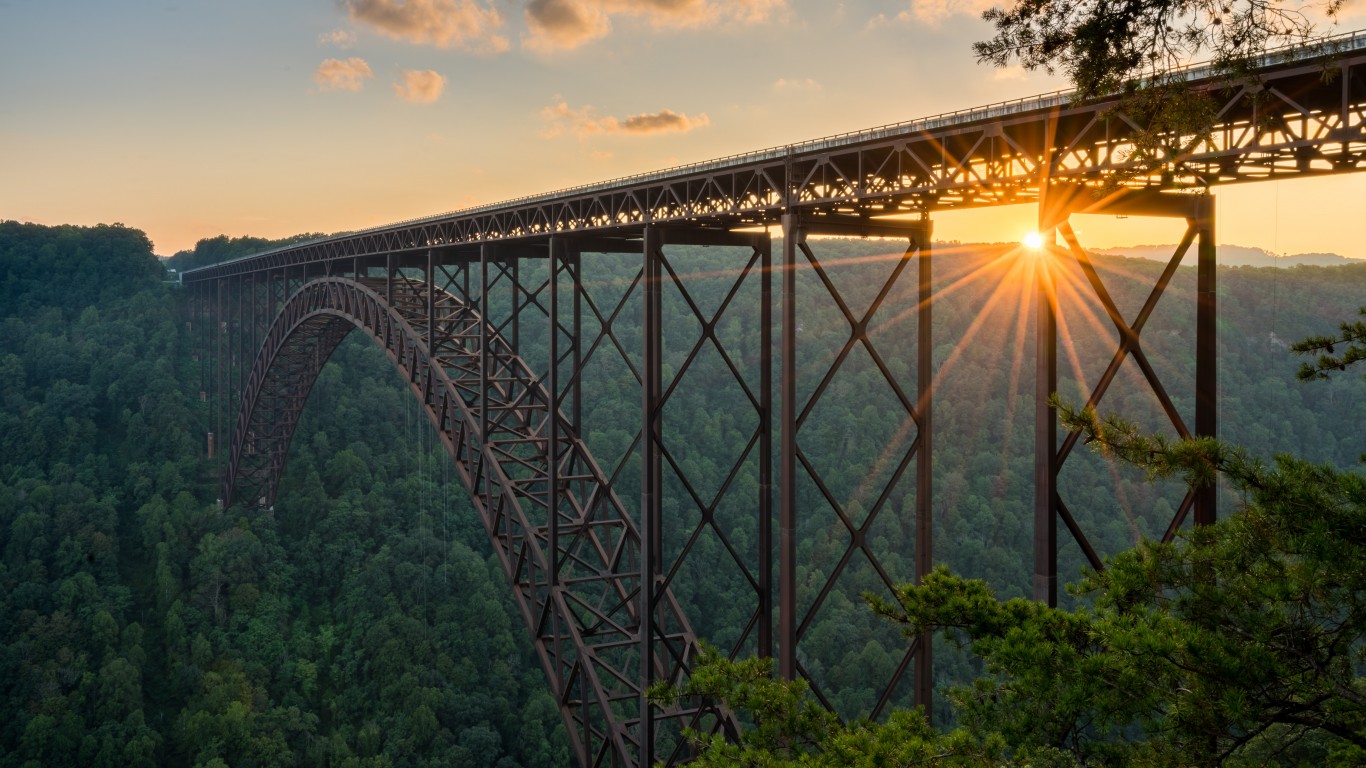
West Virginia
> Indigenous population: 3,667
> Pct. of all West Virginia residents: 0.20% (4th lowest)
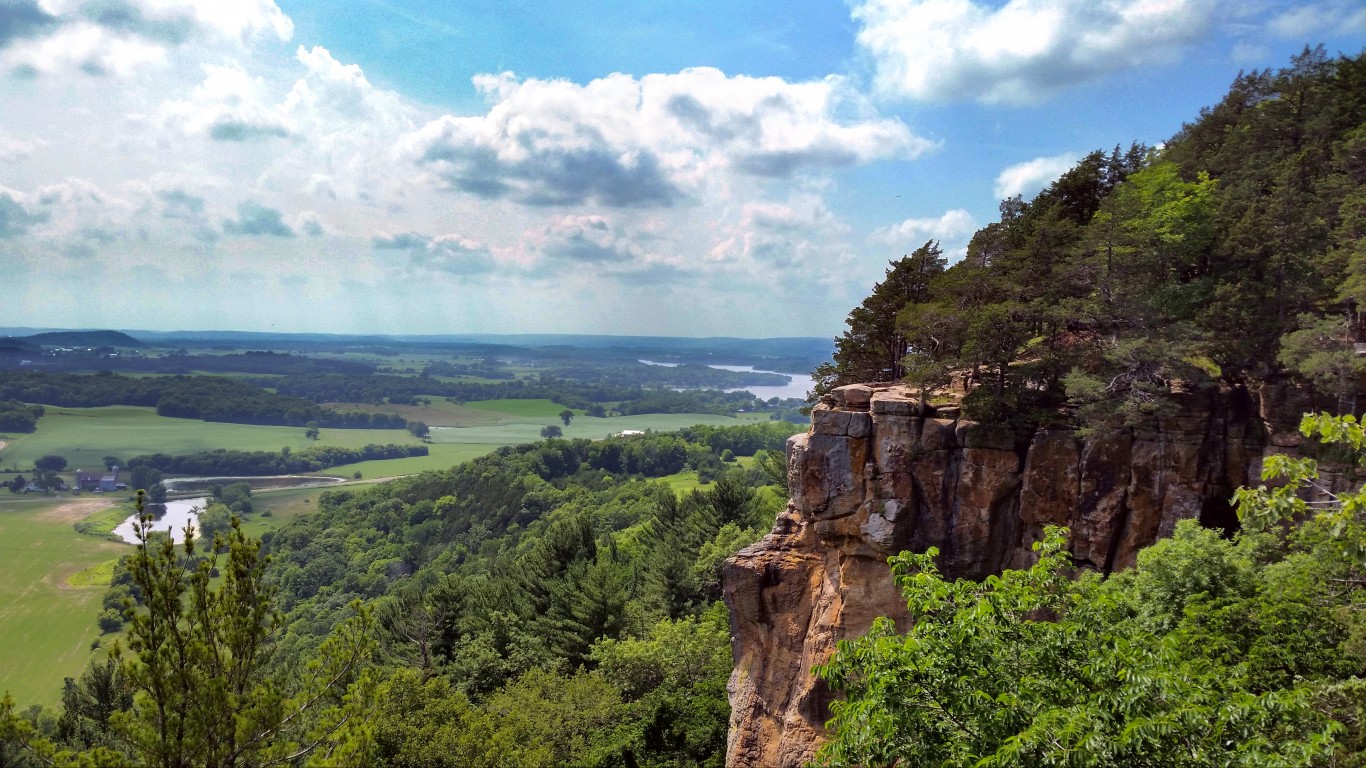
Wisconsin
> Indigenous population: 51,392
> Pct. of all Wisconsin residents: 0.89% (18th highest)
[in-text-ad-2]
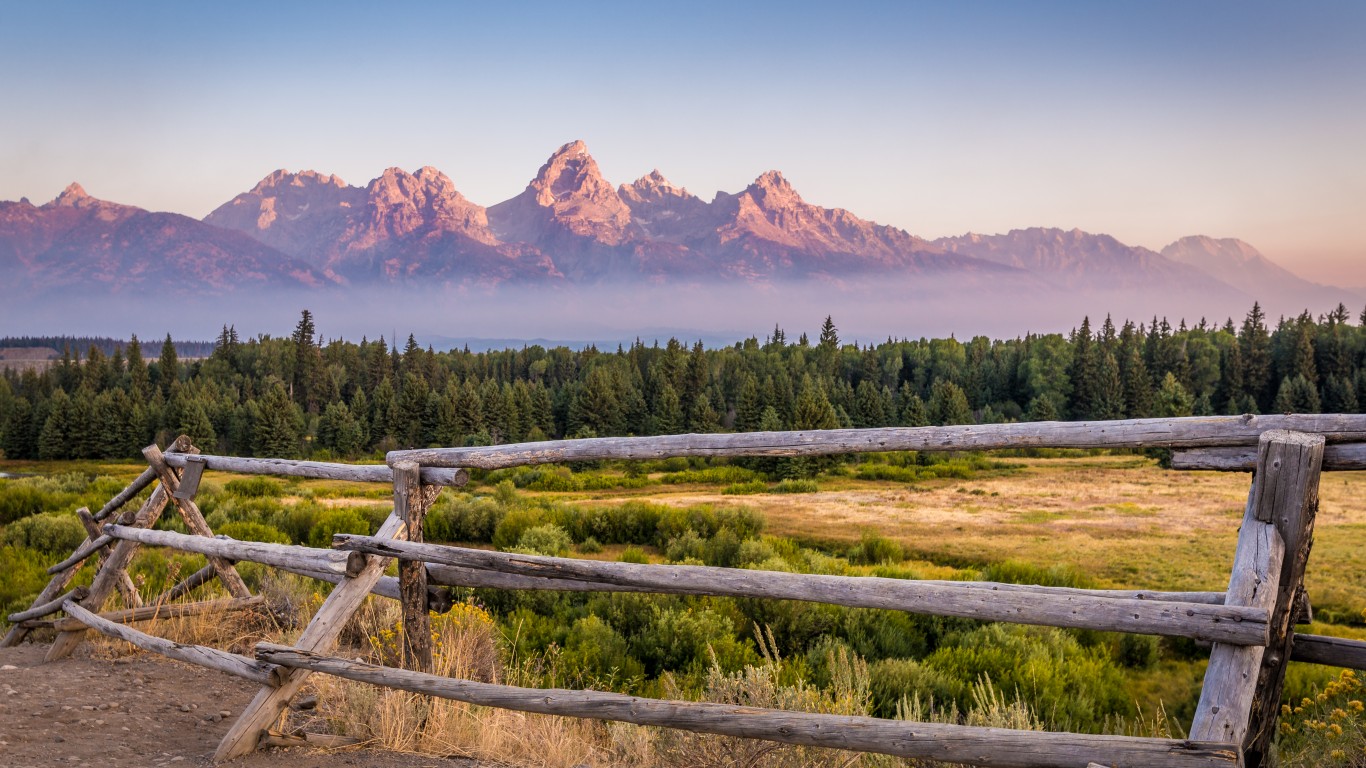
Wyoming
> Indigenous population: 14,164
> Pct. of all Wyoming residents: 2.44% (8th highest)
Cash Back Credit Cards Have Never Been This Good
Credit card companies are at war, handing out free rewards and benefits to win the best customers. A good cash back card can be worth thousands of dollars a year in free money, not to mention other perks like travel, insurance, and access to fancy lounges. See our top picks for the best credit cards today. You won’t want to miss some of these offers.
Flywheel Publishing has partnered with CardRatings for our coverage of credit card products. Flywheel Publishing and CardRatings may receive a commission from card issuers.
Thank you for reading! Have some feedback for us?
Contact the 24/7 Wall St. editorial team.
 24/7 Wall St.
 24/7 Wall St.
 24/7 Wall St.
 24/7 Wall St.
 24/7 Wall St.