
Marriage as an institution has proved to be surprisingly durable. Even after decades of social change, including the sexual revolution, advances for women in many fields, and the destigmatization of single parenthood, many people still want to get married, and they want their marriages to last “till death do us part.” (Here is the cost of getting married in America’s largest cities.)
Unfortunately, marriages aren’t always as durable as the institution itself, and many end in divorce. 24/7 Tempo has ranked all 50 states and the District of Columbia according to the average duration of their marriages. Of course the rankings aren’t just influenced by death and divorce rates. Other factors include median age at marriage, which differs for men and women, and age demographics.
The numbers can vary significantly. For example, the median age at first marriage for men in Connecticut is 32.1 years; in Wyoming it’s only 26.5. For women, the median age at first marriage for women in Rhode Island is 30.5; in Utah it’s only 24.8. (This is the city where most people get divorced in each state.)
Click here to see the states where couples have been married the longest.
Because of all the variables, the median duration of current marriages also varies dramatically, from a high of 22.5 years in West Virginia to a low of 11.1 in the District of Columbia – less than half as long. Generally, marriages seem to last longer in the North and Northeast, and not as long in the South and Southwest. Different social mores may account for some of the variations. It’s also noteworthy that in many cases, states with a higher percentage of older residents also have longer-lasting marriages.
To identify the states where people stay married the longest, 24/7 Tempo reviewed the median duration of current marriages in every state and Washington D.C. from the U.S. Census Bureau’s 2019 American Community Survey.
Data on median age at first marriage for males and females, the percentage of state residents 15 and older who are widowed, and the percentages of each population between the ages of 25-35, 18-62, and 65 or more, were also obtained from the ACS.

51. District of Columbia
> Median duration of current marriage (2019): 11.1 years
> Median age at first marriage (male): 30.7 — 12th oldest
> Median age at first marriage (female): 30.1 — 2nd oldest
> Widowed, as of 2019: 3.3% — the youngest
> 25-35 pop: 23.3% (164,375 total) — the oldest
> 18-62 pop: 66.7% (471,042 total) — the oldest
> 65 and over pop: 12.4% (87,537 total) — 3rd youngest
[in-text-ad]

50. Alaska
> Median duration of current marriage (2019): 15.8 years
> Median age at first marriage (male): 29.4 — 18th youngest
> Median age at first marriage (female): 27.8 — 22nd youngest
> Widowed, as of 2019: 4.4% — 4th youngest
> 25-35 pop: 16.1% (117,978 total) — 2nd oldest
> 18-62 pop: 59.3% (433,753 total) — 5th oldest
> 65 and over pop: 12.4% (90,588 total) — 2nd youngest

49. Nevada
> Median duration of current marriage (2019): 17.4 years
> Median age at first marriage (male): 30.1 — 20th oldest
> Median age at first marriage (female): 28.3 — 22nd oldest
> Widowed, as of 2019: 5.4% — 13th youngest
> 25-35 pop: 14.6% (449,055 total) — 10th oldest
> 18-62 pop: 57.8% (1,781,371 total) — 15th oldest
> 65 and over pop: 16.2% (498,219 total) — 18th youngest

48. Colorado
> Median duration of current marriage (2019): 17.6 years
> Median age at first marriage (male): 30.0 — 23rd oldest
> Median age at first marriage (female): 27.8 — 22nd youngest
> Widowed, as of 2019: 4.2% — 3rd youngest
> 25-35 pop: 15.8% (907,627 total) — 3rd oldest
> 18-62 pop: 59.9% (3,449,300 total) — 2nd oldest
> 65 and over pop: 14.7% (845,378 total) — 6th youngest
[in-text-ad-2]

47. Utah
> Median duration of current marriage (2019): 17.7 years
> Median age at first marriage (male): 26.7 — 2nd youngest
> Median age at first marriage (female): 24.8 — the youngest
> Widowed, as of 2019: 3.6% — 2nd youngest
> 25-35 pop: 14.7% (472,153 total) — 8th oldest
> 18-62 pop: 56.8% (1,820,385 total) — 24th oldest
> 65 and over pop: 11.4% (365,198 total) — the youngest

46. Texas
> Median duration of current marriage (2019): 18.0 years
> Median age at first marriage (male): 29.5 — 19th youngest
> Median age at first marriage (female): 27.3 — 18th youngest
> Widowed, as of 2019: 5.0% — 8th youngest
> 25-35 pop: 14.6% (4,242,661 total) — 9th oldest
> 18-62 pop: 58.4% (16,930,981 total) — 11th oldest
> 65 and over pop: 12.9% (3,738,727 total) — 4th youngest
[in-text-ad]

45. Washington
> Median duration of current marriage (2019): 18.2 years
> Median age at first marriage (male): 30.1 — 20th oldest
> Median age at first marriage (female): 27.5 — 19th youngest
> Widowed, as of 2019: 4.9% — 5th youngest
> 25-35 pop: 15.3% (1,164,010 total) — 5th oldest
> 18-62 pop: 58.6% (4,459,749 total) — 9th oldest
> 65 and over pop: 15.9% (1,207,685 total) — 9th youngest

44. Georgia
> Median duration of current marriage (2019): 18.4 years
> Median age at first marriage (male): 30.0 — 23rd oldest
> Median age at first marriage (female): 28.1 — 24th oldest
> Widowed, as of 2019: 5.4% — 15th youngest
> 25-35 pop: 13.7% (1,458,596 total) — 19th oldest
> 18-62 pop: 58.7% (6,231,500 total) — 7th oldest
> 65 and over pop: 14.3% (1,523,192 total) — 5th youngest

43. Oklahoma
> Median duration of current marriage (2019): 18.6 years
> Median age at first marriage (male): 27.6 — 4th youngest
> Median age at first marriage (female): 25.9 — 5th youngest
> Widowed, as of 2019: 6.5% — 9th oldest
> 25-35 pop: 13.6% (536,999 total) — 23rd oldest
> 18-62 pop: 56.2% (2,224,608 total) — 16th youngest
> 65 and over pop: 16.1% (635,222 total) — 13th youngest
[in-text-ad-2]

42. Hawaii
> Median duration of current marriage (2019): 18.8 years
> Median age at first marriage (male): 30.2 — 19th oldest
> Median age at first marriage (female): 29.0 — 13th oldest
> Widowed, as of 2019: 6.1% — 17th oldest
> 25-35 pop: 13.8% (195,781 total) — 15th oldest
> 18-62 pop: 55.7% (789,306 total) — 13th youngest
> 65 and over pop: 19.0% (269,470 total) — 7th oldest

41. Wyoming
> Median duration of current marriage (2019): 19.0 years
> Median age at first marriage (male): 26.5 — the youngest
> Median age at first marriage (female): 25.4 — 2nd youngest
> Widowed, as of 2019: 5.2% — 11th youngest
> 25-35 pop: 13.2% (76,649 total) — 23rd youngest
> 18-62 pop: 55.6% (321,715 total) — 10th youngest
> 65 and over pop: 17.1% (98,789 total) — 24th oldest
[in-text-ad]

40. California
> Median duration of current marriage (2019): 19.1 years
> Median age at first marriage (male): 31.1 — 9th oldest
> Median age at first marriage (female): 29.4 — 8th oldest
> Widowed, as of 2019: 4.9% — 6th youngest
> 25-35 pop: 15.3% (6,036,052 total) — 6th oldest
> 18-62 pop: 59.3% (23,450,052 total) — 4th oldest
> 65 and over pop: 14.8% (5,834,998 total) — 7th youngest
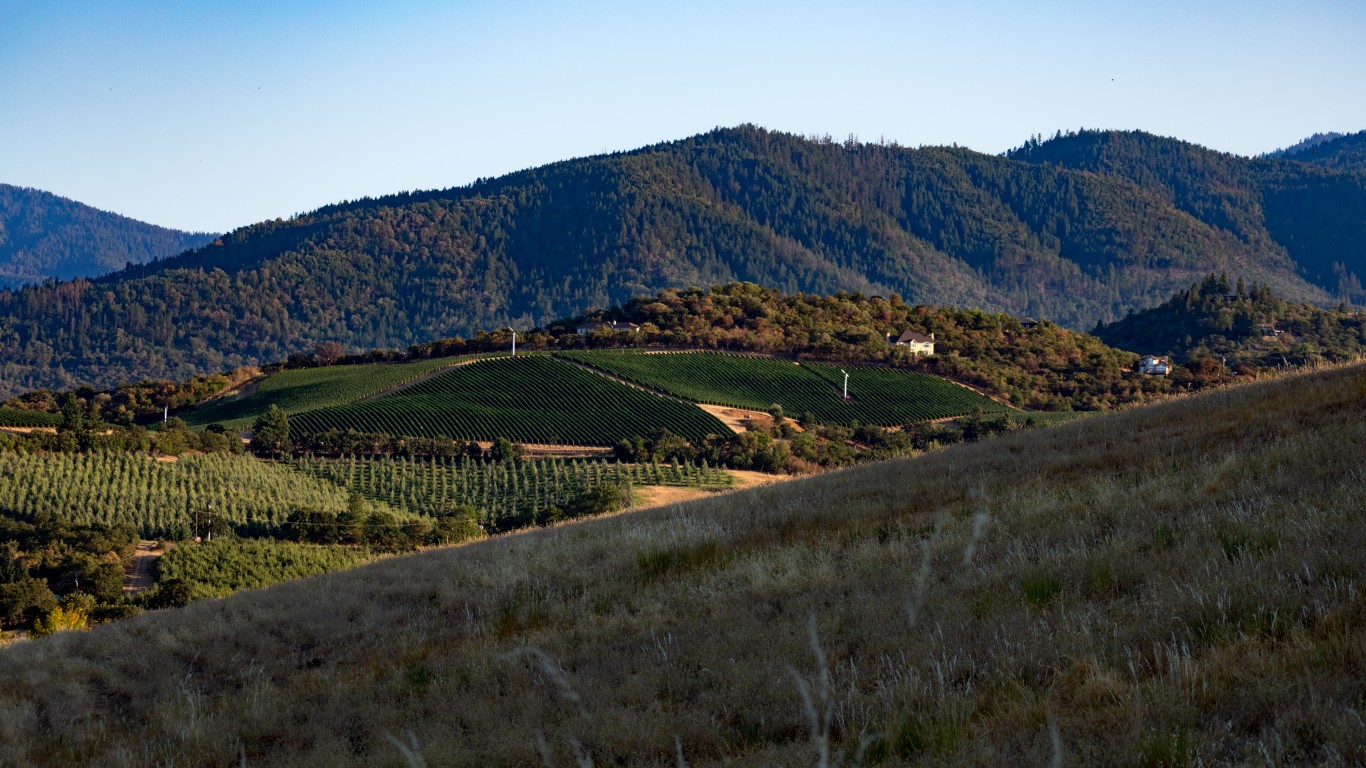
39. Oregon
> Median duration of current marriage (2019): 19.2 years
> Median age at first marriage (male): 30.6 — 14th oldest
> Median age at first marriage (female): 28.6 — 18th oldest
> Widowed, as of 2019: 5.1% — 10th youngest
> 25-35 pop: 14.1% (594,585 total) — 12th oldest
> 18-62 pop: 57.4% (2,421,388 total) — 21st oldest
> 65 and over pop: 18.2% (767,496 total) — 10th oldest

38. Arkansas
> Median duration of current marriage (2019): 19.3 years
> Median age at first marriage (male): 27.0 — 3rd youngest
> Median age at first marriage (female): 25.8 — 4th youngest
> Widowed, as of 2019: 7.4% — 2nd oldest
> 25-35 pop: 12.8% (386,602 total) — 10th youngest
> 18-62 pop: 55.8% (1,682,789 total) — 14th youngest
> 65 and over pop: 17.4% (524,237 total) — 22nd oldest
[in-text-ad-2]

37. Tennessee
> Median duration of current marriage (2019): 19.5 years
> Median age at first marriage (male): 28.6 — 13th youngest
> Median age at first marriage (female): 27.1 — 15th youngest
> Widowed, as of 2019: 6.3% — 13th oldest
> 25-35 pop: 13.7% (934,878 total) — 20th oldest
> 18-62 pop: 57.5% (3,925,363 total) — 20th oldest
> 65 and over pop: 16.7% (1,138,965 total) — 23rd youngest

36. Virginia
> Median duration of current marriage (2019): 19.6 years (tied)
> Median age at first marriage (male): 30.0 — 23rd oldest
> Median age at first marriage (female): 28.4 — 19th oldest
> Widowed, as of 2019: 5.6% — 21st youngest
> 25-35 pop: 13.8% (1,174,655 total) — 17th oldest
> 18-62 pop: 58.6% (5,002,993 total) — 8th oldest
> 65 and over pop: 15.9% (1,358,336 total) — 11th youngest
[in-text-ad]

35. Mississippi
> Median duration of current marriage (2019): 19.6 years (tied)
> Median age at first marriage (male): 28.1 — 8th youngest
> Median age at first marriage (female): 26.6 — 10th youngest
> Widowed, as of 2019: 6.9% — 3rd oldest
> 25-35 pop: 12.4% (368,227 total) — 4th youngest
> 18-62 pop: 56.3% (1,676,716 total) — 18th youngest
> 65 and over pop: 16.4% (486,804 total) — 20th youngest

34. Maryland
> Median duration of current marriage (2019): 19.6 years (tied)
> Median age at first marriage (male): 31.0 — 10th oldest
> Median age at first marriage (female): 29.4 — 8th oldest
> Widowed, as of 2019: 5.6% — 20th youngest
> 25-35 pop: 13.6% (820,575 total) — 22nd oldest
> 18-62 pop: 58.2% (3,517,784 total) — 12th oldest
> 65 and over pop: 15.9% (959,887 total) — 10th youngest

33. Louisiana
> Median duration of current marriage (2019): 19.6 years(tied)
> Median age at first marriage (male): 30.4 — 18th oldest
> Median age at first marriage (female): 28.1 — 24th oldest
> Widowed, as of 2019: 6.6% — 7th oldest
> 25-35 pop: 13.8% (643,422 total) — 14th oldest
> 18-62 pop: 56.7% (2,635,228 total) — 25th youngest
> 65 and over pop: 16.0% (742,194 total) — 12th youngest
[in-text-ad-2]

32. Idaho
> Median duration of current marriage (2019): 19.7 years
> Median age at first marriage (male): 27.9 — 5th youngest
> Median age at first marriage (female): 25.5 — 3rd youngest
> Widowed, as of 2019: 5.0% — 9th youngest
> 25-35 pop: 13.1% (234,800 total) — 19th youngest
> 18-62 pop: 54.9% (981,628 total) — 3rd youngest
> 65 and over pop: 16.2% (288,617 total) — 17th youngest

31. North Dakota
> Median duration of current marriage (2019): 19.8 years
> Median age at first marriage (male): 28.6 — 13th youngest
> Median age at first marriage (female): 26.0 — 6th youngest
> Widowed, as of 2019: 5.8% — 25th oldest
> 25-35 pop: 15.4% (117,574 total) — 4th oldest
> 18-62 pop: 57.6% (439,254 total) — 18th oldest
> 65 and over pop: 15.8% (120,177 total) — 8th youngest
[in-text-ad]

30. North Carolina
> Median duration of current marriage (2019): 19.9 years
> Median age at first marriage (male): 30.0 — 23rd oldest
> Median age at first marriage (female): 27.9 — 23rd youngest
> Widowed, as of 2019: 5.9% — 24th oldest
> 25-35 pop: 13.4% (1,401,663 total) — 25th oldest
> 18-62 pop: 57.8% (6,062,704 total) — 17th oldest
> 65 and over pop: 16.7% (1,750,935 total) — 24th youngest

29. Kansas
> Median duration of current marriage (2019): 20.0 years
> Median age at first marriage (male): 28.5 — 9th youngest
> Median age at first marriage (female): 26.2 — 7th youngest
> Widowed, as of 2019: 6.0% — 18th oldest
> 25-35 pop: 13.0% (377,373 total) — 15th youngest
> 18-62 pop: 55.7% (1,621,620 total) — 11th youngest
> 65 and over pop: 16.4% (477,996 total) — 21st youngest

28. Nebraska
> Median duration of current marriage (2019): 20.1 years (tied)
> Median age at first marriage (male): 28.0 — 6th youngest
> Median age at first marriage (female): 26.6 — 10th youngest
> Widowed, as of 2019: 5.4% — 14th youngest
> 25-35 pop: 13.3% (257,931 total) — 26th youngest
> 18-62 pop: 55.5% (1,074,473 total) — 9th youngest
> 65 and over pop: 16.1% (312,295 total) — 16th youngest
[in-text-ad-2]

27. Missouri
> Median duration of current marriage (2019): 20.1 years (tied)
> Median age at first marriage (male): 29.0 — 16th youngest
> Median age at first marriage (female): 27.2 — 17th youngest
> Widowed, as of 2019: 6.3% — 14th oldest
> 25-35 pop: 13.4% (823,722 total) — 24th oldest
> 18-62 pop: 56.4% (3,461,169 total) — 20th youngest
> 65 and over pop: 17.2% (1,057,943 total) — 23rd oldest

26. Arizona
> Median duration of current marriage (2019): 20.1 years (tied)
> Median age at first marriage (male): 30.6 — 14th oldest
> Median age at first marriage (female): 28.4 — 19th oldest
> Widowed, as of 2019: 5.4% — 12th youngest
> 25-35 pop: 13.8% (1,001,594 total) — 18th oldest
> 18-62 pop: 56.0% (4,074,092 total) — 15th youngest
> 65 and over pop: 18.0% (1,307,241 total) — 13th oldest
[in-text-ad]

25. New York
> Median duration of current marriage (2019): 20.2 years (tied)
> Median age at first marriage (male): 31.5 — 4th oldest
> Median age at first marriage (female): 29.9 — 5th oldest
> Widowed, as of 2019: 5.8% — 26th youngest
> 25-35 pop: 14.7% (2,865,401 total) — 7th oldest
> 18-62 pop: 58.5% (11,386,875 total) — 10th oldest
> 65 and over pop: 16.9% (3,295,968 total) — 26th youngest
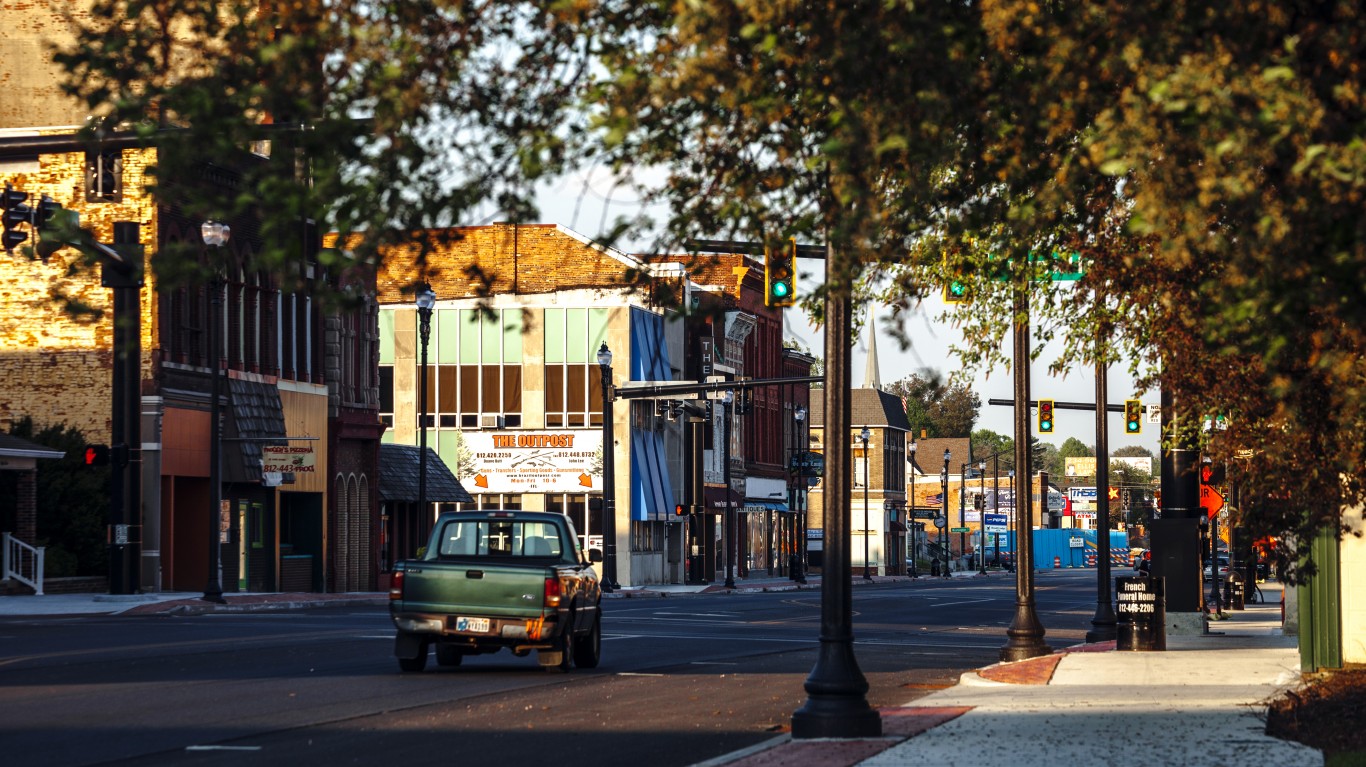
24. Indiana
> Median duration of current marriage (2019): 20.2 years (tied)
> Median age at first marriage (male): 29.7 — 21st youngest
> Median age at first marriage (female): 27.2 — 17th youngest
> Widowed, as of 2019: 5.9% — 20th oldest
> 25-35 pop: 13.2% (886,319 total) — 20th youngest
> 18-62 pop: 56.8% (3,826,306 total) — 23rd oldest
> 65 and over pop: 16.1% (1,084,472 total) — 14th youngest

23. New Mexico
> Median duration of current marriage (2019): 20.3 years (tied)
> Median age at first marriage (male): 31.4 — 6th oldest
> Median age at first marriage (female): 28.8 — 14th oldest
> Widowed, as of 2019: 6.4% — 12th oldest
> 25-35 pop: 13.3% (278,627 total) — 24th youngest
> 18-62 pop: 55.3% (1,159,675 total) — 6th youngest
> 65 and over pop: 18.0% (377,730 total) — 12th oldest
[in-text-ad-2]

22. Kentucky
> Median duration of current marriage (2019): 20.3 years (tied)
> Median age at first marriage (male): 28.6 — 13th youngest
> Median age at first marriage (female): 26.7 — 11th youngest
> Widowed, as of 2019: 6.7% — 6th oldest
> 25-35 pop: 12.9% (576,692 total) — 12th youngest
> 18-62 pop: 56.8% (2,535,533 total) — 25th oldest
> 65 and over pop: 16.9% (754,559 total) — 25th youngest

21. Alabama
> Median duration of current marriage (2019): 20.5 years
> Median age at first marriage (male): 28.8 — 15th youngest
> Median age at first marriage (female): 27.0 — 13th youngest
> Widowed, as of 2019: 6.8% — 5th oldest
> 25-35 pop: 13.0% (637,403 total) — 16th youngest
> 18-62 pop: 56.5% (2,770,031 total) — 21st youngest
> 65 and over pop: 17.4% (854,312 total) — 20th oldest
[in-text-ad]

20. Massachusetts
> Median duration of current marriage (2019): 20.6 years (tied)
> Median age at first marriage (male): 31.4 — 6th oldest
> Median age at first marriage (female): 30.1 — 2nd oldest
> Widowed, as of 2019: 5.5% — 16th youngest
> 25-35 pop: 14.4% (992,607 total) — 11th oldest
> 18-62 pop: 59.4% (4,093,670 total) — 3rd oldest
> 65 and over pop: 17.0% (1,172,293 total) — 25th oldest

19. Florida
> Median duration of current marriage (2019): 20.6 years (tied)
> Median age at first marriage (male): 31.5 — 4th oldest
> Median age at first marriage (female): 29.1 — 11th oldest
> Widowed, as of 2019: 6.8% — 4th oldest
> 25-35 pop: 12.9% (2,768,060 total) — 11th youngest
> 18-62 pop: 55.4% (11,904,688 total) — 7th youngest
> 65 and over pop: 20.9% (4,498,198 total) — 2nd oldest

18. New Jersey
> Median duration of current marriage (2019): 20.7 years
> Median age at first marriage (male): 31.0 — 10th oldest
> Median age at first marriage (female): 29.5 — 7th oldest
> Widowed, as of 2019: 5.7% — 24th youngest
> 25-35 pop: 12.9% (1,148,458 total) — 13th youngest
> 18-62 pop: 57.6% (5,116,317 total) — 19th oldest
> 65 and over pop: 16.6% (1,475,075 total) — 22nd youngest
[in-text-ad-2]

17. South Carolina
> Median duration of current marriage (2019): 20.8 years
> Median age at first marriage (male): 29.7 — 21st youngest
> Median age at first marriage (female): 28.8 — 14th oldest
> Widowed, as of 2019: 6.5% — 10th oldest
> 25-35 pop: 13.0% (670,757 total) — 17th youngest
> 18-62 pop: 56.3% (2,898,734 total) — 17th youngest
> 65 and over pop: 18.2% (935,538 total) — 11th oldest

16. Illinois
> Median duration of current marriage (2019): 20.9 years (tied)
> Median age at first marriage (male): 30.6 — 14th oldest
> Median age at first marriage (female): 29.2 — 10th oldest
> Widowed, as of 2019: 5.7% — 22nd youngest
> 25-35 pop: 13.8% (1,748,323 total) — 16th oldest
> 18-62 pop: 57.9% (7,336,845 total) — 14th oldest
> 65 and over pop: 16.1% (2,045,361 total) — 15th youngest
[in-text-ad]

15. Delaware
> Median duration of current marriage (2019): 20.9 years (tied)
> Median age at first marriage (male): 31.4 — 6th oldest
> Median age at first marriage (female): 29.7 — 6th oldest
> Widowed, as of 2019: 5.9% — 22nd oldest
> 25-35 pop: 13.2% (128,412 total) — 21st youngest
> 18-62 pop: 55.1% (536,581 total) — 4th youngest
> 65 and over pop: 19.5% (189,638 total) — 5th oldest

14. Minnesota
> Median duration of current marriage (2019): 21.1 years
> Median age at first marriage (male): 29.8 — 23rd youngest
> Median age at first marriage (female): 28.1 — 24th oldest
> Widowed, as of 2019: 5.0% — 7th youngest
> 25-35 pop: 13.6% (765,578 total) — 21st oldest
> 18-62 pop: 56.8% (3,200,597 total) — 26th youngest
> 65 and over pop: 16.3% (921,491 total) — 19th youngest

13. South Dakota
> Median duration of current marriage (2019): 21.3 years (tied)
> Median age at first marriage (male): 28.1 — 8th youngest
> Median age at first marriage (female): 25.5 — 3rd youngest
> Widowed, as of 2019: 5.9% — 21st oldest
> 25-35 pop: 12.9% (114,420 total) — 14th youngest
> 18-62 pop: 54.3% (480,042 total) — the youngest
> 65 and over pop: 17.4% (153,799 total) — 21st oldest
[in-text-ad-2]

12. Ohio
> Median duration of current marriage (2019): 21.3 years (tied)
> Median age at first marriage (male): 30.0 — 23rd oldest
> Median age at first marriage (female): 28.2 — 23rd oldest
> Widowed, as of 2019: 6.3% — 15th oldest
> 25-35 pop: 13.2% (1,544,717 total) — 22nd youngest
> 18-62 pop: 56.4% (6,588,505 total) — 19th youngest
> 65 and over pop: 17.5% (2,043,548 total) — 19th oldest

11. Iowa
> Median duration of current marriage (2019): 21.4 years
> Median age at first marriage (male): 28.8 — 15th youngest
> Median age at first marriage (female): 26.8 — 12th youngest
> Widowed, as of 2019: 5.9% — 23rd oldest
> 25-35 pop: 12.7% (400,299 total) — 9th youngest
> 18-62 pop: 55.7% (1,758,470 total) — 12th youngest
> 65 and over pop: 17.5% (553,575 total) — 17th oldest
[in-text-ad]

10. Vermont
> Median duration of current marriage (2019): 21.6 years (tied)
> Median age at first marriage (male): 31.9 — 2nd oldest
> Median age at first marriage (female): 28.1 — 24th oldest
> Widowed, as of 2019: 5.8% — 25th youngest
> 25-35 pop: 12.3% (76,649 total) — 3rd youngest
> 18-62 pop: 56.9% (355,075 total) — 22nd oldest
> 65 and over pop: 20.1% (125,201 total) — 4th oldest

9. New Hampshire
> Median duration of current marriage (2019): 21.6 years (tied)
> Median age at first marriage (male): 30.1 — 20th oldest
> Median age at first marriage (female): 29.1 — 11th oldest
> Widowed, as of 2019: 5.6% — 19th youngest
> 25-35 pop: 12.6% (170,730 total) — 7th youngest
> 18-62 pop: 58.1% (790,291 total) — 13th oldest
> 65 and over pop: 18.6% (253,147 total) — 9th oldest

8. Montana
> Median duration of current marriage (2019): 21.6 years (tied)
> Median age at first marriage (male): 29.4 — 18th youngest
> Median age at first marriage (female): 27.1 — 15th youngest
> Widowed, as of 2019: 5.7% — 23rd youngest
> 25-35 pop: 12.5% (133,119 total) — 5th youngest
> 18-62 pop: 55.1% (588,944 total) — 5th youngest
> 65 and over pop: 19.5% (207,909 total) — 6th oldest
[in-text-ad-2]

7. Michigan
> Median duration of current marriage (2019): 21.6 years (tied)
> Median age at first marriage (male): 30.5 — 17th oldest
> Median age at first marriage (female): 28.4 — 19th oldest
> Widowed, as of 2019: 6.1% — 16th oldest
> 25-35 pop: 13.0% (1,302,017 total) — 18th youngest
> 18-62 pop: 56.7% (5,660,661 total) — 24th youngest
> 65 and over pop: 17.7% (1,766,409 total) — 14th oldest

6. Connecticut
> Median duration of current marriage (2019): 21.9 years
> Median age at first marriage (male): 32.1 — the oldest
> Median age at first marriage (female): 30.0 — 4th oldest
> Widowed, as of 2019: 5.5% — 17th youngest
> 25-35 pop: 12.5% (444,509 total) — 6th youngest
> 18-62 pop: 57.8% (2,061,066 total) — 16th oldest
> 65 and over pop: 17.6% (629,032 total) — 16th oldest
[in-text-ad]

5. Maine
> Median duration of current marriage (2019): 22.0 years
> Median age at first marriage (male): 29.8 — 23rd youngest
> Median age at first marriage (female): 28.7 — 17th oldest
> Widowed, as of 2019: 6.5% — 11th oldest
> 25-35 pop: 12.2% (164,231 total) — 2nd youngest
> 18-62 pop: 55.5% (745,687 total) — 8th youngest
> 65 and over pop: 21.3% (285,978 total) — the oldest

4. Wisconsin
> Median duration of current marriage (2019): 22.1 years (tied)
> Median age at first marriage (male): 29.9 — 24th youngest
> Median age at first marriage (female): 27.6 — 20th youngest
> Widowed, as of 2019: 5.5% — 18th youngest
> 25-35 pop: 12.7% (737,315 total) — 8th youngest
> 18-62 pop: 56.6% (3,295,493 total) — 23rd youngest
> 65 and over pop: 17.5% (1,019,896 total) — 18th oldest

3. Rhode Island
> Median duration of current marriage (2019): 22.1 years (tied)
> Median age at first marriage (male): 31.8 — 3rd oldest
> Median age at first marriage (female): 30.5 — the oldest
> Widowed, as of 2019: 5.9% — 19th oldest
> 25-35 pop: 14.0% (148,180 total) — 13th oldest
> 18-62 pop: 58.8% (622,632 total) — 6th oldest
> 65 and over pop: 17.7% (187,155 total) — 15th oldest
[in-text-ad-2]

2. Pennsylvania
> Median duration of current marriage (2019): 22.1 years (tied)
> Median age at first marriage (male): 30.7 — 12th oldest
> Median age at first marriage (female): 28.8 — 14th oldest
> Widowed, as of 2019: 6.5% — 8th oldest
> 25-35 pop: 13.3% (1,704,848 total) — 25th youngest
> 18-62 pop: 56.6% (7,239,894 total) — 22nd youngest
> 65 and over pop: 18.7% (2,388,218 total) — 8th oldest

1. West Virginia
> Median duration of current marriage (2019): 22.5 years
> Median age at first marriage (male): 28.6 — 13th youngest
> Median age at first marriage (female): 26.3 — 8th youngest
> Widowed, as of 2019: 7.9% — the oldest
> 25-35 pop: 11.8% (211,267 total) — the youngest
> 18-62 pop: 54.8% (982,503 total) — 2nd youngest
> 65 and over pop: 20.5% (367,400 total) — 3rd oldest
Thank you for reading! Have some feedback for us?
Contact the 24/7 Wall St. editorial team.
 24/7 Wall St.
 24/7 Wall St.
 24/7 Wall St.
 24/7 Wall St.
 24/7 Wall St.
