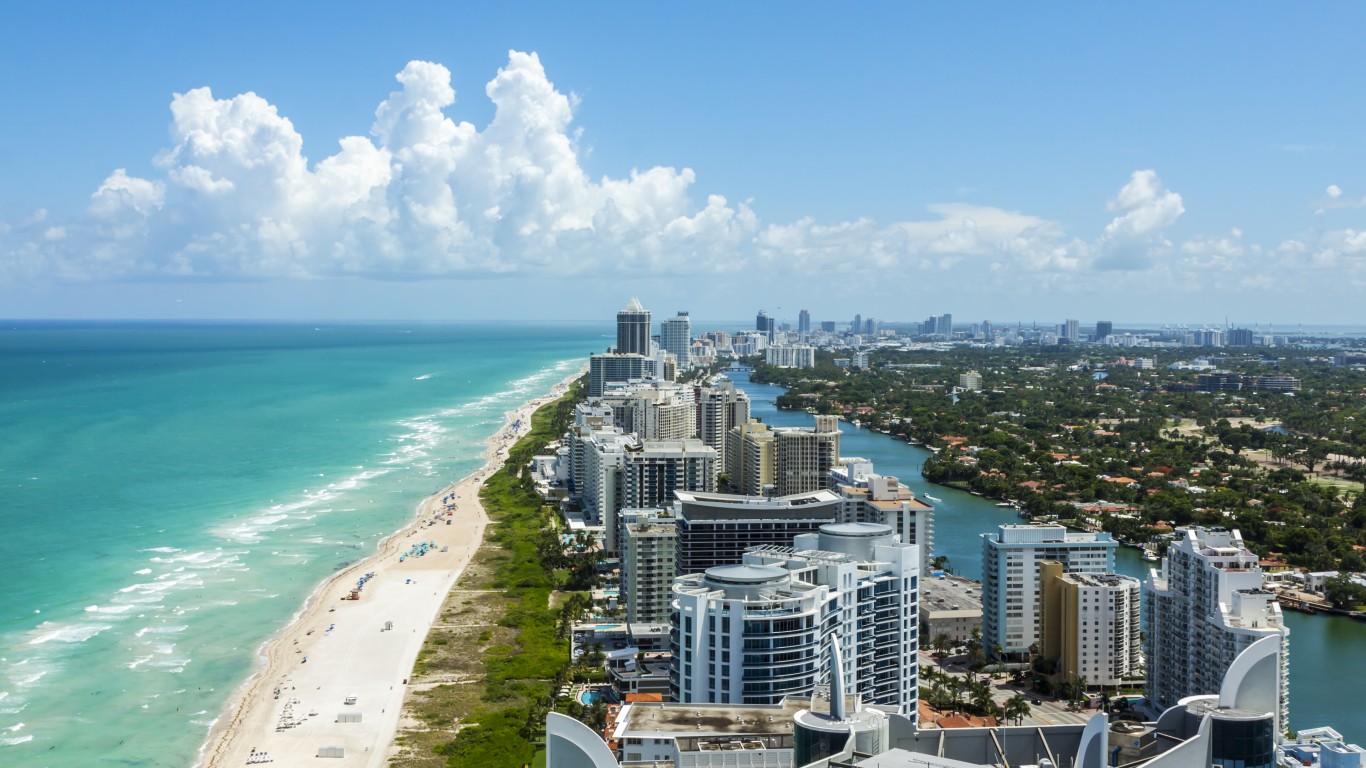
Everyone has different weather preferences. Some like a warm summer breeze, others thrive in the hot summer, while others yet enjoy the crisp air of fall. But nearly everyone can agree that days in blistering triple-digits or in below freezing temperatures are not ideal.
While most Americans have to contend with either a sweltering summer or a brutally cold winter, there are a handful of major metro areas where residents enjoy warm and pleasant weather with clear skies most days.
To determine the cities with the best weather, 24/7 Wall St. used data from the National Oceanic and Atmospheric Administration to create an index based on minimum, maximum, and average temperature, precipitation, cloud cover, wind, humidity, and more.
The 25 cities with the best weather are concentrated in just five states — Florida, California, Georgia, Hawaii, and Texas. These states all have significant coastlines. The ocean releases heat relatively slowly compared to land, so coastal areas tend to stay warmer in the summer.
This pleasant weather can be a huge driving factor influencing people to move — whether it is retirees spending their golden years in the sun or younger working adults who want to avoid snow. These are the cities Americans are flocking to.
Click here to see the cities with the best weather
Click here to read our detailed methodology

25. Fresno, California
> Avg. annual temperature: 64.3 °F
> Avg. days of rain per year: 45 days
> Avg. days below freezing per year: 20 days
> Avg. sunny days per year: 194 days
[in-text-ad]

24. Bakersfield, California
> Avg. annual temperature: 65.2 °F
> Avg. days of rain per year: 37 days
> Avg. days below freezing per year: 13 days
> Avg. sunny days per year: 191 days

23. Athens, Georgia
> Avg. annual temperature: 62.5 °F
> Avg. days of rain per year: 111 days
> Avg. days below freezing per year: 51 days
> Avg. sunny days per year: 113 days

22. Atlanta, Georgia
> Avg. annual temperature: 62.5 °F
> Avg. days of rain per year: 115 days
> Avg. days below freezing per year: 44 days
> Avg. sunny days per year: 110 days
[in-text-ad-2]

21. Columbus, Georgia
> Avg. annual temperature: 65.6 °F
> Avg. days of rain per year: 109 days
> Avg. days below freezing per year: 37 days
> Avg. sunny days per year: 110 days

20. Santa Maria, California
> Avg. annual temperature: 57.5 °F
> Avg. days of rain per year: 46 days
> Avg. days below freezing per year: 15 days
> Avg. sunny days per year: 176 days
[in-text-ad]

19. Sacramento, California
> Avg. annual temperature: 61.0 °F
> Avg. days of rain per year: 57 days
> Avg. days below freezing per year: 18 days
> Avg. sunny days per year: 188 days

18. Pensacola, Florida
> Avg. annual temperature: 67.4 °F
> Avg. days of rain per year: 112 days
> Avg. days below freezing per year: 14 days
> Avg. sunny days per year: 105 days

17. Austin, Texas
> Avg. annual temperature: 69.3 °F
> Avg. days of rain per year: 84 days
> Avg. days below freezing per year: 17 days
> Avg. sunny days per year: 115 days
[in-text-ad-2]

16. Augusta, Georgia
> Avg. annual temperature: 65.2 °F
> Avg. days of rain per year: 108 days
> Avg. days below freezing per year: 52 days
> Avg. sunny days per year: 112 days

15. Savannah, Georgia
> Avg. annual temperature: 66.7 °F
> Avg. days of rain per year: 110 days
> Avg. days below freezing per year: 27 days
> Avg. sunny days per year: 104 days
[in-text-ad]

14. Jacksonville, Florida
> Avg. annual temperature: 68.5 °F
> Avg. days of rain per year: 114 days
> Avg. days below freezing per year: 15 days
> Avg. sunny days per year: 94 days

13. West Palm Beach, Florida
> Avg. annual temperature: 75.4 °F
> Avg. days of rain per year: 133 days
> Avg. days below freezing per year: 0 days
> Avg. sunny days per year: 75 days

12. Orlando, Florida
> Avg. annual temperature: 73.3 °F
> Avg. days of rain per year: 117 days
> Avg. days below freezing per year: 2 days
> Avg. sunny days per year: 89 days
[in-text-ad-2]
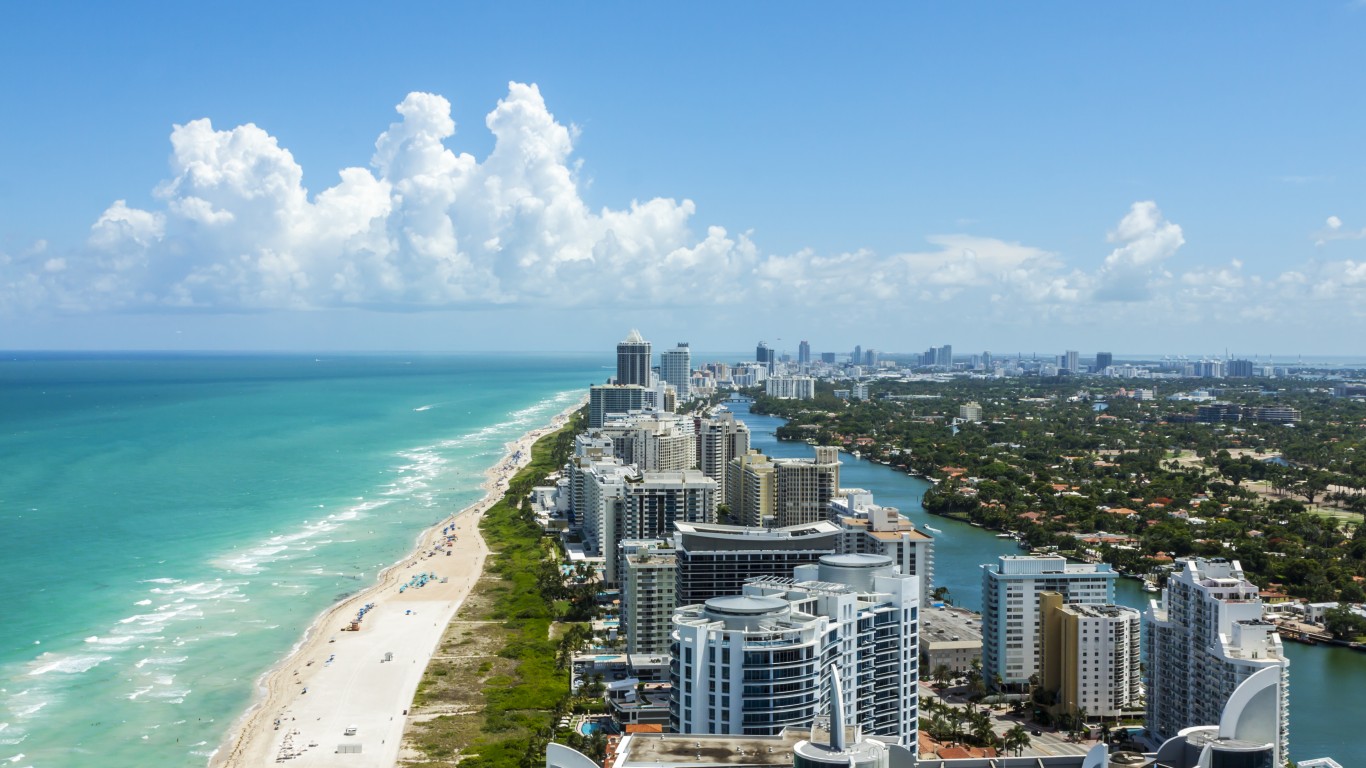
11. Miami, Florida
> Avg. annual temperature: 77.2 °F
> Avg. days of rain per year: 133 days
> Avg. days below freezing per year: 0 days
> Avg. sunny days per year: 74 days

10. Fort Myers, Florida
> Avg. annual temperature: 75.1 °F
> Avg. days of rain per year: 112 days
> Avg. days below freezing per year: 1 days
> Avg. sunny days per year: 98 days
[in-text-ad]
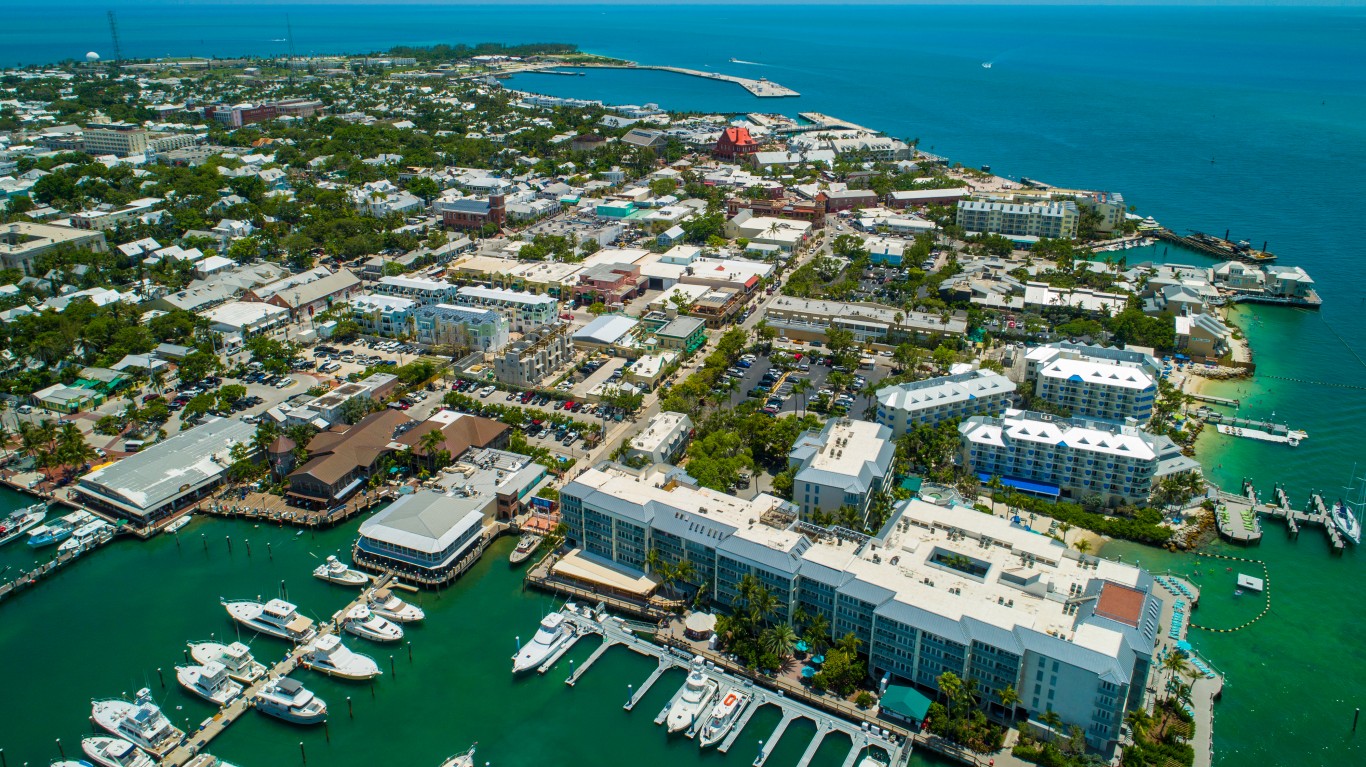
9. Key West, Florida
> Avg. annual temperature: 78.0 °F
> Avg. days of rain per year: 107 days
> Avg. days below freezing per year: 0 days
> Avg. sunny days per year: 104 days

8. Daytona Beach, Florida
> Avg. annual temperature: 70.8 °F
> Avg. days of rain per year: 116 days
> Avg. days below freezing per year: 5 days
> Avg. sunny days per year: 97 days

7. Tampa, Florida
> Avg. annual temperature: 73.4 °F
> Avg. days of rain per year: 107 days
> Avg. days below freezing per year: 2 days
> Avg. sunny days per year: 101 days
[in-text-ad-2]

6. Kahului, Hawaii
> Avg. annual temperature: 75.8 °F
> Avg. days of rain per year: 88 days
> Avg. days below freezing per year: 0 days
> Avg. sunny days per year: 131 days

5. Lihue, Hawaii
> Avg. annual temperature: 75.8 °F
> Avg. days of rain per year: 196 days
> Avg. days below freezing per year: 0 days
> Avg. sunny days per year: 56 days
[in-text-ad]
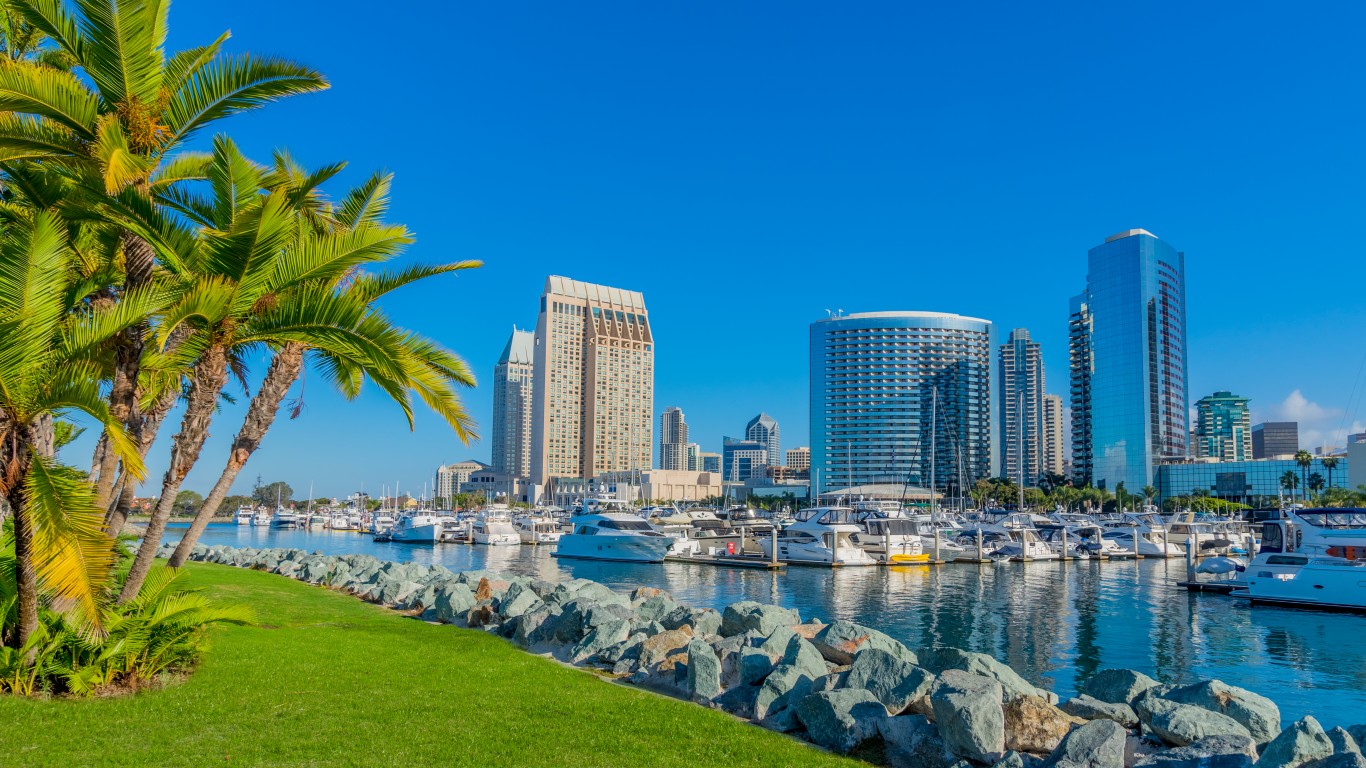
4. San Diego, California
> Avg. annual temperature: 63.6 °F
> Avg. days of rain per year: 41 days
> Avg. days below freezing per year: 0 days
> Avg. sunny days per year: 146 days

3. Long Beach, California
> Avg. annual temperature: 64.7 °F
> Avg. days of rain per year: 34 days
> Avg. days below freezing per year: 1 days
> Avg. sunny days per year: 159 days

2. Los Angeles, California
> Avg. annual temperature: 65.4 °F
> Avg. days of rain per year: 35 days
> Avg. days below freezing per year: 0 days
> Avg. sunny days per year: 186 days
[in-text-ad-2]

1. Honolulu, Hawaii
> Avg. annual temperature: 77.7 °F
> Avg. days of rain per year: 93 days
> Avg. days below freezing per year: 0 days
> Avg. sunny days per year: 90 days
Methodology
To determine the cities with the best weather, 24/7 Wall St. created an index based on minimum, maximum, and average temperature, precipitation, cloud cover, wind, humidity, and more. While many people would choose a warm climate over a freezing cold one, for many there are some climates that are just too hot. We rewarded places with fewer rainy days per year, as most people prefer a precipitation-free, sunny day over rain or snow. We also penalized places that get too little precipitation, however, as an arid climate can hurt vegetation and lead to wildfires and water restrictions. All values were indexed using min-max normalization to create a composite score for each city. All data was derived from the National Oceanic and Atmospheric Administration’s 2018 Comparative Climate Data and The 30-Year Climate Normals for 1980-2010, maintained by the Global Historical Climatology Network.
The exact measures included in the index are: the average number of days per year with a maximum temperature of 90°F or higher; the average number of days per year with a minimum temperature of 32°F or lower; the average number of days per year with 0.01 inches of precipitation or more; the average wind speed; the mean number of clear days per year; the mean number of cloudy days per year; the absolute difference in average year-round relative humidity in the afternoon from an ideal 40% humidity level; the absolute difference in normal daily maximum temperature from an ideal temperature of 72°F; the absolute difference in normal daily minimum temperature from 72°F; the absolute difference in normal daily mean temperature from 72°F; the annual number of normal temperature days (the number of degrees that the daily average temperature falls below 65° F); and the absolute difference in average annual precipitation from an ideal annual rainfall total of 40 inches. All values were weighted equally.
Are You Ahead, or Behind on Retirement? (sponsor)
If you’re one of the over 4 Million Americans set to retire this year, you may want to pay attention. Many people have worked their whole lives preparing to retire without ever knowing the answer to the most important question: are you ahead, or behind on your retirement goals?
Don’t make the same mistake. It’s an easy question to answer. A quick conversation with a financial advisor can help you unpack your savings, spending, and goals for your money. With SmartAsset’s free tool, you can connect with vetted financial advisors in minutes.
Why wait? Click here to get started today!
Thank you for reading! Have some feedback for us?
Contact the 24/7 Wall St. editorial team.
 24/7 Wall St.
 24/7 Wall St.