Burglary — defined as the unlawful entry of a structure, such as a home or business, to commit a theft or felony — is the most serious nonviolent offense tracked by the FBI. There were just over 1 million burglaries reported in the United States in 2020, the largest share of which were committed in residential properties, more often during the day than at night.
Burglaries are typically carried out for monetary gain, and each year, these crimes result in billions of dollars in stolen property. Not only do victims of burglaries typically suffer material loss, but they can also be impacted psychologically. Many burglary victims have reported heightened anxiety, difficulty sleeping, feelings of vulnerability, and even post-traumatic stress disorder in some cases.
While burglaries can happen anywhere in the United States, in some parts of the country, they are far more common than others.
Using data from the FBI’s 2020 Uniform Crime Report, 24/7 Wall St. identified the cities with the highest burglary rates. Cities are ranked by the number of burglaries reported for every 100,000 people.
In every city on this list, break-in rates are far higher than — and in some cases more than five times — the national rate of 314 burglaries per 100,000 people. The largest share of cities on this list are in the South, including five in Louisiana alone.
Burglary — along with larceny and vehicle theft — is one of three criminal offenses that make up the property crime category. Due in large part to higher than average burglary rates, in every city on this list, the overall property crime rate far exceeds the national rate of 1,958 incidents per 100,000 people. Here is a look at the city with the most property crimes in every state.
Click here to see the cities with the most break-ins
Click here to see our detailed methodology

50. Beaumont, Texas
> 2020 burglaries per 100K people: 817.9
> Total burglaries: 955 — 95th highest of 1,438 cities
> Property crimes per 100K people: 3,308.3 — 204th highest of 1,361 cities
> Total property crimes: 3,863 — 152nd highest of 1,361 cities
> Population: 118,151
[in-text-ad]
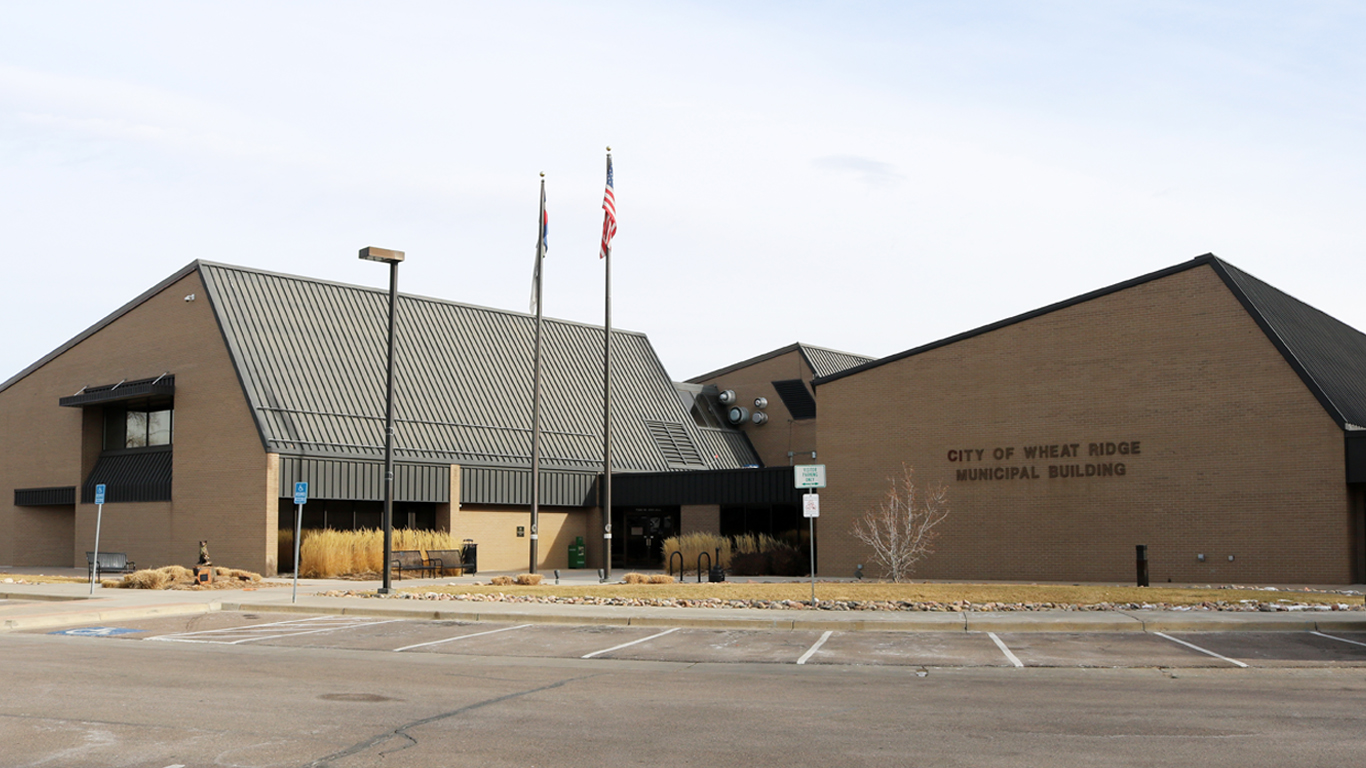
49. Wheat Ridge, Colorado
> 2020 burglaries per 100K people: 820.3
> Total burglaries: 258 — 401st highest of 1,438 cities (tied)
> Property crimes per 100K people: 5,322.6 — 23rd highest of 1,361 cities
> Total property crimes: 1,674 — 425th highest of 1,361 cities
> Population: 31,331

48. Springfield, Illinois
> 2020 burglaries per 100K people: 822.6
> Total burglaries: 937 — 97th highest of 1,438 cities
> Property crimes per 100K people: N/A
> Total property crimes: N/A
> Population: 115,888

47. Florence, South Carolina
> 2020 burglaries per 100K people: 834.3
> Total burglaries: 322 — 314th highest of 1,438 cities (tied)
> Property crimes per 100K people: 6,192.2 — 10th highest of 1,361 cities
> Total property crimes: 2,390 — 288th highest of 1,361 cities
> Population: 38,487
[in-text-ad-2]

46. Rapid City, South Dakota
> 2020 burglaries per 100K people: 837.0
> Total burglaries: 657 — 135th highest of 1,438 cities
> Property crimes per 100K people: 3,996.6 — 110th highest of 1,361 cities
> Total property crimes: 3,137 — 210th highest of 1,361 cities
> Population: 75,258

45. Lafayette, Louisiana
> 2020 burglaries per 100K people: 843.9
> Total burglaries: 1,069 — 86th highest of 1,438 cities
> Property crimes per 100K people: 4,519.3 — 67th highest of 1,361 cities
> Total property crimes: 5,725 — 97th highest of 1,361 cities
> Population: 126,666
[in-text-ad]

44. Lansing, Michigan
> 2020 burglaries per 100K people: 844.5
> Total burglaries: 1,002 — 93rd highest of 1,438 cities
> Property crimes per 100K people: 3,004.6 — 277th highest of 1,361 cities
> Total property crimes: 3,565 — 175th highest of 1,361 cities
> Population: 117,159

43. San Francisco, California
> 2020 burglaries per 100K people: 845.4
> Total burglaries: 7,452 — 8th highest of 1,438 cities
> Property crimes per 100K people: 4,394.4 — 73rd highest of 1,361 cities
> Total property crimes: 38,737 — 7th highest of 1,361 cities
> Population: 874,961

42. Huntington, West Virginia
> 2020 burglaries per 100K people: 845.9
> Total burglaries: 378 — 268th highest of 1,438 cities (tied)
> Property crimes per 100K people: 3,674.7 — 140th highest of 1,361 cities
> Total property crimes: 1,642 — 435th highest of 1,361 cities
> Population: 46,667
[in-text-ad-2]

41. Culver City, California
> 2020 burglaries per 100K people: 846.6
> Total burglaries: 332 — 305th highest of 1,438 cities (tied)
> Property crimes per 100K people: 4,079.8 — 97th highest of 1,361 cities
> Total property crimes: 1,600 — 448th highest of 1,361 cities (tied)
> Population: 39,169

40. St. Louis, Missouri
> 2020 burglaries per 100K people: 855.2
> Total burglaries: 2,552 — 36th highest of 1,438 cities
> Property crimes per 100K people: 5,830.3 — 15th highest of 1,361 cities
> Total property crimes: 17,399 — 32nd highest of 1,361 cities
> Population: 308,174
[in-text-ad]

39. Baton Rouge, Louisiana
> 2020 burglaries per 100K people: 865.7
> Total burglaries: 1,898 — 49th highest of 1,438 cities
> Property crimes per 100K people: 4,825.7 — 43rd highest of 1,361 cities
> Total property crimes: 10,580 — 56th highest of 1,361 cities
> Population: 224,149
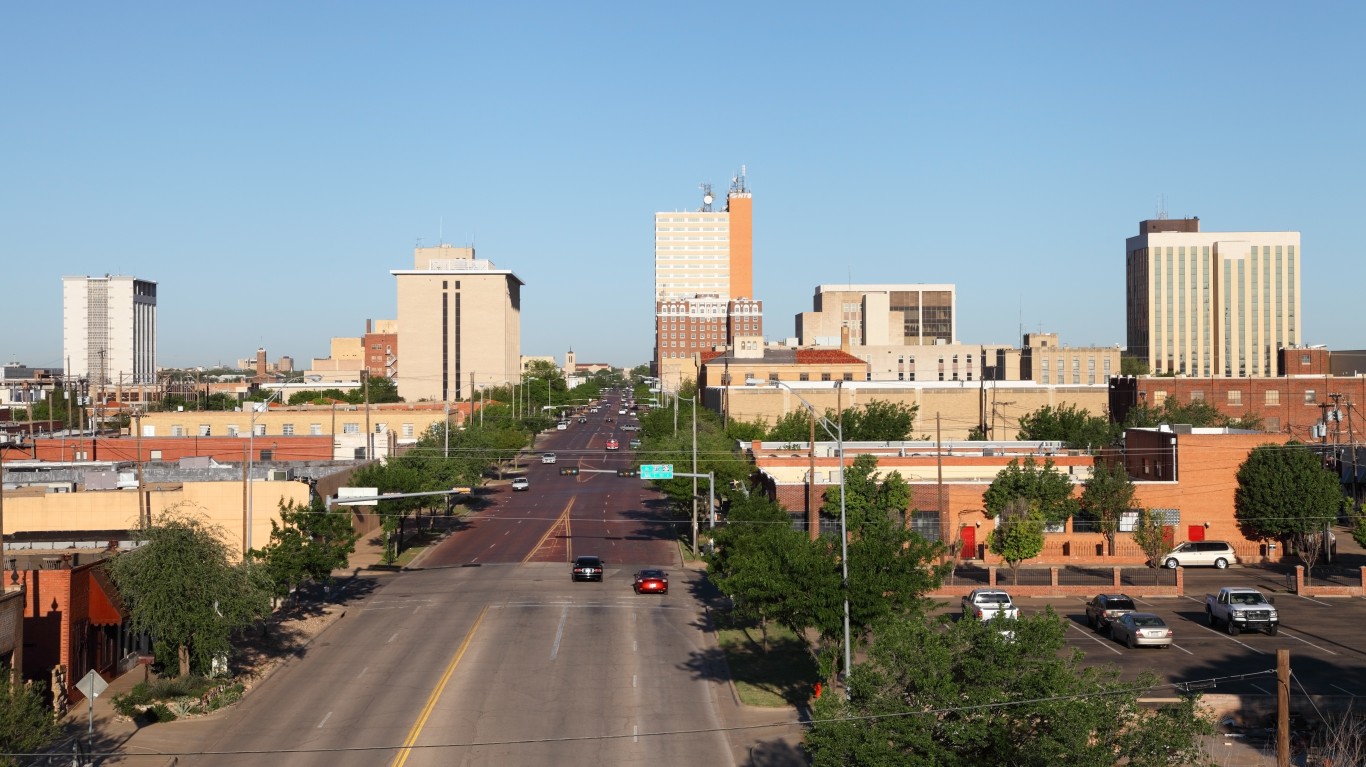
38. Lubbock, Texas
> 2020 burglaries per 100K people: 875.8
> Total burglaries: 2,296 — 39th highest of 1,438 cities
> Property crimes per 100K people: 4,108.4 — 95th highest of 1,361 cities
> Total property crimes: 10,770 — 53rd highest of 1,361 cities
> Population: 253,851

37. Burien, Washington
> 2020 burglaries per 100K people: 877.0
> Total burglaries: 455 — 213th highest of 1,438 cities
> Property crimes per 100K people: 4,207.9 — 86th highest of 1,361 cities
> Total property crimes: 2,183 — 318th highest of 1,361 cities
> Population: 51,477
[in-text-ad-2]

36. Raytown, Missouri
> 2020 burglaries per 100K people: 878.2
> Total burglaries: 254 — 406th highest of 1,438 cities
> Property crimes per 100K people: 4,052.3 — 102nd highest of 1,361 cities
> Total property crimes: 1,172 — 613th highest of 1,361 cities (tied)
> Population: 29,264

35. Oklahoma City, Oklahoma
> 2020 burglaries per 100K people: 881.3
> Total burglaries: 5,849 — 11th highest of 1,438 cities
> Property crimes per 100K people: 3,895.5 — 116th highest of 1,361 cities
> Total property crimes: 25,853 — 20th highest of 1,361 cities
> Population: 643,692
[in-text-ad]

34. Decatur, Illinois
> 2020 burglaries per 100K people: 884.9
> Total burglaries: 621 — 153rd highest of 1,438 cities
> Property crimes per 100K people: N/A
> Total property crimes: N/A
> Population: 72,359

33. Des Moines, Iowa
> 2020 burglaries per 100K people: 894.1
> Total burglaries: 1,925 — 47th highest of 1,438 cities
> Property crimes per 100K people: 3,901.7 — 115th highest of 1,361 cities
> Total property crimes: 8,400 — 68th highest of 1,361 cities
> Population: 215,636

32. Memphis, Tennessee
> 2020 burglaries per 100K people: 895.8
> Total burglaries: 5,831 — 12th highest of 1,438 cities
> Property crimes per 100K people: 5,560.8 — 20th highest of 1,361 cities
> Total property crimes: 36,197 — 11th highest of 1,361 cities
> Population: 651,932
[in-text-ad-2]

31. Davenport, Iowa
> 2020 burglaries per 100K people: 895.8
> Total burglaries: 912 — 100th highest of 1,438 cities
> Property crimes per 100K people: 3,925.1 — 112th highest of 1,361 cities
> Total property crimes: 3,996 — 144th highest of 1,361 cities
> Population: 102,169

30. Minneapolis, Minnesota
> 2020 burglaries per 100K people: 899.8
> Total burglaries: 3,915 — 22nd highest of 1,438 cities
> Property crimes per 100K people: 4,558.1 — 62nd highest of 1,361 cities
> Total property crimes: 19,833 — 30th highest of 1,361 cities
> Population: 420,324
[in-text-ad]

29. Tacoma, Washington
> 2020 burglaries per 100K people: 902.7
> Total burglaries: 1,987 — 45th highest of 1,438 cities
> Property crimes per 100K people: 5,507.4 — 22nd highest of 1,361 cities
> Total property crimes: 12,123 — 45th highest of 1,361 cities
> Population: 212,869

28. Puyallup, Washington
> 2020 burglaries per 100K people: 902.9
> Total burglaries: 388 — 261st highest of 1,438 cities (tied)
> Property crimes per 100K people: 5,929.2 — 13th highest of 1,361 cities
> Total property crimes: 2,548 — 263rd highest of 1,361 cities
> Population: 40,991

27. Albuquerque, New Mexico
> 2020 burglaries per 100K people: 902.9
> Total burglaries: 5,075 — 16th highest of 1,438 cities
> Property crimes per 100K people: 5,012.1 — 37th highest of 1,361 cities
> Total property crimes: 28,171 — 17th highest of 1,361 cities
> Population: 559,374
[in-text-ad-2]

26. South Salt Lake, Utah
> 2020 burglaries per 100K people: 910.3
> Total burglaries: 235 — 436th highest of 1,438 cities (tied)
> Property crimes per 100K people: 9,203.6 — the highest of 1,361 cities
> Total property crimes: 2,376 — 290th highest of 1,361 cities
> Population: 25,017

25. Parkersburg, West Virginia
> 2020 burglaries per 100K people: 910.8
> Total burglaries: 265 — 387th highest of 1,438 cities (tied)
> Property crimes per 100K people: 4,361.4 — 75th highest of 1,361 cities
> Total property crimes: 1,269 — 555th highest of 1,361 cities
> Population: 30,021
[in-text-ad]
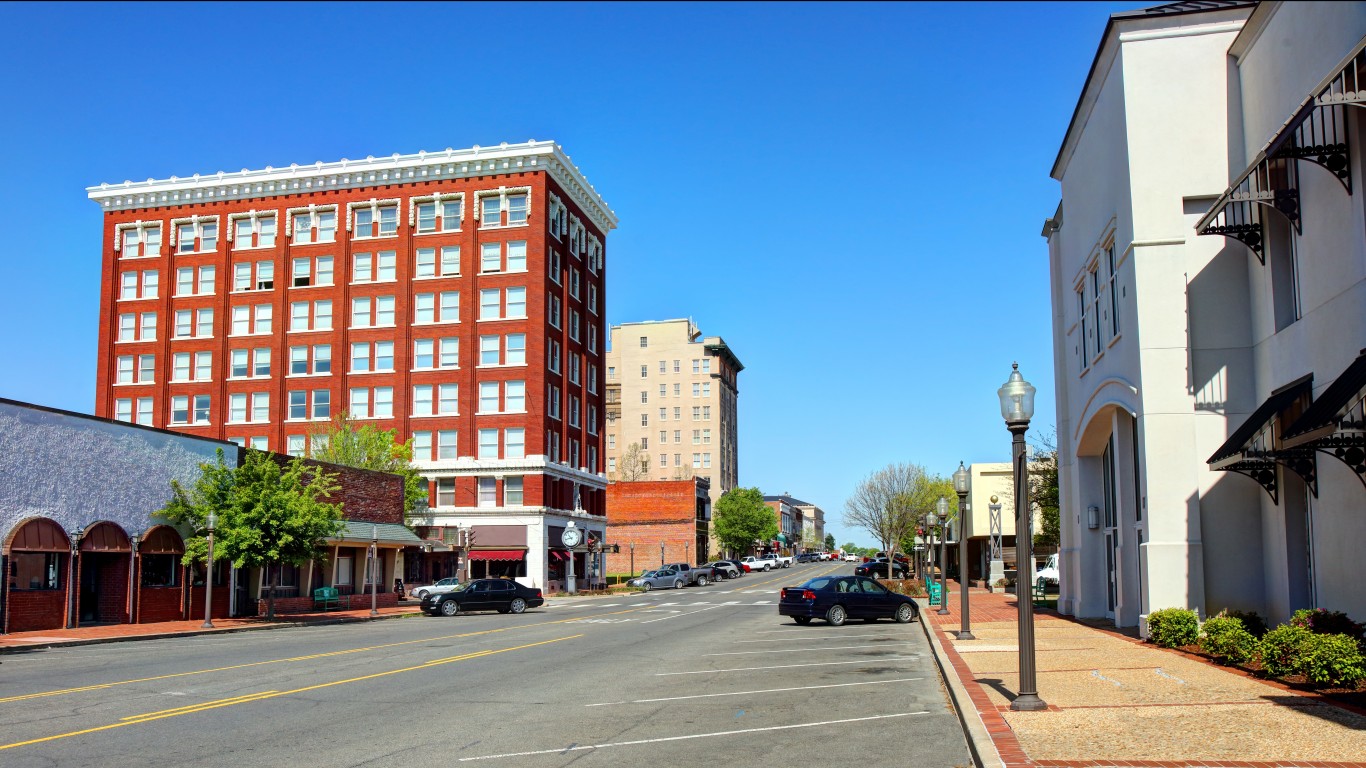
24. Muskogee, Oklahoma
> 2020 burglaries per 100K people: 924.5
> Total burglaries: 341 — 298th highest of 1,438 cities (tied)
> Property crimes per 100K people: 3,500.2 — 167th highest of 1,361 cities
> Total property crimes: 1,291 — 549th highest of 1,361 cities
> Population: 37,624

23. Kalamazoo, Michigan
> 2020 burglaries per 100K people: 964.5
> Total burglaries: 737 — 116th highest of 1,438 cities
> Property crimes per 100K people: 4,803.0 — 45th highest of 1,361 cities
> Total property crimes: 3,670 — 168th highest of 1,361 cities
> Population: 76,019

22. Cleveland, Ohio
> 2020 burglaries per 100K people: 973.8
> Total burglaries: 3,692 — 26th highest of 1,438 cities
> Property crimes per 100K people: 4,070.7 — 100th highest of 1,361 cities
> Total property crimes: 15,433 — 37th highest of 1,361 cities
> Population: 385,282
[in-text-ad-2]

21. Dayton, Ohio
> 2020 burglaries per 100K people: 977.2
> Total burglaries: 1,370 — 68th highest of 1,438 cities
> Property crimes per 100K people: 3,845.4 — 120th highest of 1,361 cities
> Total property crimes: 5,391 — 104th highest of 1,361 cities
> Population: 140,569

20. Canton, Ohio
> 2020 burglaries per 100K people: 1,009.6
> Total burglaries: 708 — 123rd highest of 1,438 cities
> Property crimes per 100K people: 4,864.2 — 40th highest of 1,361 cities
> Total property crimes: 3,411 — 180th highest of 1,361 cities
> Population: 71,243
[in-text-ad]

19. Montclair, California
> 2020 burglaries per 100K people: 1,010.6
> Total burglaries: 409 — 244th highest of 1,438 cities
> Property crimes per 100K people: 3,575.2 — 155th highest of 1,361 cities
> Total property crimes: 1,447 — 492nd highest of 1,361 cities (tied)
> Population: 39,155
18. Pine Bluff, Arkansas
> 2020 burglaries per 100K people: 1,016.7
> Total burglaries: 414 — 238th highest of 1,438 cities
> Property crimes per 100K people: 4,887.3 — 38th highest of 1,361 cities
> Total property crimes: 1,990 — 354th highest of 1,361 cities (tied)
> Population: 43,091
17. Goldsboro, North Carolina
> 2020 burglaries per 100K people: 1,024.9
> Total burglaries: 349 — 289th highest of 1,438 cities
> Property crimes per 100K people: 5,018.9 — 36th highest of 1,361 cities
> Total property crimes: 1,709 — 416th highest of 1,361 cities
> Population: 34,647
[in-text-ad-2]
16. Santa Monica, California
> 2020 burglaries per 100K people: 1,029.0
> Total burglaries: 931 — 98th highest of 1,438 cities
> Property crimes per 100K people: 4,257.6 — 81st highest of 1,361 cities
> Total property crimes: 3,852 — 154th highest of 1,361 cities
> Population: 91,577
15. Springfield, Ohio
> 2020 burglaries per 100K people: 1,054.6
> Total burglaries: 619 — 154th highest of 1,438 cities (tied)
> Property crimes per 100K people: 5,134.9 — 31st highest of 1,361 cities
> Total property crimes: 3,014 — 220th highest of 1,361 cities
> Population: 59,132
[in-text-ad]
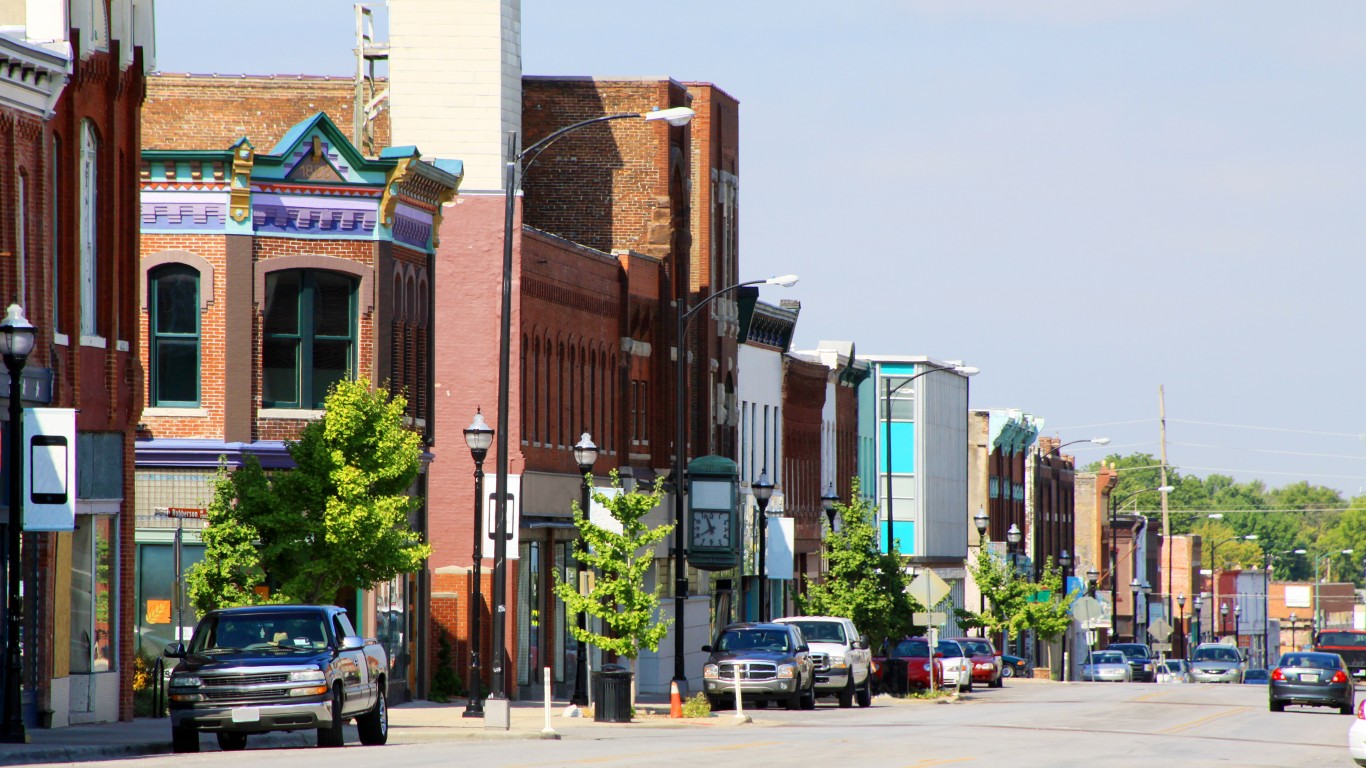
14. Springfield, Missouri
> 2020 burglaries per 100K people: 1,063.0
> Total burglaries: 1,795 — 51st highest of 1,438 cities
> Property crimes per 100K people: 6,951.5 — 5th highest of 1,361 cities
> Total property crimes: 11,738 — 47th highest of 1,361 cities
> Population: 167,051

13. Lake Charles, Louisiana
> 2020 burglaries per 100K people: 1,073.6
> Total burglaries: 849 — 105th highest of 1,438 cities
> Property crimes per 100K people: 3,175.4 — 235th highest of 1,361 cities
> Total property crimes: 2,511 — 268th highest of 1,361 cities
> Population: 77,283

12. Tulsa, Oklahoma
> 2020 burglaries per 100K people: 1,095.8
> Total burglaries: 4,407 — 18th highest of 1,438 cities
> Property crimes per 100K people: 5,111.6 — 32nd highest of 1,361 cities
> Total property crimes: 20,557 — 28th highest of 1,361 cities
> Population: 402,324
[in-text-ad-2]

11. Charleston, West Virginia
> 2020 burglaries per 100K people: 1,099.1
> Total burglaries: 506 — 186th highest of 1,438 cities
> Property crimes per 100K people: 4,609.2 — 58th highest of 1,361 cities
> Total property crimes: 2,122 — 330th highest of 1,361 cities
> Population: 48,006

10. Spartanburg, South Carolina
> 2020 burglaries per 100K people: 1,158.3
> Total burglaries: 434 — 222nd highest of 1,438 cities (tied)
> Property crimes per 100K people: 6,101.0 — 12th highest of 1,361 cities
> Total property crimes: 2,286 — 303rd highest of 1,361 cities
> Population: 37,424
[in-text-ad]
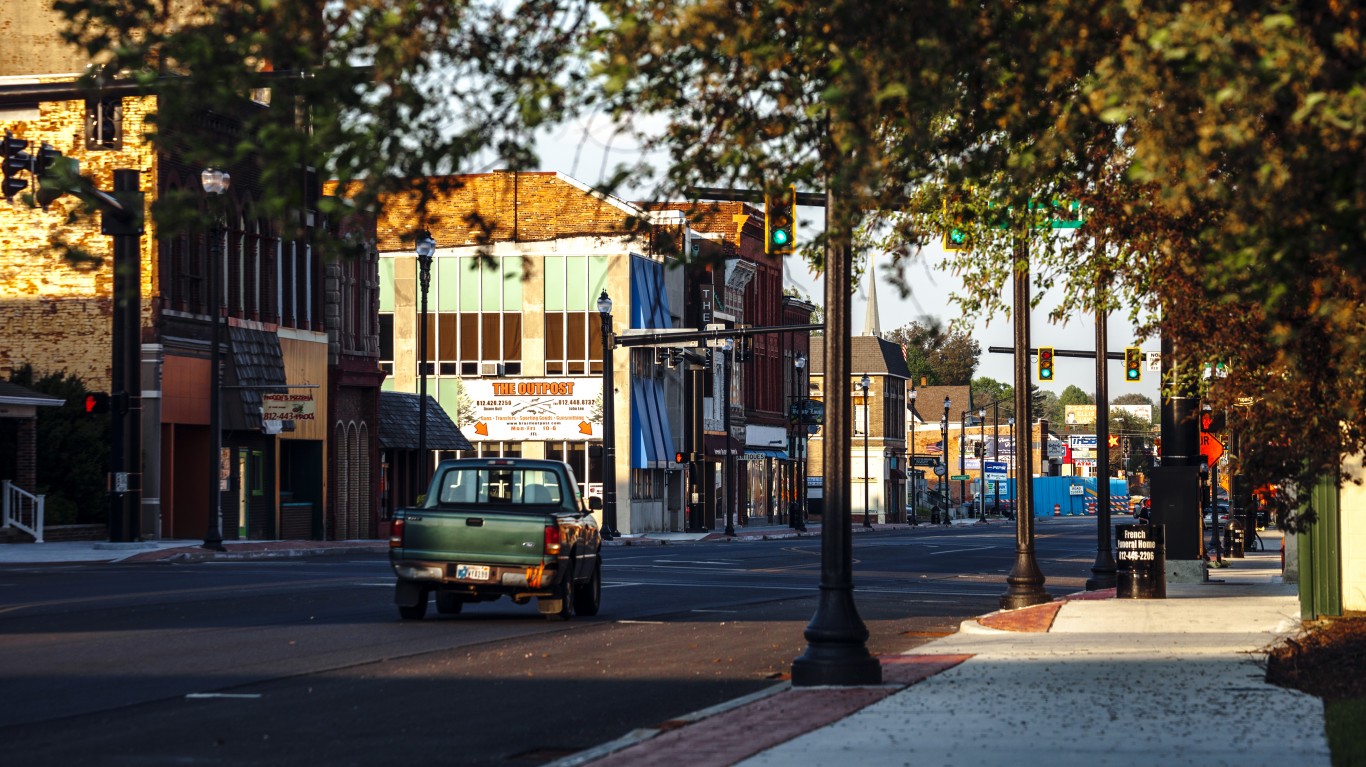
9. Terre Haute, Indiana
> 2020 burglaries per 100K people: 1,292.0
> Total burglaries: 783 — 112th highest of 1,438 cities
> Property crimes per 100K people: 4,762.1 — 49th highest of 1,361 cities
> Total property crimes: 2,886 — 234th highest of 1,361 cities
> Population: 60,673

8. Jonesboro, Arkansas
> 2020 burglaries per 100K people: 1,302.4
> Total burglaries: 1,038 — 90th highest of 1,438 cities
> Property crimes per 100K people: 3,544.5 — 158th highest of 1,361 cities
> Total property crimes: 2,825 — 240th highest of 1,361 cities
> Population: 76,036
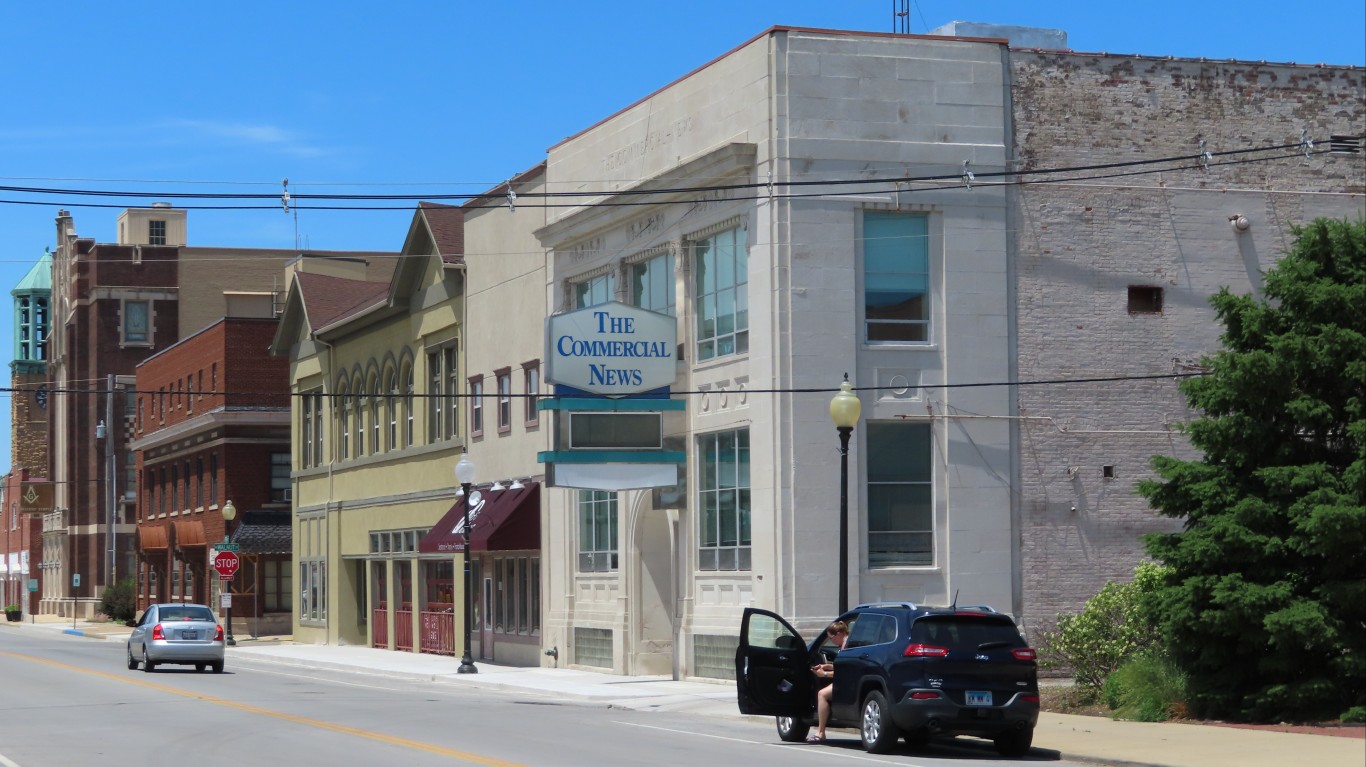
7. Danville, Illinois
> 2020 burglaries per 100K people: 1,320.8
> Total burglaries: 399 — 255th highest of 1,438 cities
> Property crimes per 100K people: N/A
> Total property crimes: N/A
> Population: 31,246
[in-text-ad-2]

6. Seattle, Washington
> 2020 burglaries per 100K people: 1,351.5
> Total burglaries: 10,427 — 4th highest of 1,438 cities
> Property crimes per 100K people: 4,872.6 — 39th highest of 1,361 cities
> Total property crimes: 37,593 — 8th highest of 1,361 cities
> Population: 724,305

5. Monroe, Louisiana
> 2020 burglaries per 100K people: 1,377.4
> Total burglaries: 649 — 142nd highest of 1,438 cities
> Property crimes per 100K people: 6,118.6 — 11th highest of 1,361 cities
> Total property crimes: 2,883 — 235th highest of 1,361 cities
> Population: 48,241
[in-text-ad]
4. Vallejo, California
> 2020 burglaries per 100K people: 1,480.5
> Total burglaries: 1,811 — 50th highest of 1,438 cities
> Property crimes per 100K people: 3,333.7 — 197th highest of 1,361 cities
> Total property crimes: 4,078 — 140th highest of 1,361 cities
> Population: 121,267

3. Starkville, Mississippi
> 2020 burglaries per 100K people: 1,558.8
> Total burglaries: 403 — 251st highest of 1,438 cities (tied)
> Property crimes per 100K people: 3,349.6 — 194th highest of 1,361 cities
> Total property crimes: 866 — 582nd lowest of 1,361 cities (tied)
> Population: 25,387
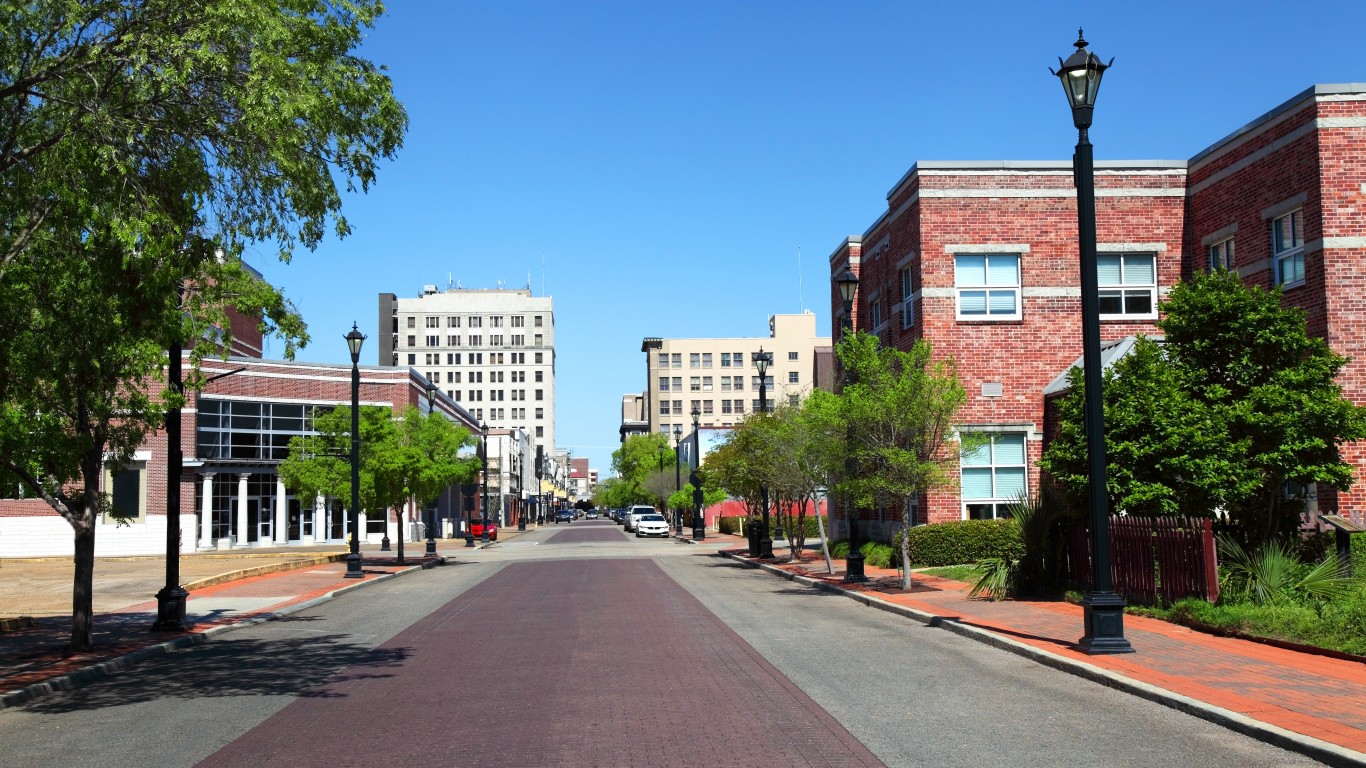
2. Alexandria, Louisiana
> 2020 burglaries per 100K people: 1,639.6
> Total burglaries: 754 — 114th highest of 1,438 cities
> Property crimes per 100K people: 7,213.1 — 4th highest of 1,361 cities
> Total property crimes: 3,317 — 186th highest of 1,361 cities
> Population: 47,012
[in-text-ad-2]

1. Hot Springs, Arkansas
> 2020 burglaries per 100K people: 1,686.7
> Total burglaries: 656 — 136th highest of 1,438 cities
> Property crimes per 100K people: 5,852.0 — 14th highest of 1,361 cities
> Total property crimes: 2,276 — 305th highest of 1,361 cities
> Population: 38,559
Methodology
To determine the cities with the highest burglary rate in every state, 24/7 Wall St. reviewed burglary figures from the FBI’s 2020 Uniform Crime Report.
We included cities that have more than 25,000 people based on five-year estimates from the U.S. Census Bureau’s 2019 American Community Survey. Limited data was available in the 2020 UCR for areas in Alabama, Maryland, Pennsylvania, and Illinois, though cities in these states were not excluded from analysis.
Data for property crime — a category that includes larceny-theft, burglary, and motor vehicle theft — also came from the 2020 FBI UCR. Population figures are five-year estimates from the U.S. Census Bureau’s 2019 American Community Survey. However, these estimates were not used to calculate crime rates. Crime rates per 100,000 people were calculated using population figures provided by the FBI in the 2020 UCR.
Thank you for reading! Have some feedback for us?
Contact the 24/7 Wall St. editorial team.
 24/7 Wall St.
 24/7 Wall St.
 24/7 Wall St.
 24/7 Wall St.


 24/7 Wall St.