Life expectancy is one of the most important and commonly cited indicators of population health — and in the United States, life expectancy is falling at a historic rate. According to the Centers for Disease Control and Prevention, life expectancy at birth declined by 1.5 years in 2020, the largest one-year drop since World War II.
The CDC attributes the decline to the COVID-19 pandemic and 93,000 drug overdose deaths — an all-time one-year high. Homicide, diabetes, and liver disease were also contributing factors. Here is a look at the states with the most drug overdose deaths in 2020.
Even before the pandemic, there were parts of the country where life expectancy at birth was far lower than the national average — in some cases by 10 years or more.
Using data from County Health Rankings & Roadmaps, a Robert Wood Johnson Foundation and University of Wisconsin Population Health Institute joint program, 24/7 Wall St. identified the 50 U.S. counties with the shortest average life expectancy at birth. Life expectancy figures are averages for the years 2017 through 2019, the most recent period for which county-level data is available.
Among the counties and county equivalents on this list, average life expectancy at birth ranges from 70.9 years to less than 65 years — compared to the national average of 79.2 years. The majority of the counties on this list are located in the South, including 10 in Mississippi alone.
Variations in life expectancy are tied to a number of both economic and behavioral factors. For example, tobacco use is the leading cause of preventable death in the U.S., and in every county on this list, the share of adults who smoke is above the 16.6% national average. Here is a look at the American cities where the most people smoke.
Income levels are also linked to life expectancy. Poverty, for example, presents challenges and stressors that can take a cumulative toll on both physical and mental health. Additionally, lower-income Americans are less able to afford adequate health care or a range of healthy options related to diet and lifestyle. Recent studies have shown that life expectancy among the wealthiest 1% of Americans exceeds that of the poorest 1% by well over a decade. In all but a few counties on this list, the poverty rate exceeds the 13.4% national average.
Click here for the US counties with the shortest life expectancy
50. Quitman County, Georgia
> Life expectancy at birth (years): 70.9
> Adults reporting poor or fair health: 27.8% — 227th highest of 3,070 counties
> Adult obesity rate: 28.9% — 628th lowest of 3,070 counties
> Smoking rate: 25.1% — 559th highest of 3,070 counties
> Population without health insurance: 23.6% — 49th highest of 3,070 counties
> Median household income: $26,667 — 16th lowest of 3,070 counties
> Poverty rate: 20.3% — 552nd highest of 3,070 counties
[in-text-ad]

49. Whitley County, Kentucky
> Life expectancy at birth (years): 70.9
> Adults reporting poor or fair health: 27.4% — 270th highest of 3,070 counties
> Adult obesity rate: 35.6% — 1,154th highest of 3,070 counties
> Smoking rate: 27.5% — 209th highest of 3,070 counties
> Population without health insurance: 5.6% — 689th lowest of 3,070 counties
> Median household income: $39,005 — 360th lowest of 3,070 counties
> Poverty rate: 23.6% — 297th highest of 3,070 counties
48. Wilkinson County, Mississippi
> Life expectancy at birth (years): 70.9
> Adults reporting poor or fair health: 36.1% — 13th highest of 3,070 counties
> Adult obesity rate: 49.4% — 18th highest of 3,070 counties
> Smoking rate: 29.9% — 66th highest of 3,070 counties
> Population without health insurance: 13.3% — 602nd highest of 3,070 counties
> Median household income: $27,313 — 24th lowest of 3,070 counties
> Poverty rate: 34.7% — 36th highest of 3,070 counties
47. Wilcox County, Alabama
> Life expectancy at birth (years): 70.8
> Adults reporting poor or fair health: 32.1% — 55th highest of 3,070 counties
> Adult obesity rate: 49.8% — 15th highest of 3,070 counties
> Smoking rate: 25.8% — 429th highest of 3,070 counties
> Population without health insurance: 10.9% — 1,008th highest of 3,070 counties
> Median household income: $31,014 — 71st lowest of 3,070 counties
> Poverty rate: 30.1% — 85th highest of 3,070 counties
[in-text-ad-2]
46. Quitman County, Mississippi
> Life expectancy at birth (years): 70.8
> Adults reporting poor or fair health: 35.7% — 21st highest of 3,070 counties
> Adult obesity rate: 34.5% — 1,396th highest of 3,070 counties
> Smoking rate: 28.5% — 125th highest of 3,070 counties
> Population without health insurance: 17.4% — 231st highest of 3,070 counties
> Median household income: $25,283 — 13th lowest of 3,070 counties
> Poverty rate: 35.6% — 27th highest of 3,070 counties
45. Franklin city, Virginia
> Life expectancy at birth (years): 70.7
> Adults reporting poor or fair health: 24.6% — 613th highest of 3,070 counties
> Adult obesity rate: 37.8% — 717th highest of 3,070 counties
> Smoking rate: 22.4% — 1,193rd highest of 3,070 counties
> Population without health insurance: 6.7% — 1,053rd lowest of 3,070 counties
> Median household income: $40,417 — 457th lowest of 3,070 counties
> Poverty rate: 14.7% — 1,463rd highest of 3,070 counties
[in-text-ad]
44. Mingo County, West Virginia
> Life expectancy at birth (years): 70.7
> Adults reporting poor or fair health: 32.9% — 47th highest of 3,070 counties
> Adult obesity rate: 41.9% — 220th highest of 3,070 counties
> Smoking rate: 33.6% — 12th highest of 3,070 counties
> Population without health insurance: 4.5% — 349th lowest of 3,070 counties
> Median household income: $32,764 — 108th lowest of 3,070 counties
> Poverty rate: 28.7% — 103rd highest of 3,070 counties

43. Leflore County, Mississippi
> Life expectancy at birth (years): 70.7
> Adults reporting poor or fair health: 32.6% — 49th highest of 3,070 counties
> Adult obesity rate: 41.1% — 268th highest of 3,070 counties
> Smoking rate: 27.2% — 246th highest of 3,070 counties
> Population without health insurance: 14.5% — 452nd highest of 3,070 counties
> Median household income: $26,735 — 17th lowest of 3,070 counties
> Poverty rate: 36.8% — 20th highest of 3,070 counties

42. Holmes County, Mississippi
> Life expectancy at birth (years): 70.6
> Adults reporting poor or fair health: 37.0% — 9th highest of 3,070 counties
> Adult obesity rate: 50.7% — 9th highest of 3,070 counties
> Smoking rate: 29.4% — 80th highest of 3,070 counties
> Population without health insurance: 16.1% — 313th highest of 3,070 counties
> Median household income: $21,504 — the lowest of 3,070 counties
> Poverty rate: 42.4% — 8th highest of 3,070 counties
[in-text-ad-2]
41. Walker County, Alabama
> Life expectancy at birth (years): 70.5
> Adults reporting poor or fair health: 24.1% — 687th highest of 3,070 counties
> Adult obesity rate: 39.4% — 450th highest of 3,070 counties
> Smoking rate: 24.7% — 646th highest of 3,070 counties
> Population without health insurance: 11.8% — 828th highest of 3,070 counties
> Median household income: $43,629 — 721st lowest of 3,070 counties
> Poverty rate: 18.1% — 827th highest of 3,070 counties
40. Washington County, Mississippi
> Life expectancy at birth (years): 70.5
> Adults reporting poor or fair health: 29.4% — 134th highest of 3,070 counties
> Adult obesity rate: 43.2% — 134th highest of 3,070 counties
> Smoking rate: 24.7% — 641st highest of 3,070 counties
> Population without health insurance: 15.7% — 353rd highest of 3,070 counties
> Median household income: $29,705 — 45th lowest of 3,070 counties
> Poverty rate: 33.9% — 42nd highest of 3,070 counties
[in-text-ad]
39. Hancock County, Tennessee
> Life expectancy at birth (years): 70.5
> Adults reporting poor or fair health: 27.7% — 230th highest of 3,070 counties
> Adult obesity rate: 28.6% — 572nd lowest of 3,070 counties
> Smoking rate: 30.8% — 41st highest of 3,070 counties
> Population without health insurance: 10.8% — 1,039th highest of 3,070 counties
> Median household income: $30,136 — 55th lowest of 3,070 counties
> Poverty rate: 28.6% — 105th highest of 3,070 counties
38. Nome Census Area, Alaska
> Life expectancy at birth (years): 70.5
> Adults reporting poor or fair health: 28.0% — 207th highest of 3,070 counties
> Adult obesity rate: 40.3% — 349th highest of 3,070 counties
> Smoking rate: 33.8% — 11th highest of 3,070 counties
> Population without health insurance: 20.7% — 92nd highest of 3,070 counties
> Median household income: $61,048 — 672nd highest of 3,070 counties
> Poverty rate: 21.5% — 442nd highest of 3,070 counties

37. Harlan County, Kentucky
> Life expectancy at birth (years): 70.5
> Adults reporting poor or fair health: 34.6% — 31st highest of 3,070 counties
> Adult obesity rate: 40.2% — 355th highest of 3,070 counties
> Smoking rate: 32.3% — 25th highest of 3,070 counties
> Population without health insurance: 5.8% — 771st lowest of 3,070 counties
> Median household income: $26,478 — 15th lowest of 3,070 counties
> Poverty rate: 36.0% — 25th highest of 3,070 counties
[in-text-ad-2]
36. Leslie County, Kentucky
> Life expectancy at birth (years): 70.4
> Adults reporting poor or fair health: 31.7% — 60th highest of 3,070 counties
> Adult obesity rate: 40.7% — 307th highest of 3,070 counties
> Smoking rate: 30.3% — 55th highest of 3,070 counties
> Population without health insurance: 4.5% — 336th lowest of 3,070 counties
> Median household income: $31,627 — 77th lowest of 3,070 counties
> Poverty rate: 38.0% — 18th highest of 3,070 counties

35. Sunflower County, Mississippi
> Life expectancy at birth (years): 70.3
> Adults reporting poor or fair health: 32.4% — 51st highest of 3,070 counties
> Adult obesity rate: 53.7% — 2nd highest of 3,070 counties
> Smoking rate: 26.4% — 347th highest of 3,070 counties
> Population without health insurance: 14.4% — 465th highest of 3,070 counties
> Median household income: $30,838 — 66th lowest of 3,070 counties
> Poverty rate: 31.7% — 62nd highest of 3,070 counties
[in-text-ad]

34. Wolfe County, Kentucky
> Life expectancy at birth (years): 70.3
> Adults reporting poor or fair health: 34.6% — 29th highest of 3,070 counties
> Adult obesity rate: 37.6% — 755th highest of 3,070 counties
> Smoking rate: 33.6% — 17th highest of 3,070 counties
> Population without health insurance: 2.3% — 16th lowest of 3,070 counties
> Median household income: $24,623 — 8th lowest of 3,070 counties
> Poverty rate: 29.2% — 95th highest of 3,070 counties
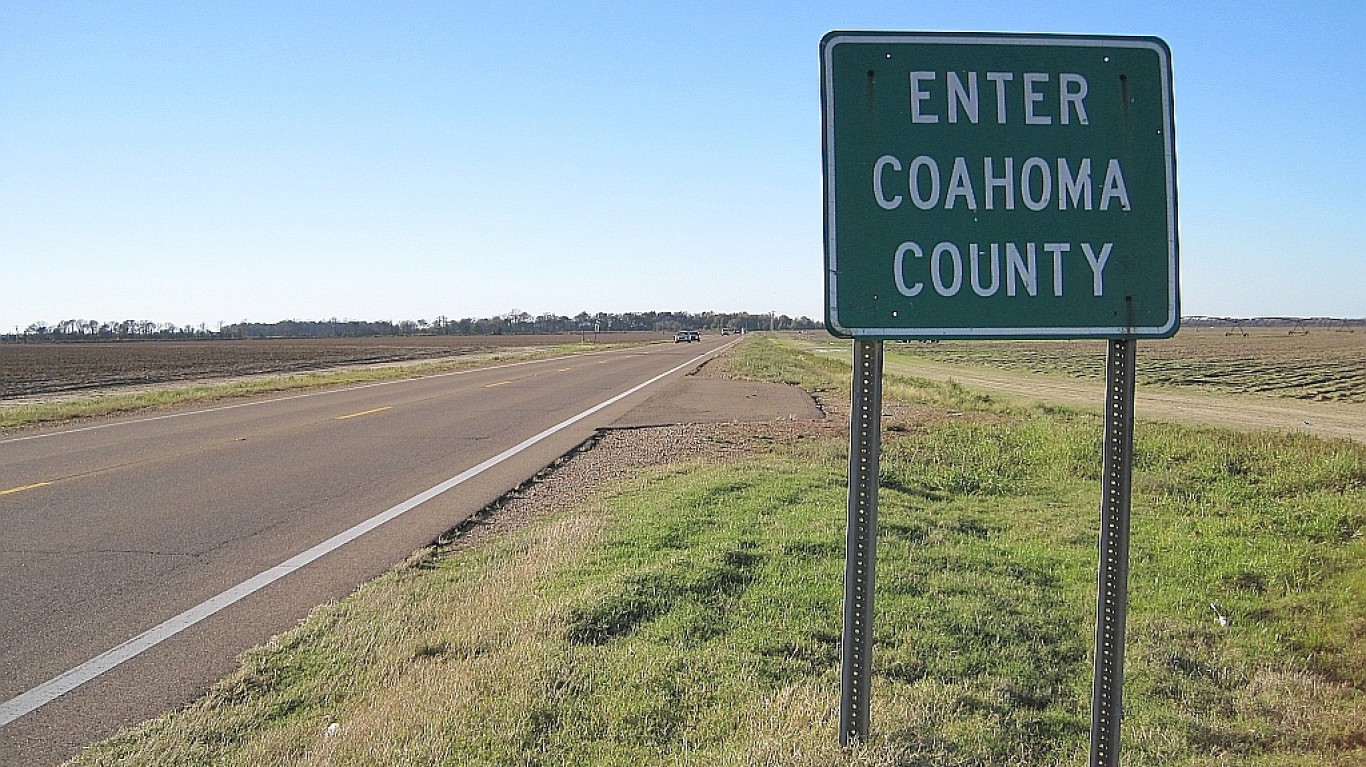
33. Coahoma County, Mississippi
> Life expectancy at birth (years): 70.3
> Adults reporting poor or fair health: 33.1% — 45th highest of 3,070 counties
> Adult obesity rate: 42.7% — 158th highest of 3,070 counties
> Smoking rate: 25.2% — 533rd highest of 3,070 counties
> Population without health insurance: 13.0% — 639th highest of 3,070 counties
> Median household income: $29,121 — 39th lowest of 3,070 counties
> Poverty rate: 34.8% — 33rd highest of 3,070 counties

32. Grenada County, Mississippi
> Life expectancy at birth (years): 70.1
> Adults reporting poor or fair health: 25.4% — 504th highest of 3,070 counties
> Adult obesity rate: 44.7% — 91st highest of 3,070 counties
> Smoking rate: 23.8% — 848th highest of 3,070 counties
> Population without health insurance: 11.7% — 830th highest of 3,070 counties
> Median household income: $40,122 — 432nd lowest of 3,070 counties
> Poverty rate: 21.1% — 474th highest of 3,070 counties
[in-text-ad-2]
31. Mahnomen County, Minnesota
> Life expectancy at birth (years): 70.1
> Adults reporting poor or fair health: 24.3% — 661st highest of 3,070 counties
> Adult obesity rate: 38.4% — 601st highest of 3,070 counties
> Smoking rate: 30.0% — 63rd highest of 3,070 counties
> Population without health insurance: 14.0% — 507th highest of 3,070 counties
> Median household income: $44,688 — 813th lowest of 3,070 counties
> Poverty rate: 23.3% — 312th highest of 3,070 counties

30. Sharkey County, Mississippi
> Life expectancy at birth (years): 70.0
> Adults reporting poor or fair health: 35.0% — 24th highest of 3,070 counties
> Adult obesity rate: 42.0% — 213th highest of 3,070 counties
> Smoking rate: 27.7% — 188th highest of 3,070 counties
> Population without health insurance: 17.8% — 212th highest of 3,070 counties
> Median household income: $29,394 — 43rd lowest of 3,070 counties
> Poverty rate: 27.4% — 136th highest of 3,070 counties
[in-text-ad]

29. Tunica County, Mississippi
> Life expectancy at birth (years): 69.9
> Adults reporting poor or fair health: 28.1% — 204th highest of 3,070 counties
> Adult obesity rate: 44.2% — 102nd highest of 3,070 counties
> Smoking rate: 23.0% — 1,051st highest of 3,070 counties
> Population without health insurance: 15.1% — 402nd highest of 3,070 counties
> Median household income: $39,370 — 382nd lowest of 3,070 counties
> Poverty rate: 24.0% — 270th highest of 3,070 counties
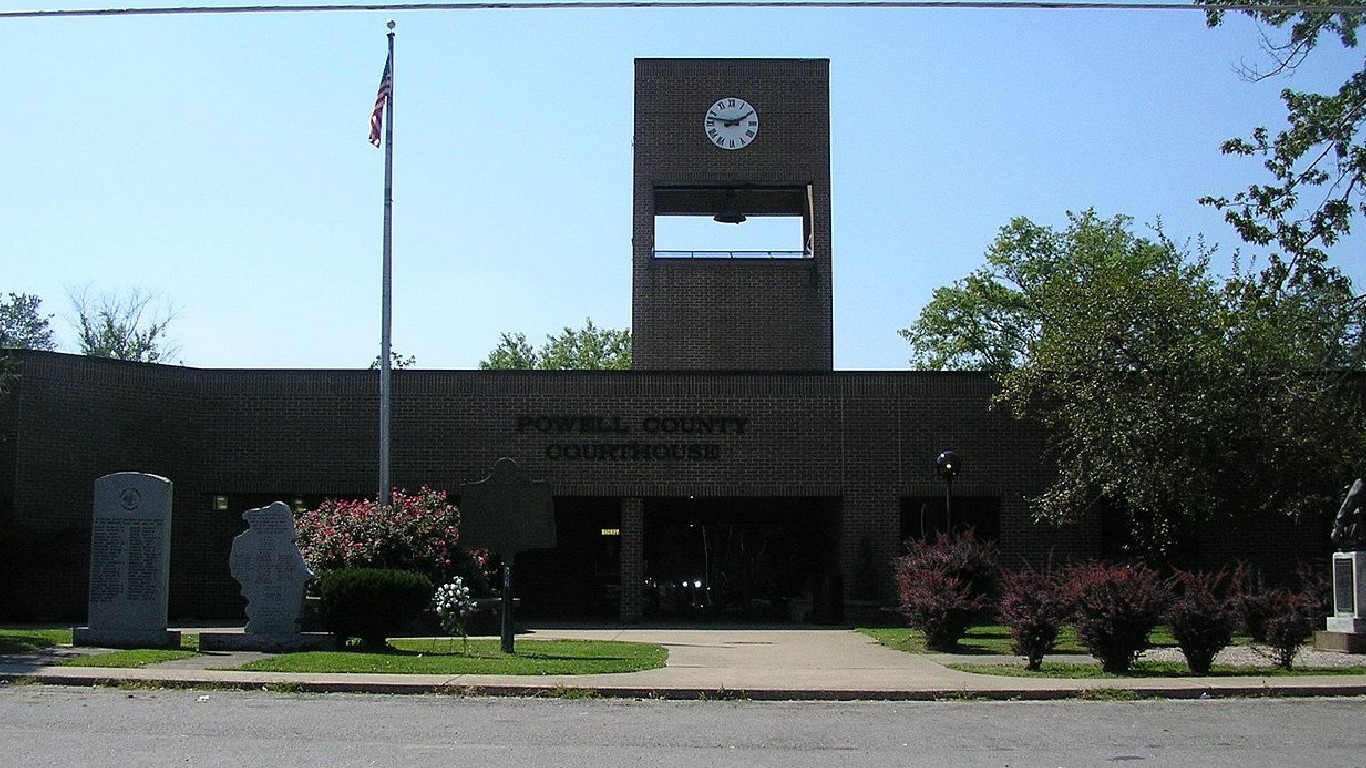
28. Powell County, Kentucky
> Life expectancy at birth (years): 69.7
> Adults reporting poor or fair health: 26.7% — 345th highest of 3,070 counties
> Adult obesity rate: 29.4% — 707th lowest of 3,070 counties
> Smoking rate: 27.0% — 282nd highest of 3,070 counties
> Population without health insurance: 4.6% — 374th lowest of 3,070 counties
> Median household income: $37,469 — 269th lowest of 3,070 counties
> Poverty rate: 21.4% — 449th highest of 3,070 counties
27. Emporia city, Virginia
> Life expectancy at birth (years): 69.7
> Adults reporting poor or fair health: 31.5% — 63rd highest of 3,070 counties
> Adult obesity rate: 28.8% — 615th lowest of 3,070 counties
> Smoking rate: 26.5% — 335th highest of 3,070 counties
> Population without health insurance: 13.9% — 519th highest of 3,070 counties
> Median household income: $27,063 — 21st lowest of 3,070 counties
> Poverty rate: 27.0% — 149th highest of 3,070 counties
[in-text-ad-2]

26. Monroe County, Arkansas
> Life expectancy at birth (years): 69.7
> Adults reporting poor or fair health: 32.1% — 56th highest of 3,070 counties
> Adult obesity rate: 43.5% — 123rd highest of 3,070 counties
> Smoking rate: 28.2% — 141st highest of 3,070 counties
> Population without health insurance: 8.9% — 1,464th highest of 3,070 counties
> Median household income: $38,468 — 331st lowest of 3,070 counties
> Poverty rate: 27.1% — 147th highest of 3,070 counties

25. Logan County, West Virginia
> Life expectancy at birth (years): 69.7
> Adults reporting poor or fair health: 30.0% — 109th highest of 3,070 counties
> Adult obesity rate: 42.7% — 160th highest of 3,070 counties
> Smoking rate: 29.5% — 76th highest of 3,070 counties
> Population without health insurance: 7.2% — 1,177th lowest of 3,070 counties
> Median household income: $36,168 — 207th lowest of 3,070 counties
> Poverty rate: 25.4% — 200th highest of 3,070 counties
[in-text-ad]
24. Okfuskee County, Oklahoma
> Life expectancy at birth (years): 69.6
> Adults reporting poor or fair health: 28.4% — 180th highest of 3,070 counties
> Adult obesity rate: 58.9% — the highest of 3,070 counties
> Smoking rate: 28.9% — 107th highest of 3,070 counties
> Population without health insurance: 23.6% — 48th highest of 3,070 counties
> Median household income: $38,411 — 328th lowest of 3,070 counties
> Poverty rate: 26.3% — 169th highest of 3,070 counties

23. Breathitt County, Kentucky
> Life expectancy at birth (years): 69.6
> Adults reporting poor or fair health: 32.2% — 53rd highest of 3,070 counties
> Adult obesity rate: 40.0% — 376th highest of 3,070 counties (tied)
> Smoking rate: 31.4% — 31st highest of 3,070 counties
> Population without health insurance: 4.5% — 341st lowest of 3,070 counties
> Median household income: $27,344 — 25th lowest of 3,070 counties
> Poverty rate: 34.4% — 41st highest of 3,070 counties
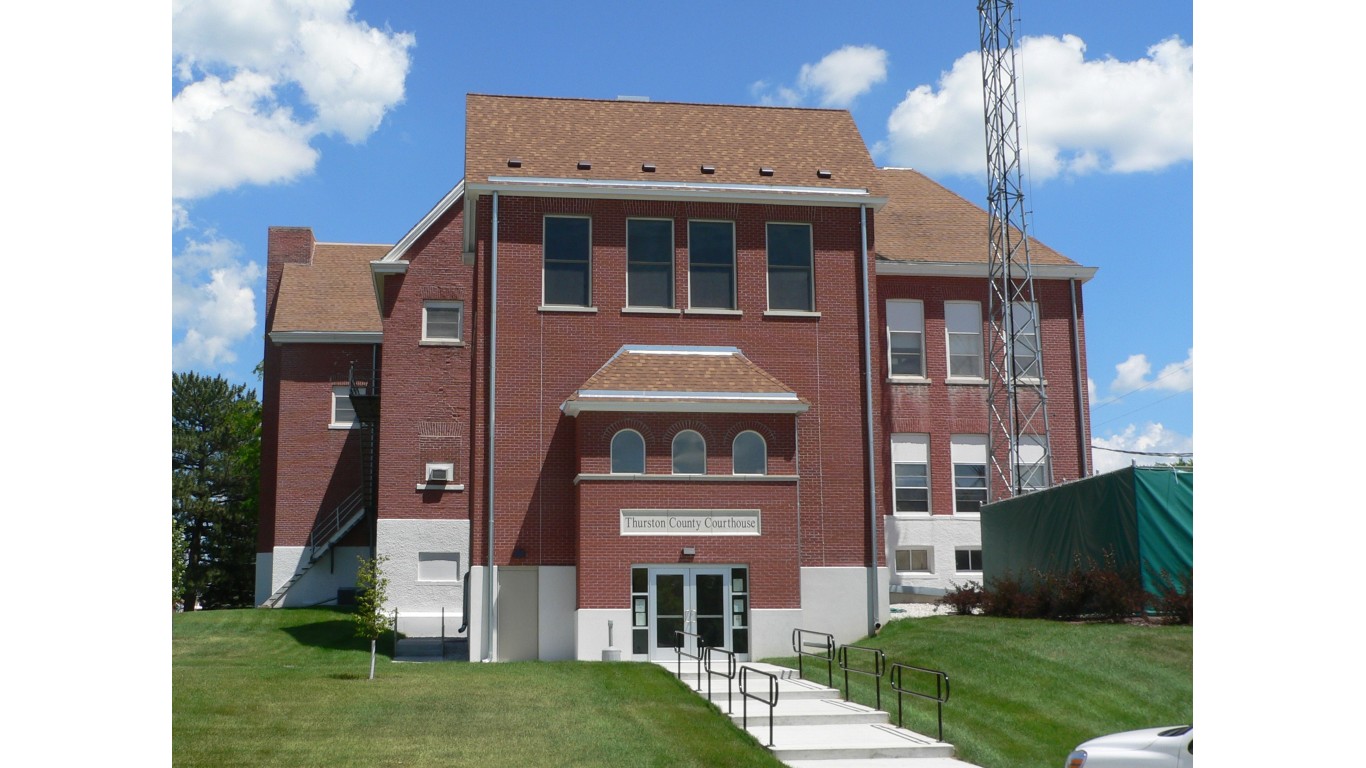
22. Thurston County, Nebraska
> Life expectancy at birth (years): 69.5
> Adults reporting poor or fair health: 23.5% — 785th highest of 3,070 counties
> Adult obesity rate: 47.2% — 36th highest of 3,070 counties
> Smoking rate: 27.1% — 268th highest of 3,070 counties
> Population without health insurance: 25.3% — 36th highest of 3,070 counties
> Median household income: $51,034 — 1,462nd lowest of 3,070 counties
> Poverty rate: 25.5% — 193rd highest of 3,070 counties
[in-text-ad-2]
21. Owsley County, Kentucky
> Life expectancy at birth (years): 69.4
> Adults reporting poor or fair health: 30.5% — 90th highest of 3,070 counties
> Adult obesity rate: 46.7% — 44th highest of 3,070 counties
> Smoking rate: 31.3% — 33rd highest of 3,070 counties
> Population without health insurance: 3.5% — 103rd lowest of 3,070 counties
> Median household income: $30,284 — 59th lowest of 3,070 counties
> Poverty rate: 30.3% — 81st highest of 3,070 counties
20. Bennett County, South Dakota
> Life expectancy at birth (years): 69.4
> Adults reporting poor or fair health: 26.2% — 397th highest of 3,070 counties
> Adult obesity rate: 41.6% — 236th highest of 3,070 counties
> Smoking rate: 32.1% — 26th highest of 3,070 counties
> Population without health insurance: 24.6% — 42nd highest of 3,070 counties
> Median household income: $47,500 — 1,079th lowest of 3,070 counties (tied)
> Poverty rate: 35.9% — 26th highest of 3,070 counties
[in-text-ad]

19. Edwards County, Kansas
> Life expectancy at birth (years): 69.3
> Adults reporting poor or fair health: 19.2% — 1,439th lowest of 3,070 counties
> Adult obesity rate: 35.1% — 1,244th highest of 3,070 counties
> Smoking rate: 20.6% — 1,361st lowest of 3,070 counties
> Population without health insurance: 6.6% — 1,019th lowest of 3,070 counties
> Median household income: $50,902 — 1,453rd lowest of 3,070 counties
> Poverty rate: 10.0% — 630th lowest of 3,070 counties
18. McDowell County, West Virginia
> Life expectancy at birth (years): 69.0
> Adults reporting poor or fair health: 36.5% — 10th highest of 3,070 counties
> Adult obesity rate: 44.9% — 80th highest of 3,070 counties
> Smoking rate: 34.7% — 8th highest of 3,070 counties
> Population without health insurance: 6.0% — 841st lowest of 3,070 counties
> Median household income: $27,682 — 29th lowest of 3,070 counties
> Poverty rate: 33.2% — 50th highest of 3,070 counties
17. Kingman County, Kansas
> Life expectancy at birth (years): 68.9
> Adults reporting poor or fair health: 14.1% — 327th lowest of 3,070 counties
> Adult obesity rate: 31.2% — 1,024th lowest of 3,070 counties
> Smoking rate: 18.5% — 711th lowest of 3,070 counties
> Population without health insurance: 5.7% — 730th lowest of 3,070 counties
> Median household income: $60,469 — 719th highest of 3,070 counties
> Poverty rate: 7.6% — 233rd lowest of 3,070 counties
[in-text-ad-2]
16. Perry County, Kentucky
> Life expectancy at birth (years): 68.5
> Adults reporting poor or fair health: 29.6% — 125th highest of 3,070 counties
> Adult obesity rate: 43.3% — 130th highest of 3,070 counties
> Smoking rate: 29.2% — 87th highest of 3,070 counties
> Population without health insurance: 5.2% — 566th lowest of 3,070 counties
> Median household income: $33,640 — 124th lowest of 3,070 counties
> Poverty rate: 26.1% — 172nd highest of 3,070 counties
15. Sioux County, North Dakota
> Life expectancy at birth (years): 68.5
> Adults reporting poor or fair health: 33.9% — 37th highest of 3,070 counties
> Adult obesity rate: 36.3% — 1,000th highest of 3,070 counties
> Smoking rate: 36.2% — 5th highest of 3,070 counties
> Population without health insurance: 31.6% — 11th highest of 3,070 counties
> Median household income: $38,939 — 356th lowest of 3,070 counties
> Poverty rate: 38.2% — 16th highest of 3,070 counties
[in-text-ad]
14. Union County, Florida
> Life expectancy at birth (years): 68.3
> Adults reporting poor or fair health: 27.7% — 235th highest of 3,070 counties
> Adult obesity rate: 37.4% — 774th highest of 3,070 counties
> Smoking rate: 29.5% — 77th highest of 3,070 counties
> Population without health insurance: 10.8% — 1,024th highest of 3,070 counties
> Median household income: $44,270 — 778th lowest of 3,070 counties
> Poverty rate: 20.8% — 494th highest of 3,070 counties

13. Big Horn County, Montana
> Life expectancy at birth (years): 68.2
> Adults reporting poor or fair health: 25.5% — 478th highest of 3,070 counties
> Adult obesity rate: 39.2% — 480th highest of 3,070 counties
> Smoking rate: 28.9% — 104th highest of 3,070 counties
> Population without health insurance: 32.3% — 10th highest of 3,070 counties
> Median household income: $49,859 — 1,314th lowest of 3,070 counties
> Poverty rate: 25.5% — 195th highest of 3,070 counties
12. Dewey County, South Dakota
> Life expectancy at birth (years): 68.1
> Adults reporting poor or fair health: 27.3% — 277th highest of 3,070 counties
> Adult obesity rate: 42.6% — 165th highest of 3,070 counties
> Smoking rate: 31.8% — 29th highest of 3,070 counties
> Population without health insurance: 27.4% — 24th highest of 3,070 counties
> Median household income: $47,475 — 1,075th lowest of 3,070 counties
> Poverty rate: 31.3% — 65th highest of 3,070 counties
[in-text-ad-2]
11. Martinsville city, Virginia
> Life expectancy at birth (years): 67.9
> Adults reporting poor or fair health: 24.7% — 587th highest of 3,070 counties
> Adult obesity rate: 24.3% — 195th lowest of 3,070 counties
> Smoking rate: 23.2% — 1,013th highest of 3,070 counties
> Population without health insurance: 11.2% — 951st highest of 3,070 counties
> Median household income: $34,371 — 144th lowest of 3,070 counties
> Poverty rate: 23.9% — 275th highest of 3,070 counties
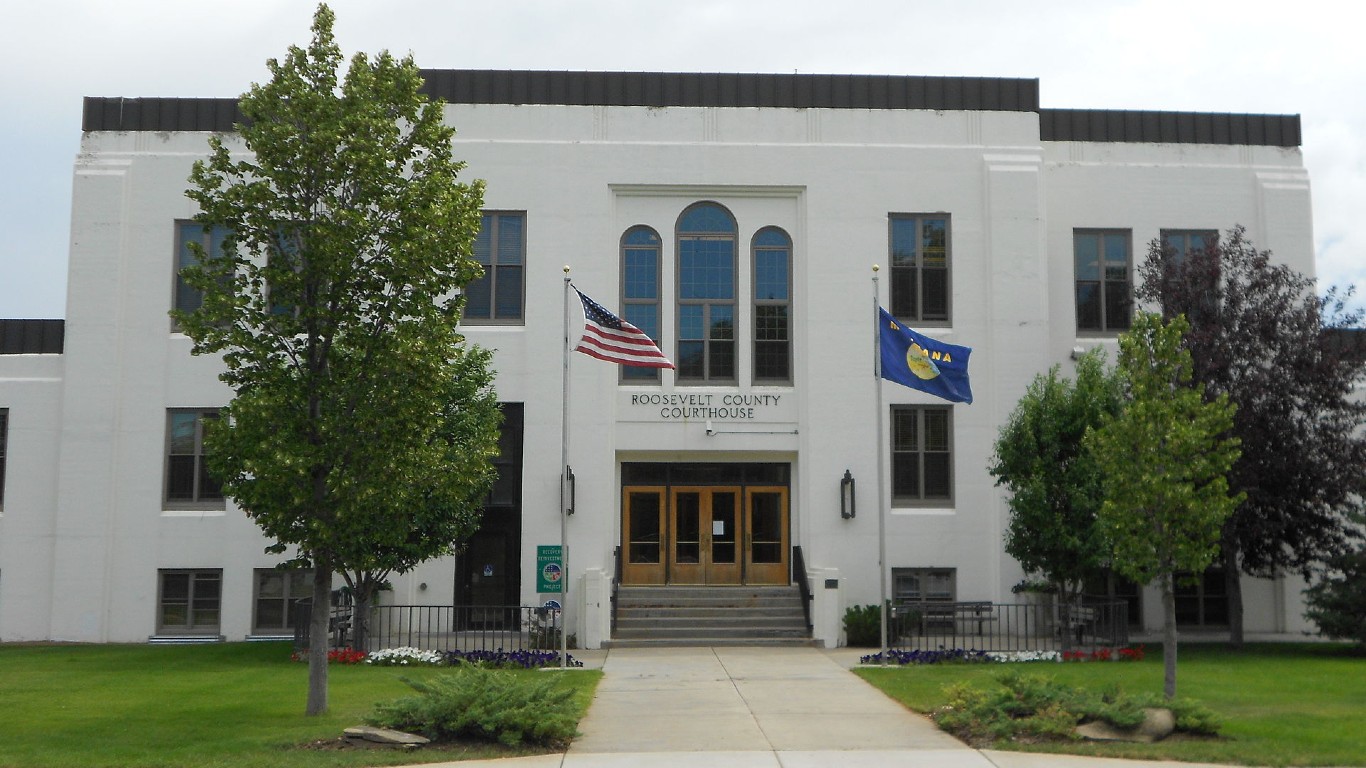
10. Roosevelt County, Montana
> Life expectancy at birth (years): 67.7
> Adults reporting poor or fair health: 25.4% — 507th highest of 3,070 counties
> Adult obesity rate: 38.9% — 531st highest of 3,070 counties
> Smoking rate: 31.3% — 34th highest of 3,070 counties
> Population without health insurance: 27.7% — 21st highest of 3,070 counties
> Median household income: $43,194 — 676th lowest of 3,070 counties
> Poverty rate: 28.3% — 111th highest of 3,070 counties
[in-text-ad]

9. Galax city, Virginia
> Life expectancy at birth (years): 67.6
> Adults reporting poor or fair health: 27.5% — 251st highest of 3,070 counties
> Adult obesity rate: 34.7% — 1,361st highest of 3,070 counties
> Smoking rate: 26.6% — 318th highest of 3,070 counties
> Population without health insurance: 16.2% — 308th highest of 3,070 counties
> Median household income: $33,575 — 121st lowest of 3,070 counties
> Poverty rate: 23.8% — 278th highest of 3,070 counties
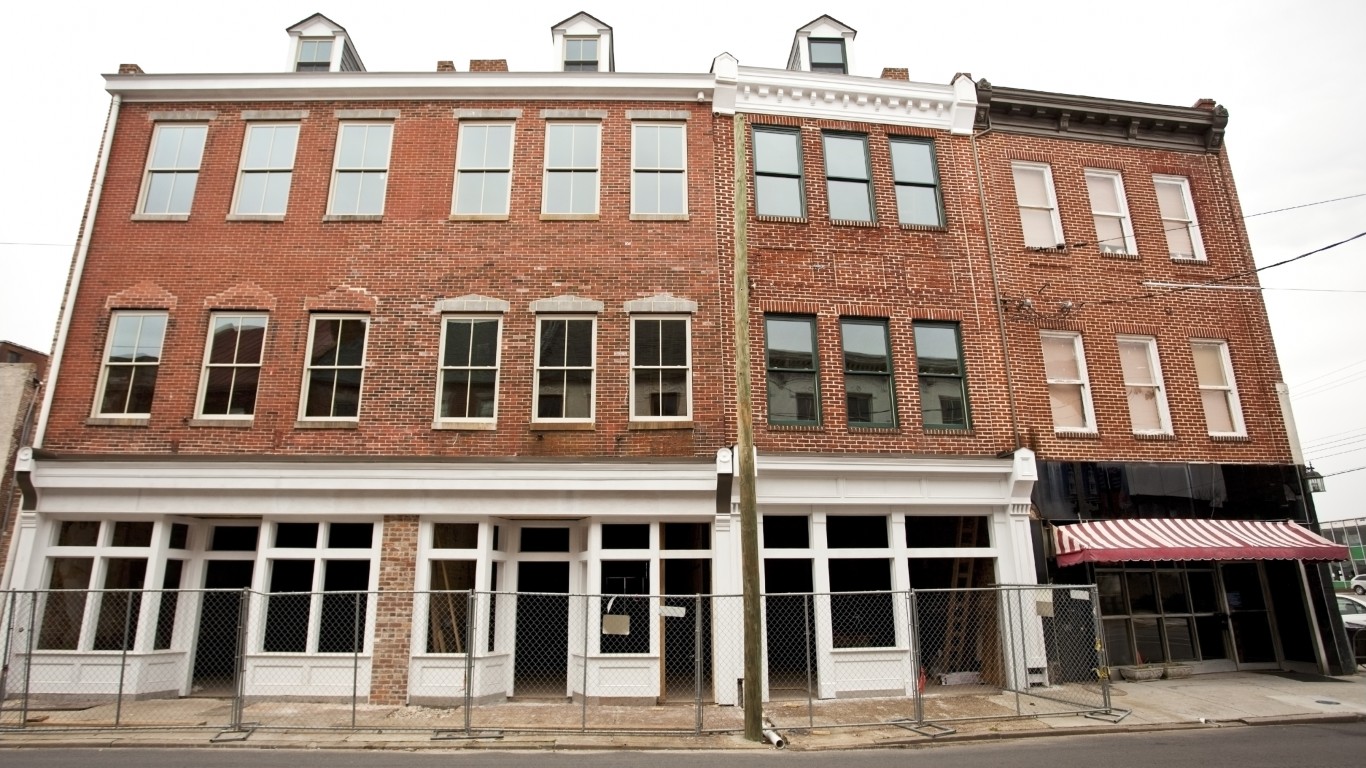
8. Petersburg city, Virginia
> Life expectancy at birth (years): 67.5
> Adults reporting poor or fair health: 28.2% — 192nd highest of 3,070 counties
> Adult obesity rate: 39.8% — 404th highest of 3,070 counties
> Smoking rate: 23.7% — 878th highest of 3,070 counties
> Population without health insurance: 12.4% — 726th highest of 3,070 counties
> Median household income: $38,679 — 344th lowest of 3,070 counties (tied)
> Poverty rate: 24.1% — 266th highest of 3,070 counties
7. Todd County, South Dakota
> Life expectancy at birth (years): 67.4
> Adults reporting poor or fair health: 34.8% — 27th highest of 3,070 counties
> Adult obesity rate: 40.4% — 338th highest of 3,070 counties
> Smoking rate: 40.3% — 3rd highest of 3,070 counties
> Population without health insurance: 30.2% — 16th highest of 3,070 counties
> Median household income: $24,331 — 7th lowest of 3,070 counties
> Poverty rate: 55.5% — the highest of 3,070 counties
[in-text-ad-2]
6. Kusilvak Census Area, Alaska
> Life expectancy at birth (years): 67.2
> Adults reporting poor or fair health: 41.9% — the highest of 3,070 counties
> Adult obesity rate: 23.1% — 128th lowest of 3,070 counties
> Smoking rate: 44.6% — the highest of 3,070 counties
> Population without health insurance: 19.9% — 110th highest of 3,070 counties
> Median household income: $36,754 — 228th lowest of 3,070 counties
> Poverty rate: 39.0% — 14th highest of 3,070 counties

5. Covington city, Virginia
> Life expectancy at birth (years): 67.1
> Adults reporting poor or fair health: 20.8% — 1,278th highest of 3,070 counties
> Adult obesity rate: 24.2% — 183rd lowest of 3,070 counties
> Smoking rate: 23.4% — 952nd highest of 3,070 counties
> Population without health insurance: 9.9% — 1,214th highest of 3,070 counties
> Median household income: $40,655 — 466th lowest of 3,070 counties
> Poverty rate: 13.2% — 1,302nd lowest of 3,070 counties
[in-text-ad]

4. Mellette County, South Dakota
> Life expectancy at birth (years): 67.0
> Adults reporting poor or fair health: 29.8% — 117th highest of 3,070 counties
> Adult obesity rate: 40.4% — 339th highest of 3,070 counties
> Smoking rate: 33.5% — 18th highest of 3,070 counties
> Population without health insurance: 34.3% — 7th highest of 3,070 counties
> Median household income: $30,650 — 64th lowest of 3,070 counties
> Poverty rate: 52.8% — 2nd highest of 3,070 counties
3. Corson County, South Dakota
> Life expectancy at birth (years): 65.2
> Adults reporting poor or fair health: 30.1% — 105th highest of 3,070 counties
> Adult obesity rate: 45.2% — 71st highest of 3,070 counties
> Smoking rate: 34.7% — 7th highest of 3,070 counties
> Population without health insurance: 23.7% — 46th highest of 3,070 counties
> Median household income: $35,759 — 185th lowest of 3,070 counties
> Poverty rate: 44.8% — 5th highest of 3,070 counties
2. Buffalo County, South Dakota
> Life expectancy at birth (years): 64.5
> Adults reporting poor or fair health: 34.6% — 30th highest of 3,070 counties
> Adult obesity rate: 50.4% — 11th highest of 3,070 counties
> Smoking rate: 37.6% — 4th highest of 3,070 counties
> Population without health insurance: 39.3% — 3rd highest of 3,070 counties
> Median household income: $34,808 — 156th lowest of 3,070 counties
> Poverty rate: 39.7% — 12th highest of 3,070 counties
[in-text-ad-2]
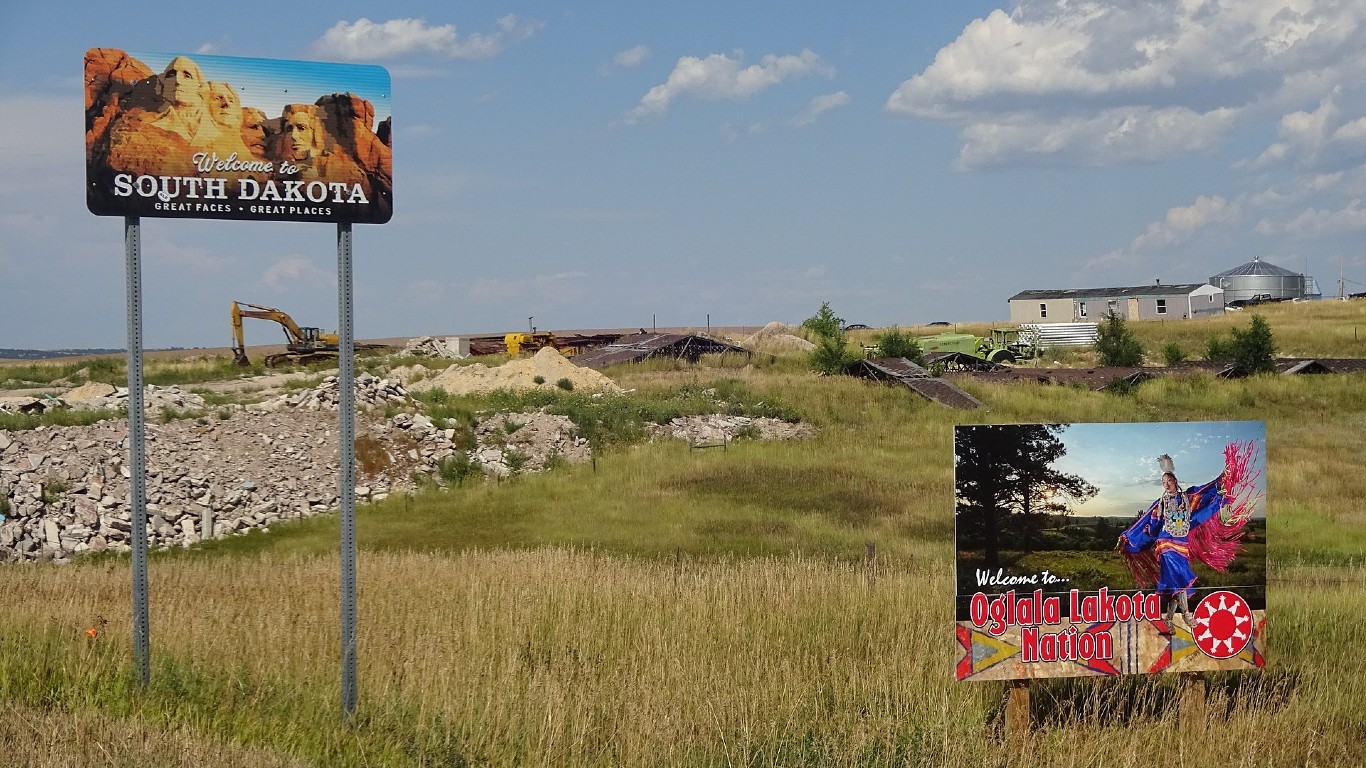
1. Oglala Lakota County, South Dakota
> Life expectancy at birth (years): 64.4
> Adults reporting poor or fair health: 34.9% — 25th highest of 3,070 counties
> Adult obesity rate: 40.4% — 334th highest of 3,070 counties
> Smoking rate: 40.9% — 2nd highest of 3,070 counties
> Population without health insurance: 36.5% — 5th highest of 3,070 counties
> Median household income: $31,997 — 88th lowest of 3,070 counties
> Poverty rate: 46.2% — 3rd highest of 3,070 counties
Methodology
To determine the counties with the shortest life expectancy, 24/7 Wall St. reviewed data on life expectancy — the average number of years a person can expect to live — from the Robert Wood Johnson Foundation and the University of Wisconsin Population Health Institute joint program’s 2021 County Health Rankings & Roadmaps report. While the CHR report is from 2021, life expectancy data published in the report are from 2017-2019.
Of the 3,220 counties or county equivalents, 3,142 had boundaries that fell within one of the 50 states or the District of Columbia. Counties were excluded if life expectancy data was unavailable, if the confidence interval for the estimate was deemed too large, or if the county’s 2019 five-year population estimate from the U.S. Census Bureau was less than 1,000.
The remaining 3,070 places were ranked based on life expectancy. Additional information on the share of adults reporting poor or fair health, the share of adults 20 years and older who report a body mass index of 30 kg/m2 or higher (adult obesity rate), and the share of adults who are current smokers are also from the 2021 CHR. The share of the civilian noninstitutionalized population without health insurance, median household income, and poverty rates are five-year estimates from the U.S. Census Bureau’s 2019 American Community Survey.
Are You Ahead, or Behind on Retirement? (sponsor)
If you’re one of the over 4 Million Americans set to retire this year, you may want to pay attention.
Finding a financial advisor who puts your interest first can be the difference between a rich retirement and barely getting by, and today it’s easier than ever. SmartAsset’s free tool matches you with up to three fiduciary financial advisors that serve your area in minutes. Each advisor has been carefully vetted, and must act in your best interests. Start your search now.
Don’t waste another minute; get started right here and help your retirement dreams become a retirement reality.
Thank you for reading! Have some feedback for us?
Contact the 24/7 Wall St. editorial team.

 24/7 Wall St.


