
Sleep is a key component of a healthy lifestyle. The Centers for Disease Control and Prevention recommends that adults get at least seven hours of sleep each night — and falling short of this target carries a number of risks. Still, nearly 90 million American adults are not getting enough sleep.
Americans who do not get enough sleep are at increased risk of making mistakes in their day-to-day lives — and mistakes at work or while driving can have serious consequences. Insufficient sleep is also linked to chronic diseases, including type 2 diabetes, heart disease, obesity, and depression.
Nationwide, 35.2% of adults are not getting enough sleep. But in some parts of the country, sleep deprivation is even more common.
Using data from County Health Rankings & Roadmaps, a Robert Wood Johnson Foundation and University of Wisconsin Population Health Institute joint program, 24/7 Tempo identified America’s 50 most sleep deprived metropolitan areas. Metro areas are ranked by the share of adults not getting enough sleep — which ranges on this list from 40.5% up to 47.1%.
Research has shown that sleep duration is linked to both regulation of blood sugar as well as metabolic changes — and that adults who regularly sleep less than seven hours a night are at increased risk of diabetes and obesity. In the vast majority of metro areas with the highest levels of sleep deprivation, rates of both diabetes and obesity are higher than the national shares of 10.5% and 29.7%, respectively. Here is a look at what happens to your body when you don’t get enough sleep.
To improve sleep habits, the CDC recommends developing a routine of going to bed at the same time each night and waking up at the same time every day. The CDC also advises regular exercise and avoiding caffeine, large meals, and alcohol before bed time. Removing electronic devices, such as TVs and computers, from the bedroom can also help improve sleep habits. Here is a list of 19 secrets to sleep better at night.
Click here to see America’s most sleep deprived metro areas
Click here to read our detailed methodology

50. Dayton-Kettering, OH
> Adults reporting insufficient sleep (<7 hours): 40.5%
> Adults reporting poor or fair health: 18.5% — 189th lowest of 384 metros
> Avg. number of mentally unhealthy days reported in past month: 4.9 — 91st highest of 384 metros
> Adult obesity rate: 34.7% — 112th highest of 384 metros
> Adults with diabetes: 12.8% — 89th highest of 384 metros
[in-text-ad]

49. Beaumont-Port Arthur, TX
> Adults reporting insufficient sleep (<7 hours): 40.5%
> Adults reporting poor or fair health: 22.2% — 56th highest of 384 metros
> Avg. number of mentally unhealthy days reported in past month: 4.6 — 190th lowest of 384 metros
> Adult obesity rate: 41.5% — 5th highest of 384 metros
> Adults with diabetes: 13.6% — 58th highest of 384 metros

48. Toledo, OH
> Adults reporting insufficient sleep (<7 hours): 40.6%
> Adults reporting poor or fair health: 19.4% — 154th highest of 384 metros
> Avg. number of mentally unhealthy days reported in past month: 5.1 — 58th highest of 384 metros
> Adult obesity rate: 36.3% — 72nd highest of 384 metros
> Adults with diabetes: 12.4% — 109th highest of 384 metros

47. Kingsport-Bristol, TN-VA
> Adults reporting insufficient sleep (<7 hours): 40.6%
> Adults reporting poor or fair health: 21.8% — 70th highest of 384 metros
> Avg. number of mentally unhealthy days reported in past month: 5.5 — 8th highest of 384 metros
> Adult obesity rate: 32.3% — 179th highest of 384 metros
> Adults with diabetes: 15.0% — 33rd highest of 384 metros
[in-text-ad-2]

46. Pensacola-Ferry Pass-Brent, FL
> Adults reporting insufficient sleep (<7 hours): 40.6%
> Adults reporting poor or fair health: 18.6% — 191st highest of 384 metros
> Avg. number of mentally unhealthy days reported in past month: 4.9 — 103rd highest of 384 metros
> Adult obesity rate: 30.0% — 122nd lowest of 384 metros
> Adults with diabetes: 12.5% — 101st highest of 384 metros

45. Atlantic City-Hammonton, NJ
> Adults reporting insufficient sleep (<7 hours): 40.6%
> Adults reporting poor or fair health: 18.7% — 186th highest of 384 metros
> Avg. number of mentally unhealthy days reported in past month: 4.7 — 152nd highest of 384 metros
> Adult obesity rate: 32.5% — 172nd highest of 384 metros
> Adults with diabetes: 13.2% — 70th highest of 384 metros
[in-text-ad]

44. Palm Bay-Melbourne-Titusville, FL
> Adults reporting insufficient sleep (<7 hours): 40.7%
> Adults reporting poor or fair health: 18.6% — 191st lowest of 384 metros
> Avg. number of mentally unhealthy days reported in past month: 5.0 — 78th highest of 384 metros
> Adult obesity rate: 28.8% — 93rd lowest of 384 metros
> Adults with diabetes: 13.1% — 75th highest of 384 metros

43. East Stroudsburg, PA
> Adults reporting insufficient sleep (<7 hours): 40.7%
> Adults reporting poor or fair health: 18.6% — 190th highest of 384 metros
> Avg. number of mentally unhealthy days reported in past month: 4.9 — 84th highest of 384 metros
> Adult obesity rate: 33.1% — 159th highest of 384 metros
> Adults with diabetes: 10.6% — 175th lowest of 384 metros

42. Warner Robins, GA
> Adults reporting insufficient sleep (<7 hours): 40.8%
> Adults reporting poor or fair health: 19.7% — 138th highest of 384 metros
> Avg. number of mentally unhealthy days reported in past month: 4.5 — 158th lowest of 384 metros
> Adult obesity rate: 38.2% — 35th highest of 384 metros
> Adults with diabetes: 14.8% — 38th highest of 384 metros
[in-text-ad-2]

41. Wheeling, WV-OH
> Adults reporting insufficient sleep (<7 hours): 40.8%
> Adults reporting poor or fair health: 19.9% — 130th highest of 384 metros
> Avg. number of mentally unhealthy days reported in past month: 5.4 — 15th highest of 384 metros
> Adult obesity rate: 35.6% — 84th highest of 384 metros
> Adults with diabetes: 14.6% — 43rd highest of 384 metros

40. Muskegon, MI
> Adults reporting insufficient sleep (<7 hours): 40.8%
> Adults reporting poor or fair health: 20.1% — 124th highest of 384 metros
> Avg. number of mentally unhealthy days reported in past month: 5.2 — 38th highest of 384 metros
> Adult obesity rate: 36.6% — 63rd highest of 384 metros
> Adults with diabetes: 13.9% — 55th highest of 384 metros
[in-text-ad]

39. Johnson City, TN
> Adults reporting insufficient sleep (<7 hours): 40.9%
> Adults reporting poor or fair health: 21.8% — 68th highest of 384 metros
> Avg. number of mentally unhealthy days reported in past month: 5.4 — 11th highest of 384 metros
> Adult obesity rate: 34.5% — 115th highest of 384 metros
> Adults with diabetes: 14.9% — 36th highest of 384 metros

38. Sumter, SC
> Adults reporting insufficient sleep (<7 hours): 40.9%
> Adults reporting poor or fair health: 21.9% — 67th highest of 384 metros
> Avg. number of mentally unhealthy days reported in past month: 4.8 — 137th highest of 384 metros
> Adult obesity rate: 40.3% — 7th highest of 384 metros
> Adults with diabetes: 14.4% — 46th highest of 384 metros
37. Utica-Rome, NY
> Adults reporting insufficient sleep (<7 hours): 40.9%
> Adults reporting poor or fair health: 18.2% — 175th lowest of 384 metros
> Avg. number of mentally unhealthy days reported in past month: 4.5 — 161st lowest of 384 metros
> Adult obesity rate: 33.5% — 144th highest of 384 metros
> Adults with diabetes: 13.5% — 60th highest of 384 metros
[in-text-ad-2]

36. Parkersburg-Vienna, WV
> Adults reporting insufficient sleep (<7 hours): 41.0%
> Adults reporting poor or fair health: 23.1% — 39th highest of 384 metros
> Avg. number of mentally unhealthy days reported in past month: 5.7 — 3rd highest of 384 metros
> Adult obesity rate: 39.4% — 19th highest of 384 metros
> Adults with diabetes: 17.8% — 4th highest of 384 metros

35. Flint, MI
> Adults reporting insufficient sleep (<7 hours): 41.0%
> Adults reporting poor or fair health: 20.2% — 118th highest of 384 metros
> Avg. number of mentally unhealthy days reported in past month: 4.9 — 97th highest of 384 metros
> Adult obesity rate: 35.8% — 82nd highest of 384 metros
> Adults with diabetes: 13.2% — 71st highest of 384 metros
[in-text-ad]

34. Morgantown, WV
> Adults reporting insufficient sleep (<7 hours): 41.1%
> Adults reporting poor or fair health: 20.8% — 99th highest of 384 metros
> Avg. number of mentally unhealthy days reported in past month: 5.5 — 9th highest of 384 metros
> Adult obesity rate: 31.8% — 189th lowest of 384 metros
> Adults with diabetes: 11.1% — 181st highest of 384 metros

33. Florence, SC
> Adults reporting insufficient sleep (<7 hours): 41.3%
> Adults reporting poor or fair health: 21.5% — 78th highest of 384 metros
> Avg. number of mentally unhealthy days reported in past month: 4.8 — 116th highest of 384 metros
> Adult obesity rate: 38.4% — 31st highest of 384 metros
> Adults with diabetes: 16.8% — 10th highest of 384 metros

32. Johnstown, PA
> Adults reporting insufficient sleep (<7 hours): 41.3%
> Adults reporting poor or fair health: 18.7% — 184th highest of 384 metros
> Avg. number of mentally unhealthy days reported in past month: 5.1 — 55th highest of 384 metros
> Adult obesity rate: 29.4% — 109th lowest of 384 metros
> Adults with diabetes: 15.5% — 22nd highest of 384 metros
[in-text-ad-2]

31. Owensboro, KY
> Adults reporting insufficient sleep (<7 hours): 41.4%
> Adults reporting poor or fair health: 21.4% — 81st highest of 384 metros
> Avg. number of mentally unhealthy days reported in past month: 5.4 — 17th highest of 384 metros
> Adult obesity rate: 30.2% — 135th lowest of 384 metros
> Adults with diabetes: 13.6% — 59th highest of 384 metros

30. Montgomery, AL
> Adults reporting insufficient sleep (<7 hours): 41.4%
> Adults reporting poor or fair health: 22.1% — 62nd highest of 384 metros
> Avg. number of mentally unhealthy days reported in past month: 4.9 — 95th highest of 384 metros
> Adult obesity rate: 36.2% — 75th highest of 384 metros
> Adults with diabetes: 15.5% — 24th highest of 384 metros
[in-text-ad]

29. Scranton–Wilkes-Barre, PA
> Adults reporting insufficient sleep (<7 hours): 41.4%
> Adults reporting poor or fair health: 19.3% — 161st highest of 384 metros
> Avg. number of mentally unhealthy days reported in past month: 5.1 — 49th highest of 384 metros
> Adult obesity rate: 31.4% — 173rd lowest of 384 metros
> Adults with diabetes: 11.5% — 167th highest of 384 metros

28. Spartanburg, SC
> Adults reporting insufficient sleep (<7 hours): 41.4%
> Adults reporting poor or fair health: 18.9% — 177th highest of 384 metros
> Avg. number of mentally unhealthy days reported in past month: 5.1 — 52nd highest of 384 metros
> Adult obesity rate: 35.5% — 86th highest of 384 metros
> Adults with diabetes: 12.9% — 88th highest of 384 metros

27. Cumberland, MD-WV
> Adults reporting insufficient sleep (<7 hours): 41.4%
> Adults reporting poor or fair health: 20.3% — 113th highest of 384 metros
> Avg. number of mentally unhealthy days reported in past month: 5.3 — 28th highest of 384 metros
> Adult obesity rate: 35.2% — 95th highest of 384 metros
> Adults with diabetes: 14.1% — 52nd highest of 384 metros
[in-text-ad-2]

26. Fayetteville, NC
> Adults reporting insufficient sleep (<7 hours): 41.5%
> Adults reporting poor or fair health: 22.2% — 57th highest of 384 metros
> Avg. number of mentally unhealthy days reported in past month: 4.5 — 162nd lowest of 384 metros
> Adult obesity rate: 32.6% — 167th highest of 384 metros
> Adults with diabetes: 12.0% — 130th highest of 384 metros
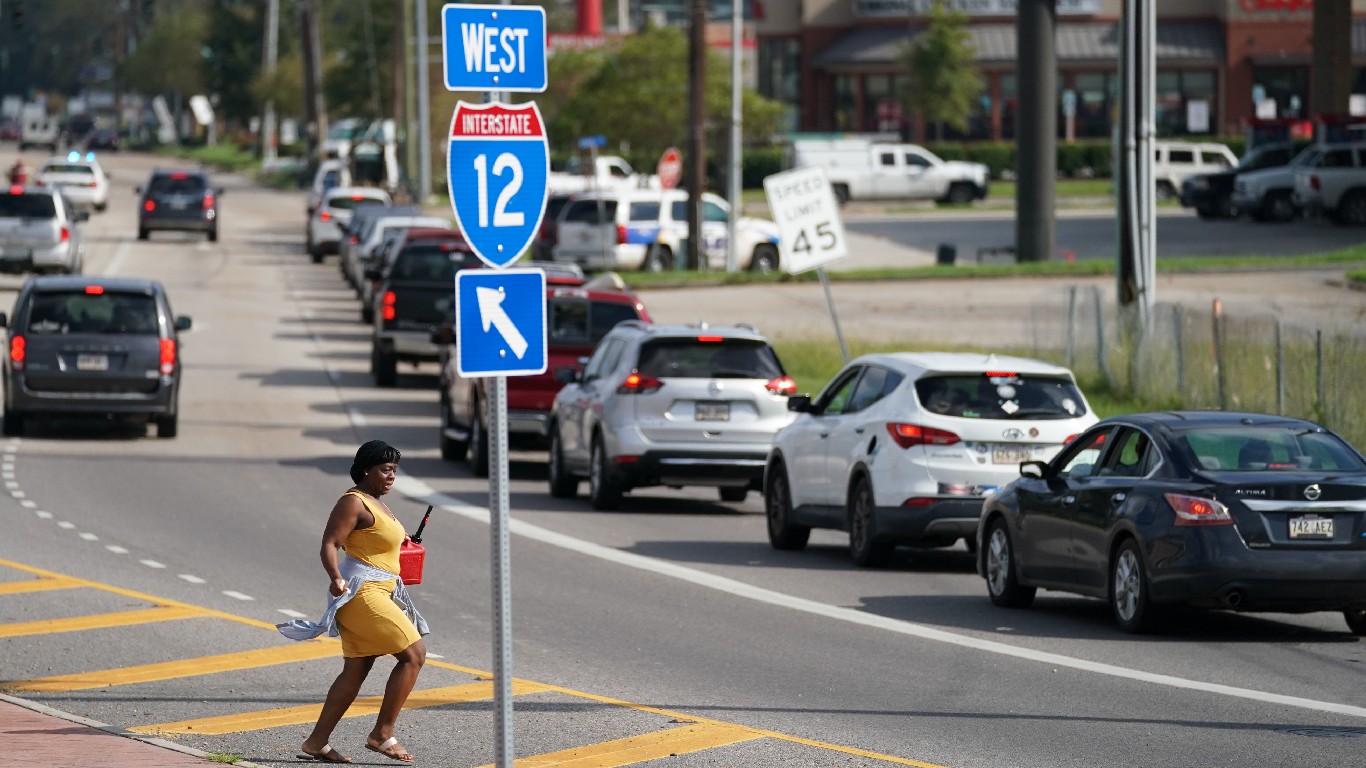
25. Hammond, LA
> Adults reporting insufficient sleep (<7 hours): 41.6%
> Adults reporting poor or fair health: 23.1% — 38th highest of 384 metros
> Avg. number of mentally unhealthy days reported in past month: 5.3 — 24th highest of 384 metros
> Adult obesity rate: 40.3% — 8th highest of 384 metros
> Adults with diabetes: 11.7% — 152nd highest of 384 metros
[in-text-ad]
24. Weirton-Steubenville, WV-OH
> Adults reporting insufficient sleep (<7 hours): 41.7%
> Adults reporting poor or fair health: 20.9% — 96th highest of 384 metros
> Avg. number of mentally unhealthy days reported in past month: 5.4 — 12th highest of 384 metros
> Adult obesity rate: 38.4% — 30th highest of 384 metros
> Adults with diabetes: 15.3% — 27th highest of 384 metros

23. Lawton, OK
> Adults reporting insufficient sleep (<7 hours): 41.7%
> Adults reporting poor or fair health: 22.2% — 58th highest of 384 metros
> Avg. number of mentally unhealthy days reported in past month: 5.1 — 46th highest of 384 metros
> Adult obesity rate: 32.9% — 163rd highest of 384 metros
> Adults with diabetes: 11.8% — 147th highest of 384 metros

22. Lake Charles, LA
> Adults reporting insufficient sleep (<7 hours): 41.7%
> Adults reporting poor or fair health: 20.8% — 100th highest of 384 metros
> Avg. number of mentally unhealthy days reported in past month: 5.0 — 69th highest of 384 metros
> Adult obesity rate: 35.8% — 80th highest of 384 metros
> Adults with diabetes: 11.8% — 149th highest of 384 metros
[in-text-ad-2]

21. Jackson, TN
> Adults reporting insufficient sleep (<7 hours): 41.8%
> Adults reporting poor or fair health: 23.7% — 26th highest of 384 metros
> Avg. number of mentally unhealthy days reported in past month: 5.4 — 13th highest of 384 metros
> Adult obesity rate: 40.1% — 9th highest of 384 metros
> Adults with diabetes: 15.6% — 19th highest of 384 metros

20. Lima, OH
> Adults reporting insufficient sleep (<7 hours): 41.9%
> Adults reporting poor or fair health: 19.5% — 151st highest of 384 metros
> Avg. number of mentally unhealthy days reported in past month: 5.0 — 60th highest of 384 metros
> Adult obesity rate: 35.9% — 78th highest of 384 metros
> Adults with diabetes: 13.4% — 63rd highest of 384 metros
[in-text-ad]

19. Tuscaloosa, AL
> Adults reporting insufficient sleep (<7 hours): 41.9%
> Adults reporting poor or fair health: 22.4% — 51st highest of 384 metros
> Avg. number of mentally unhealthy days reported in past month: 5.0 — 62nd highest of 384 metros
> Adult obesity rate: 36.9% — 60th highest of 384 metros
> Adults with diabetes: 13.1% — 74th highest of 384 metros
18. Niles, MI
> Adults reporting insufficient sleep (<7 hours): 41.9%
> Adults reporting poor or fair health: 19.0% — 173rd highest of 384 metros
> Avg. number of mentally unhealthy days reported in past month: 4.9 — 102nd highest of 384 metros
> Adult obesity rate: 34.3% — 121st highest of 384 metros
> Adults with diabetes: 11.5% — 165th highest of 384 metros

17. Charleston, WV
> Adults reporting insufficient sleep (<7 hours): 42.0%
> Adults reporting poor or fair health: 22.9% — 43rd highest of 384 metros
> Avg. number of mentally unhealthy days reported in past month: 5.9 — 2nd highest of 384 metros
> Adult obesity rate: 38.3% — 32nd highest of 384 metros
> Adults with diabetes: 16.3% — 16th highest of 384 metros
[in-text-ad-2]

16. Albany, GA
> Adults reporting insufficient sleep (<7 hours): 42.0%
> Adults reporting poor or fair health: 24.2% — 19th highest of 384 metros
> Avg. number of mentally unhealthy days reported in past month: 4.8 — 113th highest of 384 metros
> Adult obesity rate: 39.7% — 11th highest of 384 metros
> Adults with diabetes: 17.2% — 7th highest of 384 metros

15. Cleveland-Elyria, OH
> Adults reporting insufficient sleep (<7 hours): 42.3%
> Adults reporting poor or fair health: 17.9% — 167th lowest of 384 metros
> Avg. number of mentally unhealthy days reported in past month: 4.8 — 126th highest of 384 metros
> Adult obesity rate: 31.3% — 170th lowest of 384 metros
> Adults with diabetes: 11.5% — 161st highest of 384 metros
[in-text-ad]

14. Macon-Bibb County, GA
> Adults reporting insufficient sleep (<7 hours): 42.4%
> Adults reporting poor or fair health: 22.2% — 60th highest of 384 metros
> Avg. number of mentally unhealthy days reported in past month: 4.7 — 169th highest of 384 metros
> Adult obesity rate: 38.5% — 28th highest of 384 metros
> Adults with diabetes: 18.6% — the highest of 384 metros
13. Vineland-Bridgeton, NJ
> Adults reporting insufficient sleep (<7 hours): 42.6%
> Adults reporting poor or fair health: 25.2% — 17th highest of 384 metros
> Avg. number of mentally unhealthy days reported in past month: 4.9 — 88th highest of 384 metros
> Adult obesity rate: 36.5% — 64th highest of 384 metros
> Adults with diabetes: 12.7% — 96th highest of 384 metros
12. Springfield, OH
> Adults reporting insufficient sleep (<7 hours): 42.7%
> Adults reporting poor or fair health: 20.9% — 98th highest of 384 metros
> Avg. number of mentally unhealthy days reported in past month: 5.2 — 34th highest of 384 metros
> Adult obesity rate: 37.0% — 55th highest of 384 metros
> Adults with diabetes: 14.1% — 51st highest of 384 metros
[in-text-ad-2]

11. Columbus, GA-AL
> Adults reporting insufficient sleep (<7 hours): 42.9%
> Adults reporting poor or fair health: 21.0% — 92nd highest of 384 metros
> Avg. number of mentally unhealthy days reported in past month: 4.8 — 135th highest of 384 metros
> Adult obesity rate: 37.2% — 51st highest of 384 metros
> Adults with diabetes: 15.1% — 32nd highest of 384 metros

10. Homosassa Springs, FL
> Adults reporting insufficient sleep (<7 hours): 42.9%
> Adults reporting poor or fair health: 19.8% — 136th highest of 384 metros
> Avg. number of mentally unhealthy days reported in past month: 5.3 — 19th highest of 384 metros
> Adult obesity rate: 28.7% — 92nd lowest of 384 metros
> Adults with diabetes: 13.3% — 66th highest of 384 metros
[in-text-ad]
9. Hinesville, GA
> Adults reporting insufficient sleep (<7 hours): 43.0%
> Adults reporting poor or fair health: 22.3% — 55th highest of 384 metros
> Avg. number of mentally unhealthy days reported in past month: 4.6 — 188th highest of 384 metros
> Adult obesity rate: 36.5% — 66th highest of 384 metros
> Adults with diabetes: 12.4% — 116th highest of 384 metros

8. Clarksville, TN-KY
> Adults reporting insufficient sleep (<7 hours): 43.0%
> Adults reporting poor or fair health: 22.3% — 53rd highest of 384 metros
> Avg. number of mentally unhealthy days reported in past month: 5.1 — 43rd highest of 384 metros
> Adult obesity rate: 36.3% — 71st highest of 384 metros
> Adults with diabetes: 12.4% — 113th highest of 384 metros

7. Elizabethtown-Fort Knox, KY
> Adults reporting insufficient sleep (<7 hours): 43.1%
> Adults reporting poor or fair health: 21.7% — 74th highest of 384 metros
> Avg. number of mentally unhealthy days reported in past month: 5.1 — 51st highest of 384 metros
> Adult obesity rate: 38.8% — 24th highest of 384 metros
> Adults with diabetes: 12.1% — 125th highest of 384 metros
[in-text-ad-2]

6. Youngstown-Warren-Boardman, OH-PA
> Adults reporting insufficient sleep (<7 hours): 43.2%
> Adults reporting poor or fair health: 20.0% — 126th highest of 384 metros
> Avg. number of mentally unhealthy days reported in past month: 5.2 — 35th highest of 384 metros
> Adult obesity rate: 36.2% — 74th highest of 384 metros
> Adults with diabetes: 13.4% — 64th highest of 384 metros
5. Huntington-Ashland, WV-KY-OH
> Adults reporting insufficient sleep (<7 hours): 43.4%
> Adults reporting poor or fair health: 23.2% — 36th highest of 384 metros
> Avg. number of mentally unhealthy days reported in past month: 5.7 — 4th highest of 384 metros
> Adult obesity rate: 39.6% — 17th highest of 384 metros
> Adults with diabetes: 15.5% — 21st highest of 384 metros
[in-text-ad]

4. Morristown, TN
> Adults reporting insufficient sleep (<7 hours): 43.4%
> Adults reporting poor or fair health: 24.1% — 20th highest of 384 metros
> Avg. number of mentally unhealthy days reported in past month: 5.7 — 6th highest of 384 metros
> Adult obesity rate: 38.1% — 37th highest of 384 metros
> Adults with diabetes: 14.9% — 35th highest of 384 metros

3. Memphis, TN-MS-AR
> Adults reporting insufficient sleep (<7 hours): 43.7%
> Adults reporting poor or fair health: 22.8% — 44th highest of 384 metros
> Avg. number of mentally unhealthy days reported in past month: 5.1 — 50th highest of 384 metros
> Adult obesity rate: 36.3% — 70th highest of 384 metros
> Adults with diabetes: 12.5% — 100th highest of 384 metros

2. Beckley, WV
> Adults reporting insufficient sleep (<7 hours): 45.5%
> Adults reporting poor or fair health: 25.6% — 15th highest of 384 metros
> Avg. number of mentally unhealthy days reported in past month: 6.2 — the highest of 384 metros
> Adult obesity rate: 38.9% — 23rd highest of 384 metros
> Adults with diabetes: 17.9% — 3rd highest of 384 metros
[in-text-ad-2]

1. Urban Honolulu, HI
> Adults reporting insufficient sleep (<7 hours): 47.1%
> Adults reporting poor or fair health: 17.0% — 133rd lowest of 384 metros
> Avg. number of mentally unhealthy days reported in past month: 3.6 — 10th lowest of 384 metros
> Adult obesity rate: 24.4% — 29th lowest of 384 metros
> Adults with diabetes: 11.3% — 174th highest of 384 metros
To determine America’s most sleep deprived metros, 24/7 Tempo reviewed the share of adults reporting fewer than seven hours of sleep on average from the Robert Wood Johnson Foundation and the University of Wisconsin Population Health Institute joint program’s 2021 County Health Rankings & Roadmaps report. While the CHR report is from 2021, insufficient sleep figures published in the report are from 2018.
We used the 384 metropolitan statistical areas as delineated by the United States Office of Management and Budget and used by the Census Bureau as our definition of metros.
Metros were ranked based on the share of adults reporting insufficient sleep. Additional information on the share of adults reporting poor or fair health, the average number of mentally unhealthy days reported in the past 30 days, adults 20 years and older who report a body mass index of 30 kg/m2 or higher (adult obesity rate), and the share of adults 20 years and older with diagnosed diabetes are also from the 2021 CHR.
In 20 Years, I Haven’t Seen A Cash Back Card This Good
After two decades of reviewing financial products I haven’t seen anything like this. Credit card companies are at war, handing out free rewards and benefits to win the best customers.
A good cash back card can be worth thousands of dollars a year in free money, not to mention other perks like travel, insurance, and access to fancy lounges.
Our top pick today pays up to 5% cash back, a $200 bonus on top, and $0 annual fee. Click here to apply before they stop offering rewards this generous.
Flywheel Publishing has partnered with CardRatings for our coverage of credit card products. Flywheel Publishing and CardRatings may receive a commission from card issuers.
Thank you for reading! Have some feedback for us?
Contact the 24/7 Wall St. editorial team.
 24/7 Wall St.
 24/7 Wall St.
 24/7 Wall St.
 24/7 Wall St.




 24/7 Wall St.

