It has now been 55 weeks since the first shipments of the COVID-19 vaccine were sent out to states, kicking off the largest vaccination campaign in human history. As of January 6, 632,575,655 doses of the vaccine have been sent out across the country — equivalent to 192.7% of the U.S. population.
While the initial distribution of the vaccine took longer than federal projections had indicated, in recent months the U.S. has made great leaps in the worldwide race to administer vaccinations — and some states are faring far better than others. Under the current system, led by the White House COVID-19 Response Team, the Centers for Disease Control and Prevention sends states limited shipments of the vaccine as well as funding and tasks them with distributing the vaccine in accordance with relatively loose federal guidelines.
Each state has developed its own rollout plan, prioritizing different age groups and classes of essential workers. The mix of policies and logistical challenges across the country has led to wide variations between states in the percentage of vaccines that have been administered.
While nationwide 81.4% of distributed vaccine doses have been administered as of January 6, in Wisconsin 89.9% of vaccine doses have been administered — the largest share of any state. In Alabama, 67.9% of vaccine doses have been administered, the smallest share of any state.
Differences in vaccine administration from state to state have also led to variations in the percentage of the population that has been vaccinated. In Vermont, the number of administered doses amounts to 203.0% of the population — greater than the national vaccination rate of 156.9% and the largest share of any state. In Idaho, the number of administered doses amounts to 114.2% of the population — the smallest share of any state.
While a majority of Americans remain unvaccinated due to a lack of supply, there are some who have no plans to receive a vaccine at all. According to a survey from the U.S. Census Bureau, 59.2% of U.S. adults 18 and over who have not yet received the vaccine will either probably not or definitely not get a COVID-19 vaccine in the future. The most common reason cited for not wanting a vaccine was being concerned about possible side effects. Other commonly cited reasons include not trusting COVID-19 vaccines, not trusting the government, and that they were planning to wait and see if it is safe.
To determine how states are doing with the vaccine rollout, 24/7 Wall St. reviewed data from the Centers for Disease Control and Prevention. States were ranked based on the number of vaccines administered within a state as a percentage of the number of vaccines distributed to that state by the federal government as of January 6. Data on confirmed COVID-19 cases as of January 6 came from various state and local health departments and were adjusted for population using data from the U.S. Census Bureau’s 2019 American Community Survey. Data on the percentage of adults who probably or definitely will not get a COVID-19 vaccine and their reasons for not getting one came from the Census Bureau’s Household Pulse Survey, conducted from August 18, 2021 to August 30, 2021.
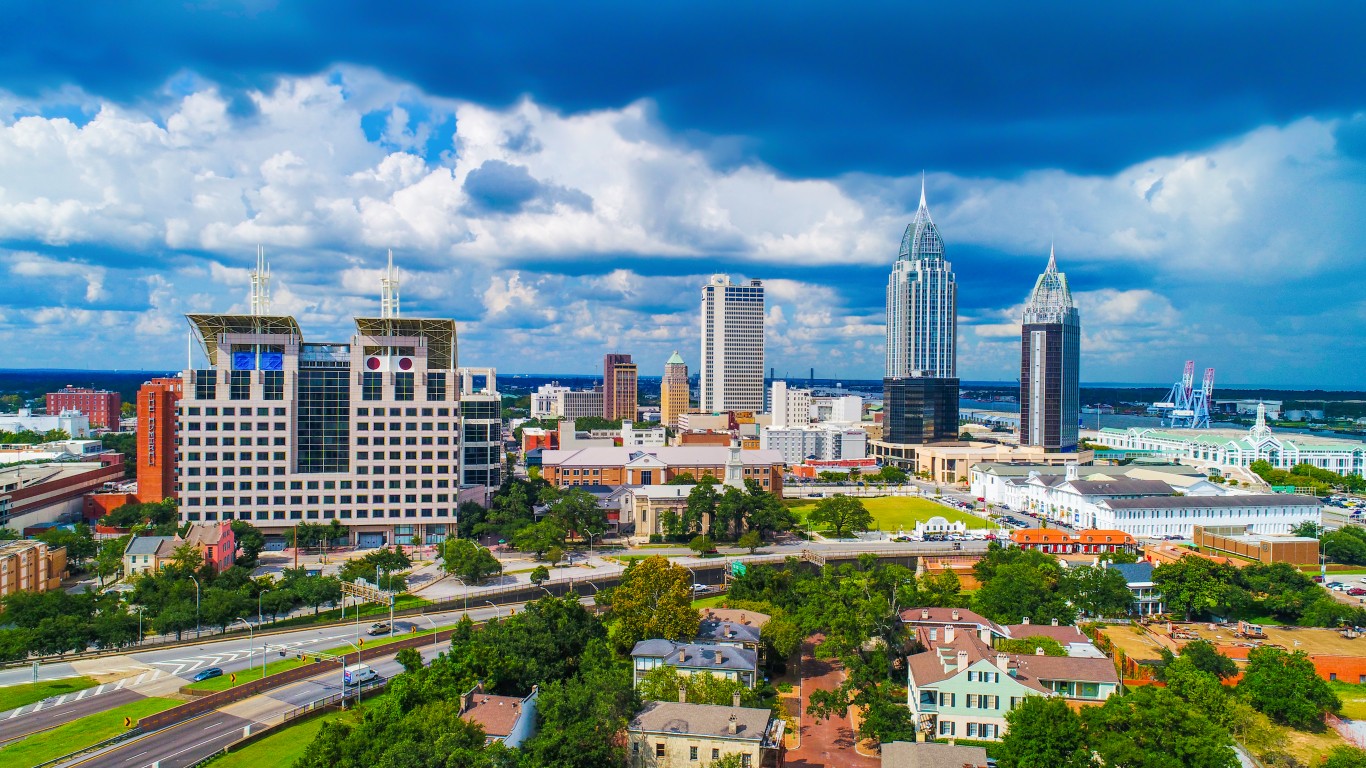
50. Alabama
> Total vaccines distributed to state: 8,391,130
> Total vaccines administered within state: 5,695,747
> Pct. of distributed vaccines administered: 67.9%
> Confirmed COVID-19 cases: 19,013 per 100,000
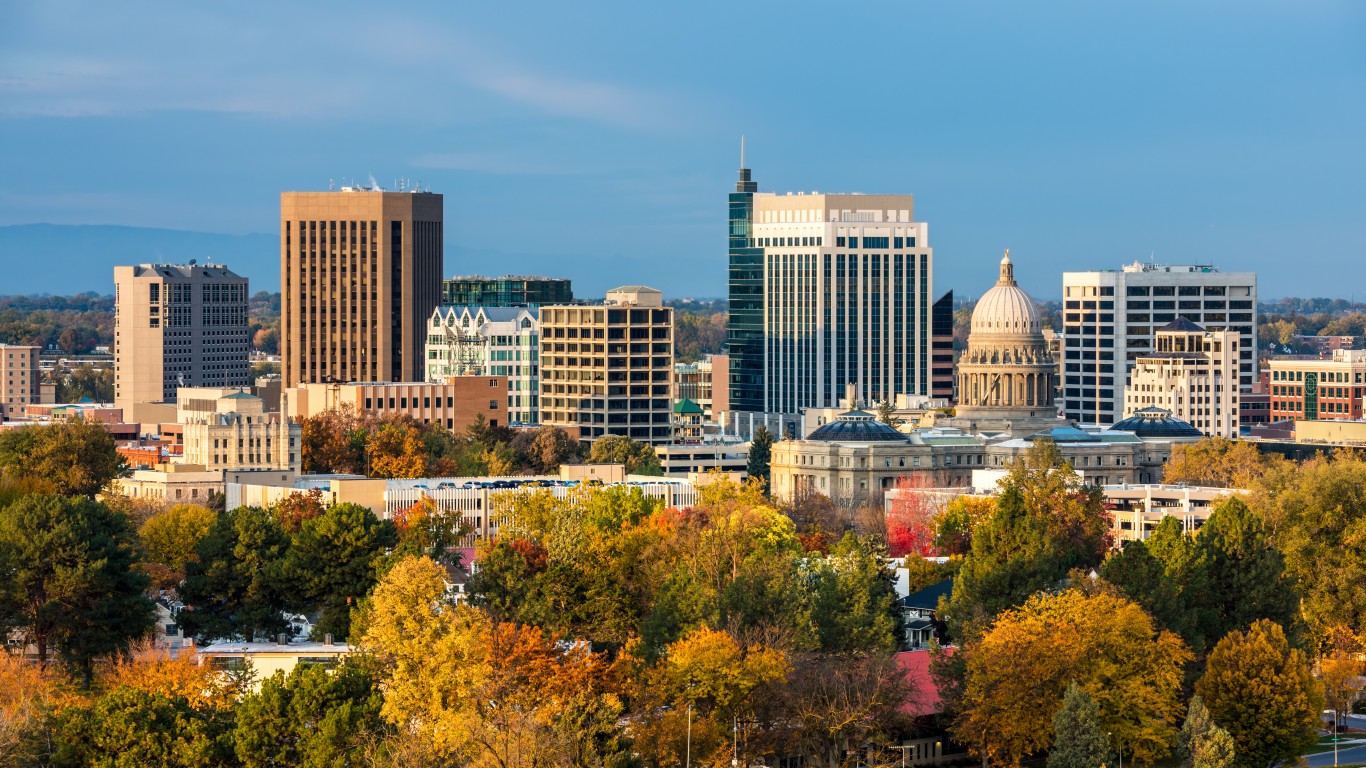
49. Idaho
> Total vaccines distributed to state: 2,979,370
> Total vaccines administered within state: 2,040,976
> Pct. of distributed vaccines administered: 68.5%
> Confirmed COVID-19 cases: 18,048 per 100,000
These are all the counties in Idaho where COVID-19 is slowing (and where it’s still getting worse).

48. West Virginia
> Total vaccines distributed to state: 3,589,025
> Total vaccines administered within state: 2,517,331
> Pct. of distributed vaccines administered: 70.1%
> Confirmed COVID-19 cases: 18,954 per 100,000

47. Georgia
> Total vaccines distributed to state: 18,890,595
> Total vaccines administered within state: 13,523,352
> Pct. of distributed vaccines administered: 71.6%
> Confirmed COVID-19 cases: 17,941 per 100,000

46. Mississippi
> Total vaccines distributed to state: 4,798,705
> Total vaccines administered within state: 3,515,156
> Pct. of distributed vaccines administered: 73.3%
> Confirmed COVID-19 cases: 19,021 per 100,000

45. Arkansas
> Total vaccines distributed to state: 5,216,470
> Total vaccines administered within state: 3,847,782
> Pct. of distributed vaccines administered: 73.8%
> Confirmed COVID-19 cases: 19,257 per 100,000

44. South Carolina
> Total vaccines distributed to state: 9,122,215
> Total vaccines administered within state: 6,805,135
> Pct. of distributed vaccines administered: 74.6%
> Confirmed COVID-19 cases: 19,645 per 100,000

43. Hawaii
> Total vaccines distributed to state: 3,033,250
> Total vaccines administered within state: 2,280,397
> Pct. of distributed vaccines administered: 75.2%
> Confirmed COVID-19 cases: 8,463 per 100,000
These are all the counties in Hawaii where COVID-19 is slowing (and where it’s still getting worse).
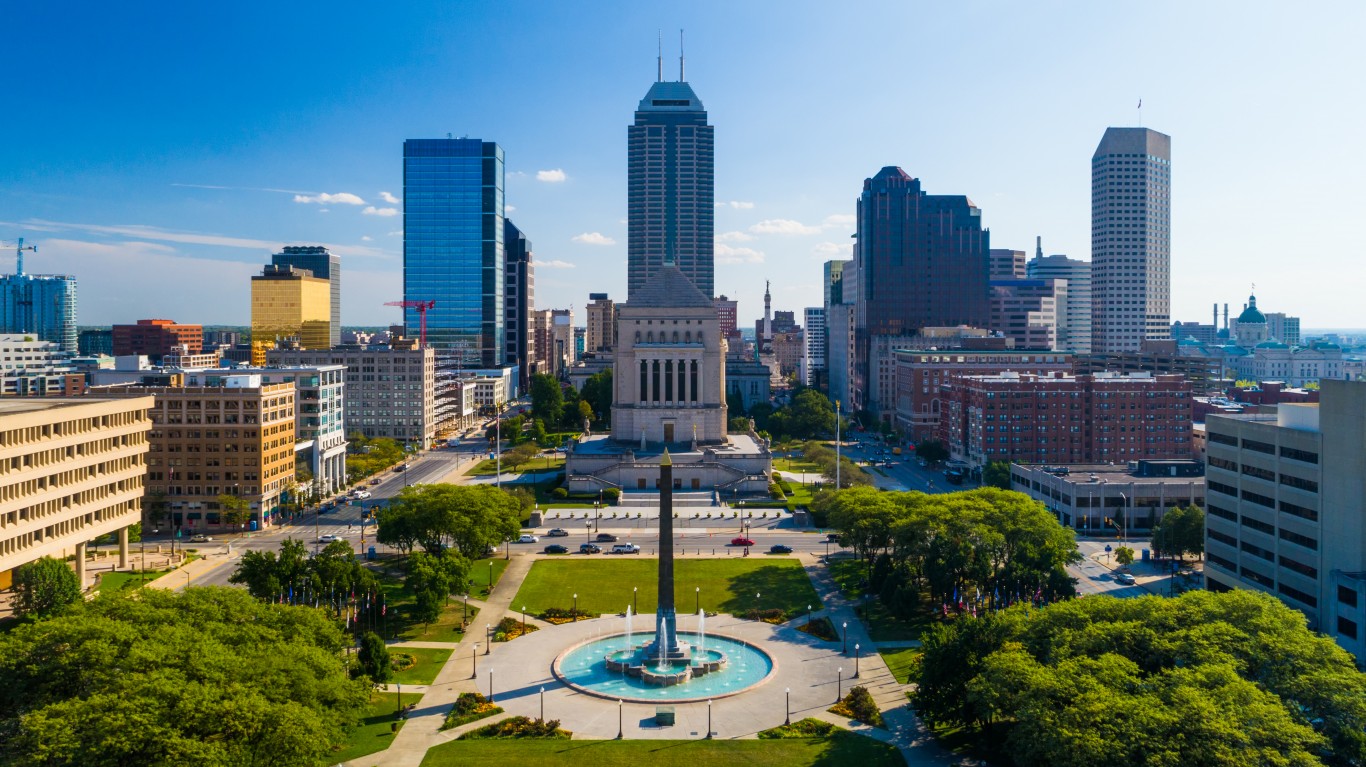
42. Indiana
> Total vaccines distributed to state: 11,315,820
> Total vaccines administered within state: 8,589,967
> Pct. of distributed vaccines administered: 75.9%
> Confirmed COVID-19 cases: 19,111 per 100,000

41. Texas
> Total vaccines distributed to state: 53,738,365
> Total vaccines administered within state: 41,184,969
> Pct. of distributed vaccines administered: 76.6%
> Confirmed COVID-19 cases: 16,550 per 100,000
These are all the counties in Texas where COVID-19 is slowing (and where it’s still getting worse).

40. Michigan
> Total vaccines distributed to state: 18,418,430
> Total vaccines administered within state: 14,151,800
> Pct. of distributed vaccines administered: 76.8%
> Confirmed COVID-19 cases: 17,947 per 100,000

39. Alaska
> Total vaccines distributed to state: 1,343,785
> Total vaccines administered within state: 1,033,747
> Pct. of distributed vaccines administered: 76.9%
> Confirmed COVID-19 cases: 21,102 per 100,000
These are all the counties in Alaska where COVID-19 is slowing (and where it’s still getting worse).

38. Pennsylvania
> Total vaccines distributed to state: 26,336,805
> Total vaccines administered within state: 20,403,513
> Pct. of distributed vaccines administered: 77.5%
> Confirmed COVID-19 cases: 16,556 per 100,000

37. Kentucky
> Total vaccines distributed to state: 7,673,385
> Total vaccines administered within state: 5,963,769
> Pct. of distributed vaccines administered: 77.7%
> Confirmed COVID-19 cases: 19,824 per 100,000

36. Maryland
> Total vaccines distributed to state: 13,586,620
> Total vaccines administered within state: 10,569,548
> Pct. of distributed vaccines administered: 77.8%
> Confirmed COVID-19 cases: 12,839 per 100,000

35. Kansas
> Total vaccines distributed to state: 5,287,535
> Total vaccines administered within state: 4,129,621
> Pct. of distributed vaccines administered: 78.1%
> Confirmed COVID-19 cases: 18,343 per 100,000
These are all the counties in Kansas where COVID-19 is slowing (and where it’s still getting worse).

34. North Carolina
> Total vaccines distributed to state: 19,284,400
> Total vaccines administered within state: 15,114,964
> Pct. of distributed vaccines administered: 78.4%
> Confirmed COVID-19 cases: 16,617 per 100,000
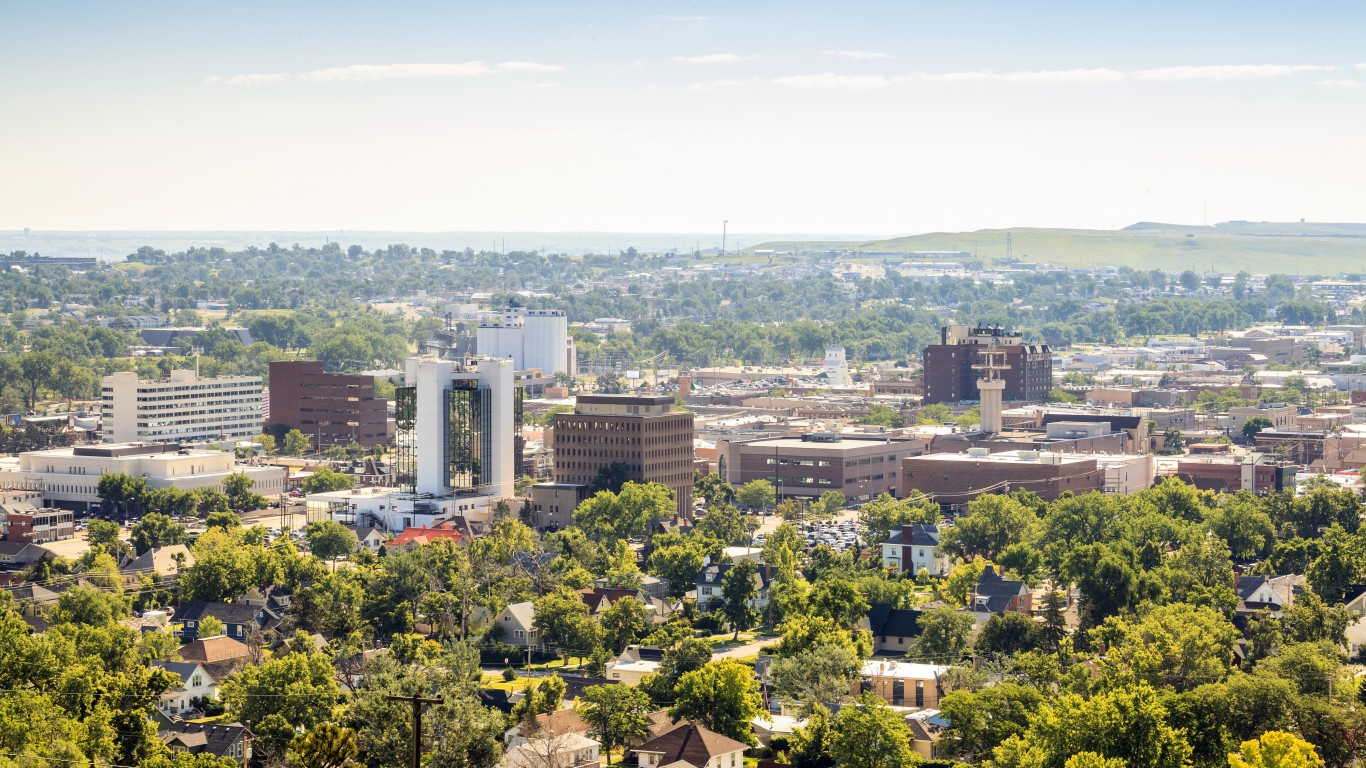
33. South Dakota
> Total vaccines distributed to state: 1,627,435
> Total vaccines administered within state: 1,276,844
> Pct. of distributed vaccines administered: 78.5%
> Confirmed COVID-19 cases: 20,689 per 100,000
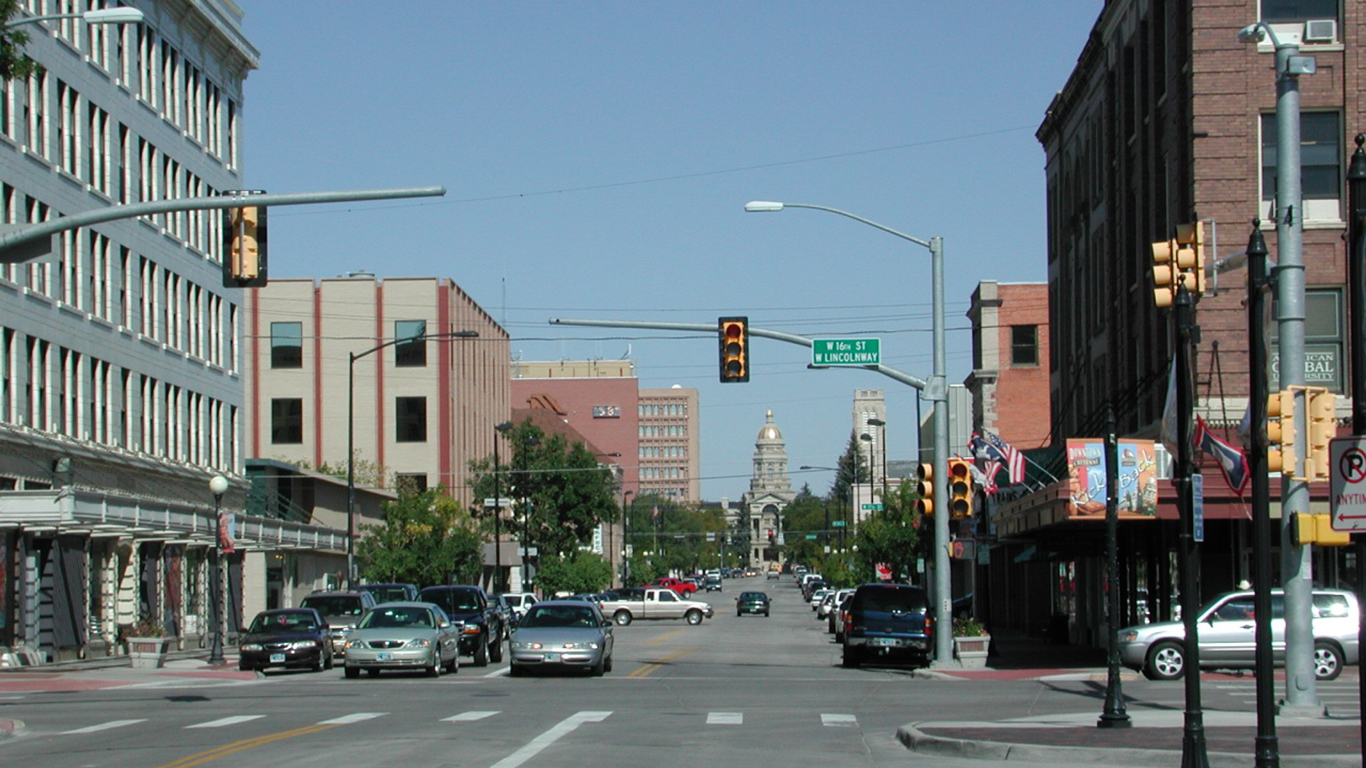
32. Wyoming
> Total vaccines distributed to state: 873,365
> Total vaccines administered within state: 691,569
> Pct. of distributed vaccines administered: 79.2%
> Confirmed COVID-19 cases: 20,283 per 100,000

31. Delaware
> Total vaccines distributed to state: 2,020,055
> Total vaccines administered within state: 1,600,324
> Pct. of distributed vaccines administered: 79.2%
> Confirmed COVID-19 cases: 19,681 per 100,000

30. New Jersey
> Total vaccines distributed to state: 19,143,875
> Total vaccines administered within state: 15,181,675
> Pct. of distributed vaccines administered: 79.3%
> Confirmed COVID-19 cases: 18,852 per 100,000

29. Oregon
> Total vaccines distributed to state: 8,683,555
> Total vaccines administered within state: 6,890,513
> Pct. of distributed vaccines administered: 79.4%
> Confirmed COVID-19 cases: 10,324 per 100,000
These are all the counties in Oregon where COVID-19 is slowing (and where it’s still getting worse).

28. Louisiana
> Total vaccines distributed to state: 7,198,860
> Total vaccines administered within state: 5,713,570
> Pct. of distributed vaccines administered: 79.4%
> Confirmed COVID-19 cases: 18,696 per 100,000

27. Ohio
> Total vaccines distributed to state: 20,333,655
> Total vaccines administered within state: 16,181,328
> Pct. of distributed vaccines administered: 79.6%
> Confirmed COVID-19 cases: 17,906 per 100,000
These are all the counties in Ohio where COVID-19 is slowing (and where it’s still getting worse).

26. Missouri
> Total vaccines distributed to state: 10,181,565
> Total vaccines administered within state: 8,147,461
> Pct. of distributed vaccines administered: 80.0%
> Confirmed COVID-19 cases: 16,981 per 100,000

25. Tennessee
> Total vaccines distributed to state: 11,237,360
> Total vaccines administered within state: 9,033,505
> Pct. of distributed vaccines administered: 80.4%
> Confirmed COVID-19 cases: 21,423 per 100,000

24. Iowa
> Total vaccines distributed to state: 5,805,975
> Total vaccines administered within state: 4,679,330
> Pct. of distributed vaccines administered: 80.6%
> Confirmed COVID-19 cases: 18,764 per 100,000
These are all the counties in Iowa where COVID-19 is slowing (and where it’s still getting worse).

23. Florida
> Total vaccines distributed to state: 42,126,435
> Total vaccines administered within state: 34,002,943
> Pct. of distributed vaccines administered: 80.7%
> Confirmed COVID-19 cases: 20,578 per 100,000

22. New Hampshire
> Total vaccines distributed to state: 3,000,510
> Total vaccines administered within state: 2,422,037
> Pct. of distributed vaccines administered: 80.7%
> Confirmed COVID-19 cases: 15,069 per 100,000
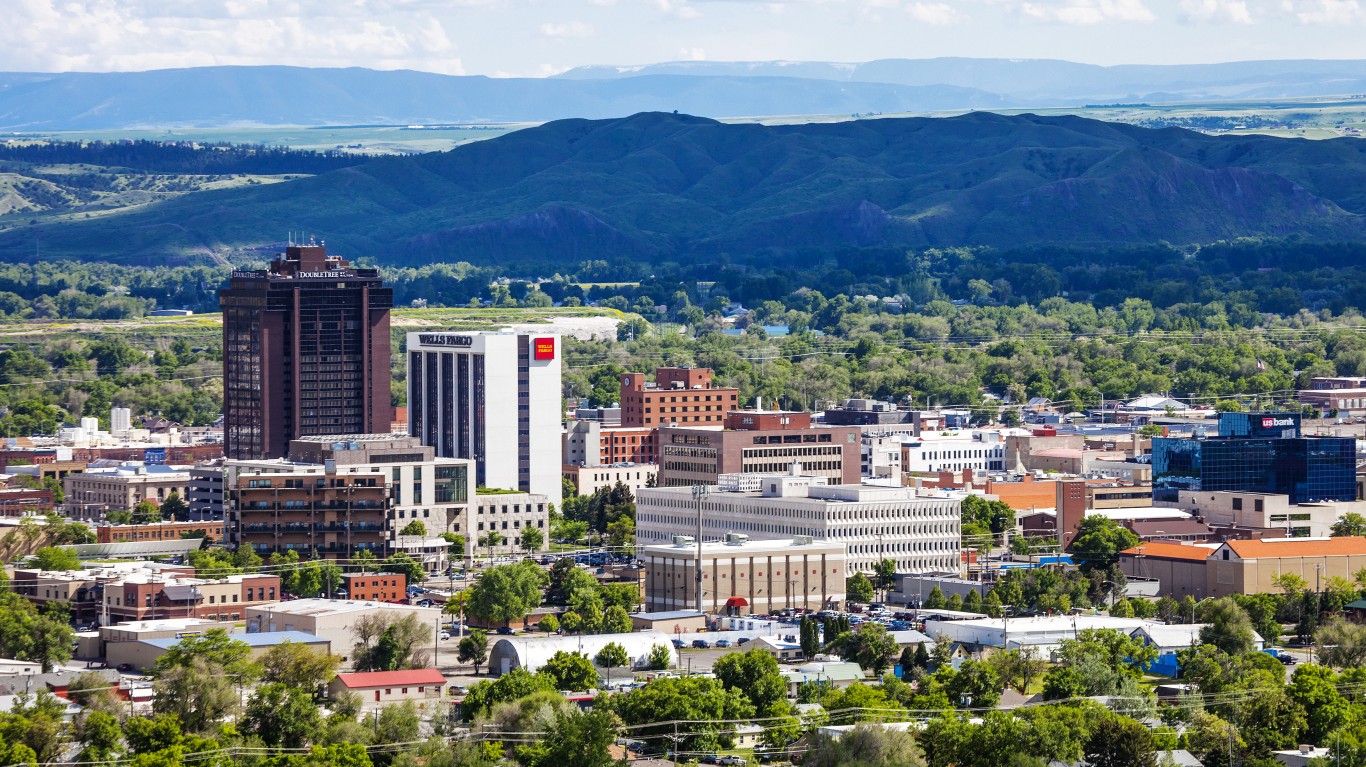
21. Montana
> Total vaccines distributed to state: 1,771,895
> Total vaccines administered within state: 1,454,654
> Pct. of distributed vaccines administered: 82.1%
> Confirmed COVID-19 cases: 18,662 per 100,000

20. Arizona
> Total vaccines distributed to state: 12,933,400
> Total vaccines administered within state: 10,637,900
> Pct. of distributed vaccines administered: 82.3%
> Confirmed COVID-19 cases: 19,396 per 100,000

19. Washington
> Total vaccines distributed to state: 15,477,225
> Total vaccines administered within state: 12,740,540
> Pct. of distributed vaccines administered: 82.3%
> Confirmed COVID-19 cases: 11,666 per 100,000

18. Utah
> Total vaccines distributed to state: 5,509,820
> Total vaccines administered within state: 4,564,340
> Pct. of distributed vaccines administered: 82.8%
> Confirmed COVID-19 cases: 20,475 per 100,000
These are all the counties in Utah where COVID-19 is slowing (and where it’s still getting worse).

17. Nebraska
> Total vaccines distributed to state: 3,492,130
> Total vaccines administered within state: 2,894,196
> Pct. of distributed vaccines administered: 82.9%
> Confirmed COVID-19 cases: 18,069 per 100,000

16. Oklahoma
> Total vaccines distributed to state: 6,449,300
> Total vaccines administered within state: 5,376,180
> Pct. of distributed vaccines administered: 83.4%
> Confirmed COVID-19 cases: 18,319 per 100,000

15. Minnesota
> Total vaccines distributed to state: 11,096,570
> Total vaccines administered within state: 9,257,644
> Pct. of distributed vaccines administered: 83.4%
> Confirmed COVID-19 cases: 18,533 per 100,000

14. Nevada
> Total vaccines distributed to state: 5,216,950
> Total vaccines administered within state: 4,379,291
> Pct. of distributed vaccines administered: 83.9%
> Confirmed COVID-19 cases: 16,793 per 100,000
These are all the counties in Nevada where COVID-19 is slowing (and where it’s still getting worse).
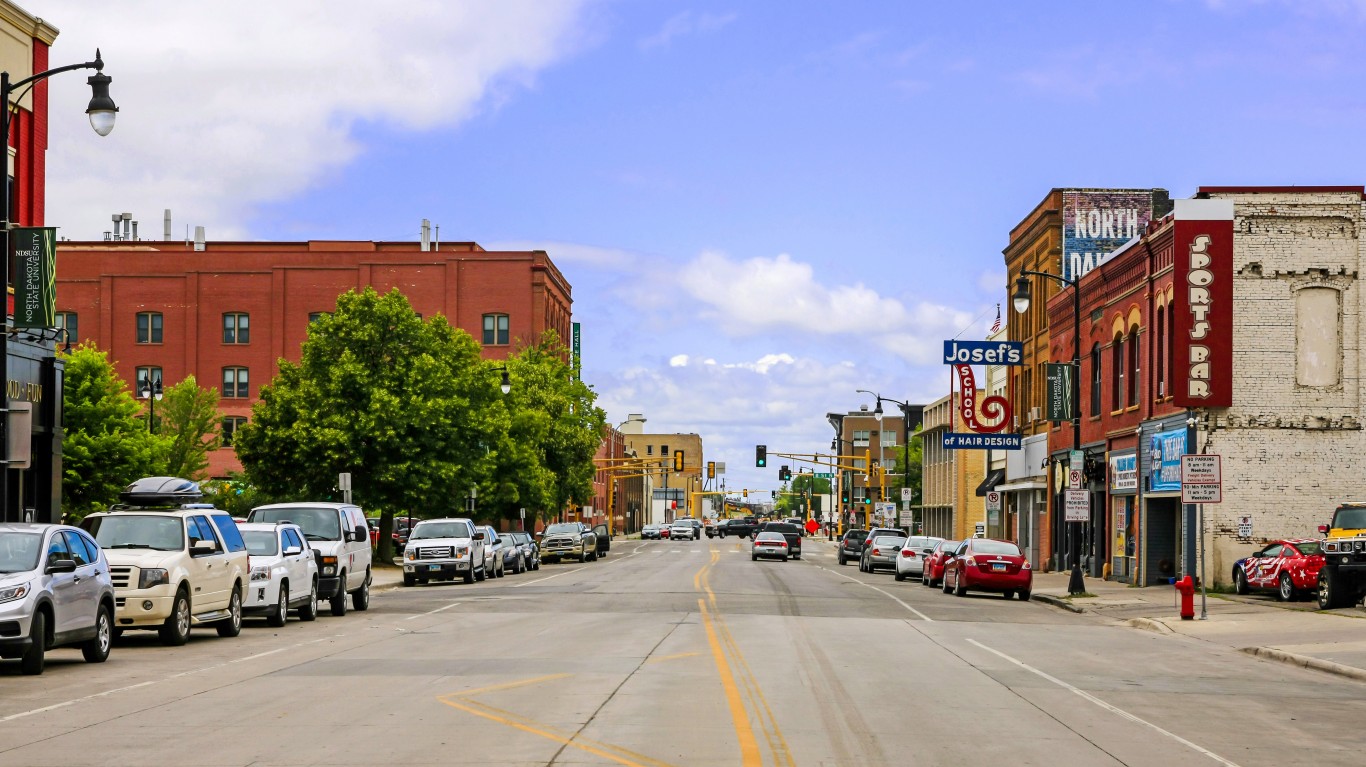
13. North Dakota
> Total vaccines distributed to state: 1,219,960
> Total vaccines administered within state: 1,024,301
> Pct. of distributed vaccines administered: 84.0%
> Confirmed COVID-19 cases: 23,333 per 100,000

12. Illinois
> Total vaccines distributed to state: 23,954,195
> Total vaccines administered within state: 20,156,464
> Pct. of distributed vaccines administered: 84.1%
> Confirmed COVID-19 cases: 17,860 per 100,000

11. Rhode Island
> Total vaccines distributed to state: 2,343,425
> Total vaccines administered within state: 1,981,579
> Pct. of distributed vaccines administered: 84.6%
> Confirmed COVID-19 cases: 23,347 per 100,000

10. Virginia
> Total vaccines distributed to state: 17,266,955
> Total vaccines administered within state: 14,678,360
> Pct. of distributed vaccines administered: 85.0%
> Confirmed COVID-19 cases: 13,905 per 100,000

9. Maine
> Total vaccines distributed to state: 2,966,480
> Total vaccines administered within state: 2,544,813
> Pct. of distributed vaccines administered: 85.8%
> Confirmed COVID-19 cases: 11,125 per 100,000
These are all the counties in Maine where COVID-19 is slowing (and where it’s still getting worse).

8. California
> Total vaccines distributed to state: 77,883,495
> Total vaccines administered within state: 66,900,191
> Pct. of distributed vaccines administered: 85.9%
> Confirmed COVID-19 cases: 14,463 per 100,000

7. New York
> Total vaccines distributed to state: 40,386,775
> Total vaccines administered within state: 34,834,997
> Pct. of distributed vaccines administered: 86.3%
> Confirmed COVID-19 cases: 19,465 per 100,000

6. Colorado
> Total vaccines distributed to state: 11,089,475
> Total vaccines administered within state: 9,619,008
> Pct. of distributed vaccines administered: 86.7%
> Confirmed COVID-19 cases: 16,719 per 100,000

5. Vermont
> Total vaccines distributed to state: 1,452,400
> Total vaccines administered within state: 1,266,574
> Pct. of distributed vaccines administered: 87.2%
> Confirmed COVID-19 cases: 10,167 per 100,000

4. Massachusetts
> Total vaccines distributed to state: 14,986,740
> Total vaccines administered within state: 13,186,234
> Pct. of distributed vaccines administered: 88.0%
> Confirmed COVID-19 cases: 17,302 per 100,000

3. Connecticut
> Total vaccines distributed to state: 7,632,635
> Total vaccines administered within state: 6,765,316
> Pct. of distributed vaccines administered: 88.6%
> Confirmed COVID-19 cases: 15,271 per 100,000

2. New Mexico
> Total vaccines distributed to state: 3,906,275
> Total vaccines administered within state: 3,472,036
> Pct. of distributed vaccines administered: 88.9%
> Confirmed COVID-19 cases: 17,127 per 100,000

1. Wisconsin
> Total vaccines distributed to state: 10,273,055
> Total vaccines administered within state: 9,240,483
> Pct. of distributed vaccines administered: 89.9%
> Confirmed COVID-19 cases: 19,619 per 100,000
Click here to see all coronavirus data for every state.
Take Charge of Your Retirement In Just A Few Minutes (Sponsor)
Retirement planning doesn’t have to feel overwhelming. The key is finding expert guidance—and SmartAsset’s simple quiz makes it easier than ever for you to connect with a vetted financial advisor.
Here’s how it works:
- Answer a Few Simple Questions. Tell us a bit about your goals and preferences—it only takes a few minutes!
- Get Matched with Vetted Advisors Our smart tool matches you with up to three pre-screened, vetted advisors who serve your area and are held to a fiduciary standard to act in your best interests. Click here to begin
- Choose Your Fit Review their profiles, schedule an introductory call (or meet in person), and select the advisor who feel is right for you.
Why wait? Start building the retirement you’ve always dreamed of. Click here to get started today!
Thank you for reading! Have some feedback for us?
Contact the 24/7 Wall St. editorial team.

Our expert who first called NVIDIA in 2009 is predicting 2025 will see a historic AI breakthrough.
You can follow him investing $500,000 of his own money on our top AI stocks for free.