The National Park System comprises 63 national parks and over 350 national park sites that stretch over more than 84 million acres. Dotting across all states and U.S. territories, the sites range from large, well-known parks like the Grand Canyon and Yellowstone to historically significant places, like the birthplace of Martin Luther King, Jr.
Whether exploring history or sight-seeing, our national parks provide a wonderland of recreation and education.
When visitors saunter along a national park pathway, they inevitably bring along their smartphones to take pictures and record their adventures. How would anyone believe you were there if you didn’t post it on Instagram? Of course, it’s not just about the “pics or it didn’t happen.” You’d need good service if there is an emergency, to make further plans, or to check in with your homebase.
You may also want to spend a few days at a park and work remotely or get other digital comforts you’re used to. For that, you’d need reliable and strong mobile service. So before you set off on your journey through a national park, be sure it has the necessary mobile service. (Want to travel to a city and be assured of good broadband? See large cities with the best and most reliable internet access.)
To find the 10 national parks with the best mobile service and the 10 with the worst, 24/7 Tempo reviewed Speedtest’s feature, “Choose Your National Park Adventure: The Best Places to Work Remotely or Digitally Disconnect.” Speedtest analyzed mobile services at U.S. national parks for median download and upload speeds as well as 4G and 5G availability.
Missouri’s Gateway Arch provides the best mobile service among national parks. It offers 5G availability and near 100% 4G availability. Median download speed is 84.6 mbps (megabytes per second), and median upload is 31.1 mbps. This is likely not surprising considering the park is in a major metro area, St. Louis. Many parks near urban areas have better mobile services.
The park with the poorest service is Sequoia Park in California, where 4G availability is a scant 4%, with no 5G availability. Both median download and upload speed crawl at 1.4 mbps. (Based on size, here are the largest and smallest national parks.)
Whatever the mobile service at any national park, simply being able to enjoy the wonders around us is worth the trip and perhaps hassle of poor service.
Click here to see the national park with the best and worst mobile service
Fastest
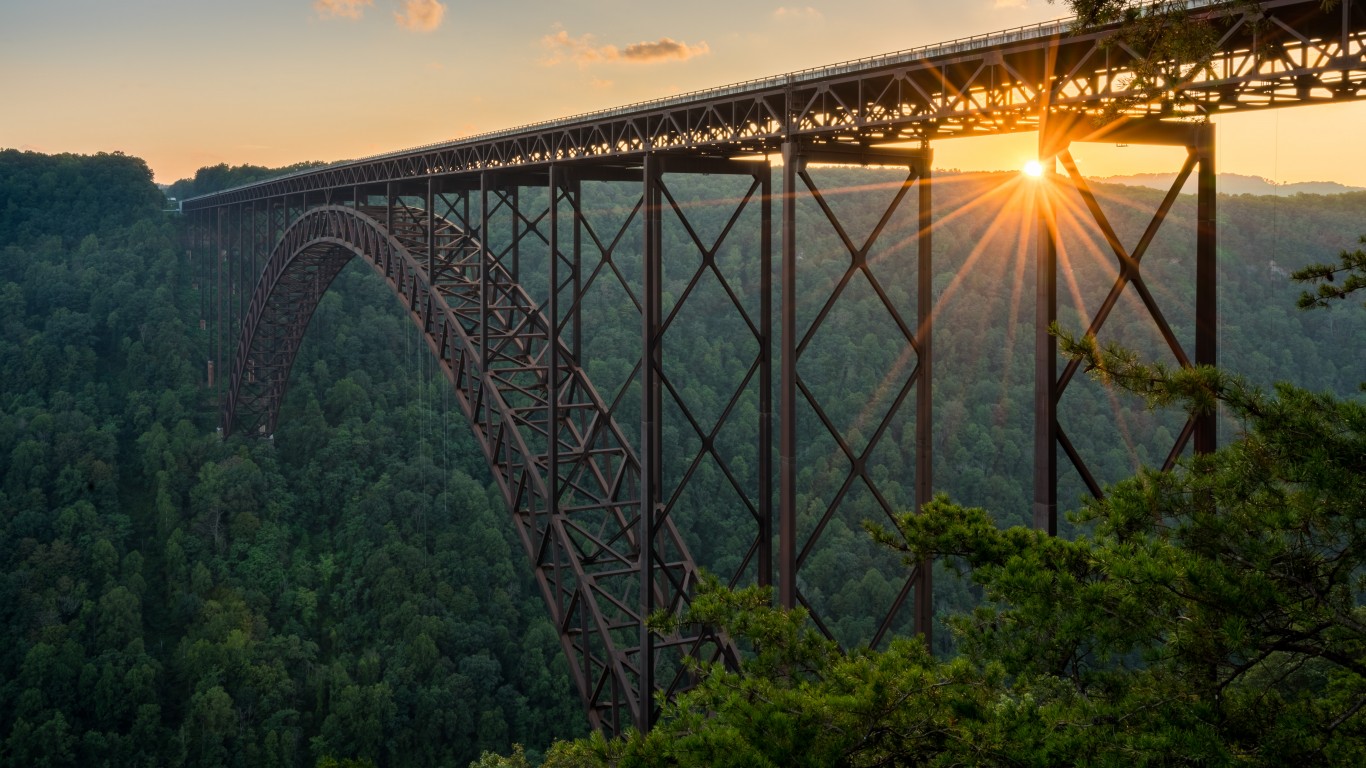
10. New River Gorge, West Virginia
> Median download speed: 31.4 mbps
> Median upload: 8.6 mbps
> 4G availability: 87.0%
> 5G availability: Yes
[in-text-ad]

9. Hot Springs, Arkansas
> Median download speed: 34.9 mbps
> Median upload: 7.1 mbps
> 4G availability: 93.0%
> 5G availability: Not available
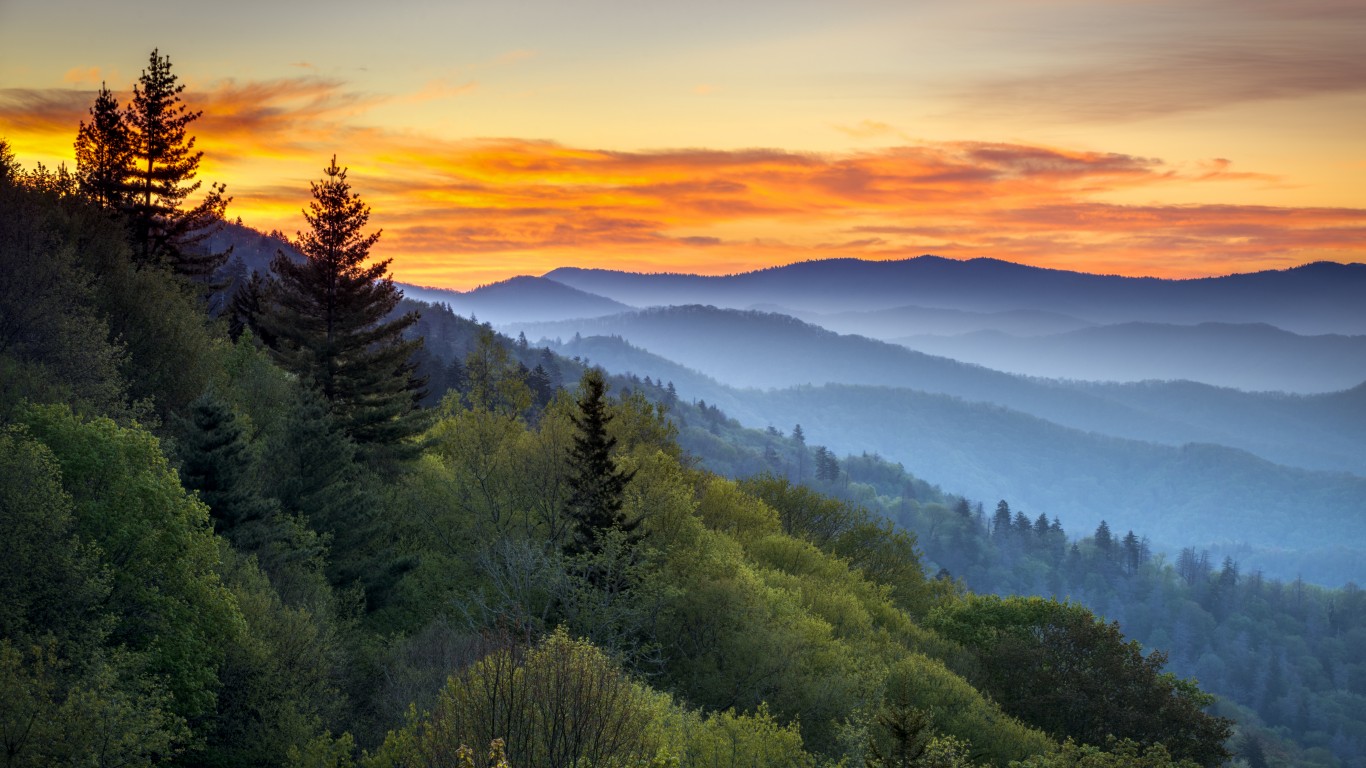
8. Great Smoky Mountains, North Carolina
> Median download speed: 36.2 mbps
> Median upload: 9.5 mbps
> 4G availability: Not available
> 5G availability: Yes

7. Denali, Alaska
> Median download speed: 37.8 mbps
> Median upload: 13.2 mbps
> 4G availability: Not available
> 5G availability: Not available
[in-text-ad-2]
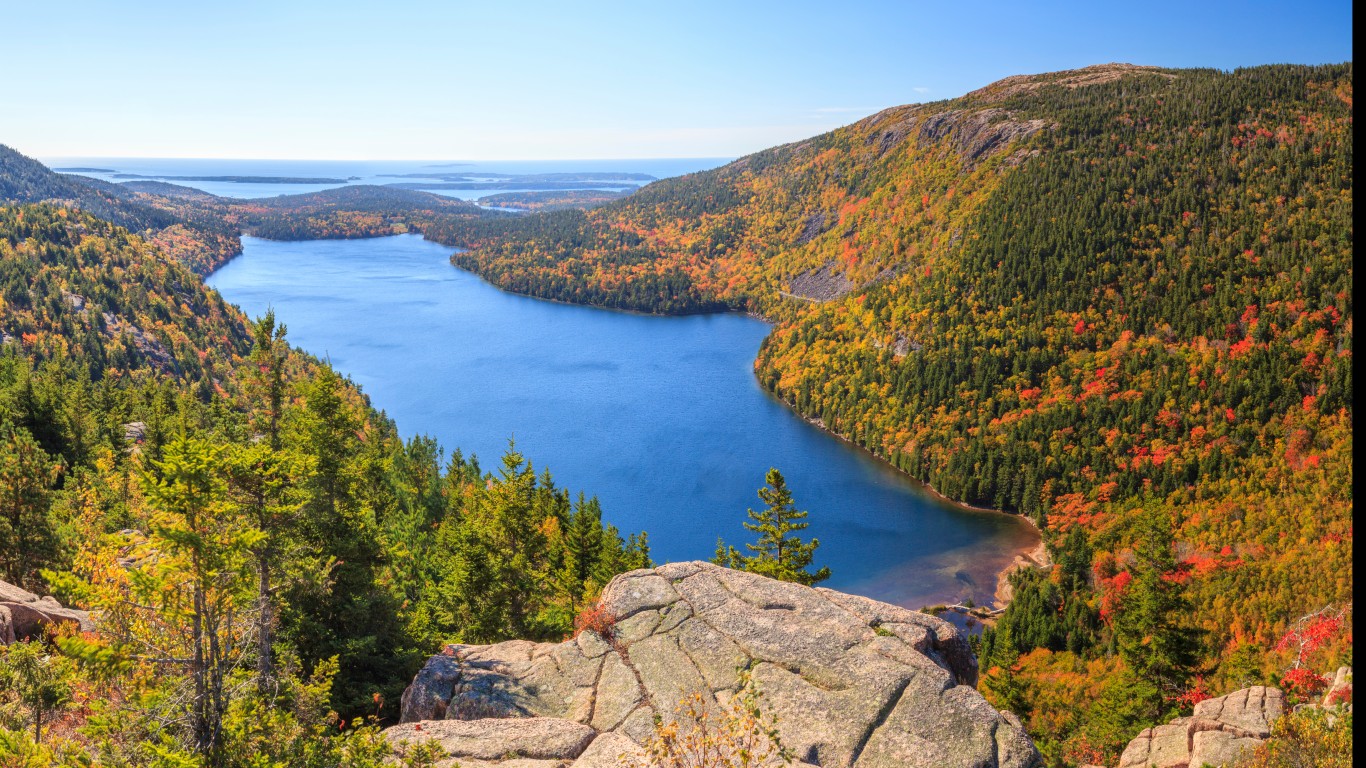
6. Acadia, Maine
> Median download speed: 39.3 mbps
> Median upload: 9.3 mbps
> 4G availability: Not available
> 5G availability: Not available

5. Indiana Dunes, Indiana
> Median download speed: 51.4 mbps
> Median upload: 8.1 mbps
> 4G availability: 89.0%
> 5G availability: Yes
[in-text-ad]
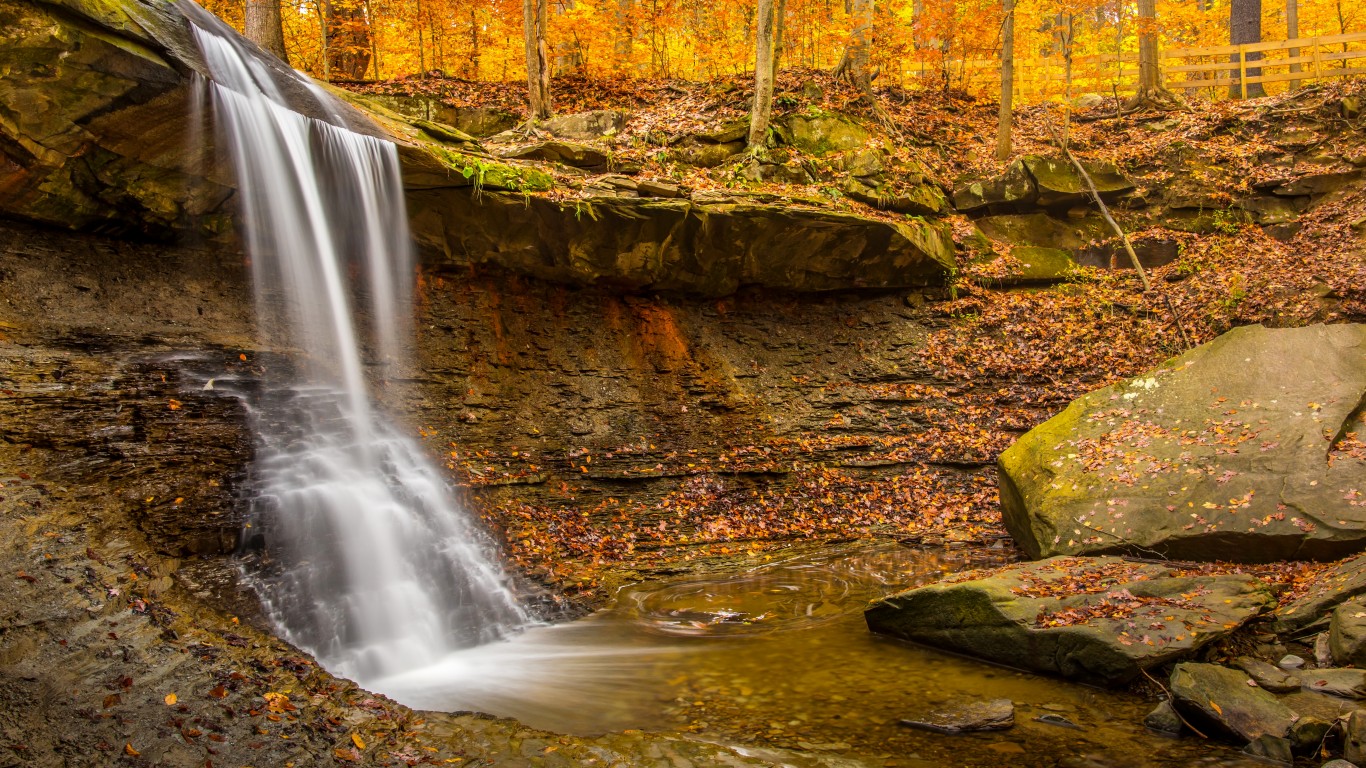
4. Cuyahoga Valley, Ohio
> Median download speed: 55.3 mbps
> Median upload: 10.9 mbps
> 4G availability: 98.0%
> 5G availability: Yes
3. Mount Rainier, Washington
> Median download speed: 72.9 mbps
> Median upload: 11.0 mbps
> 4G availability: Not available
> 5G availability: Not available
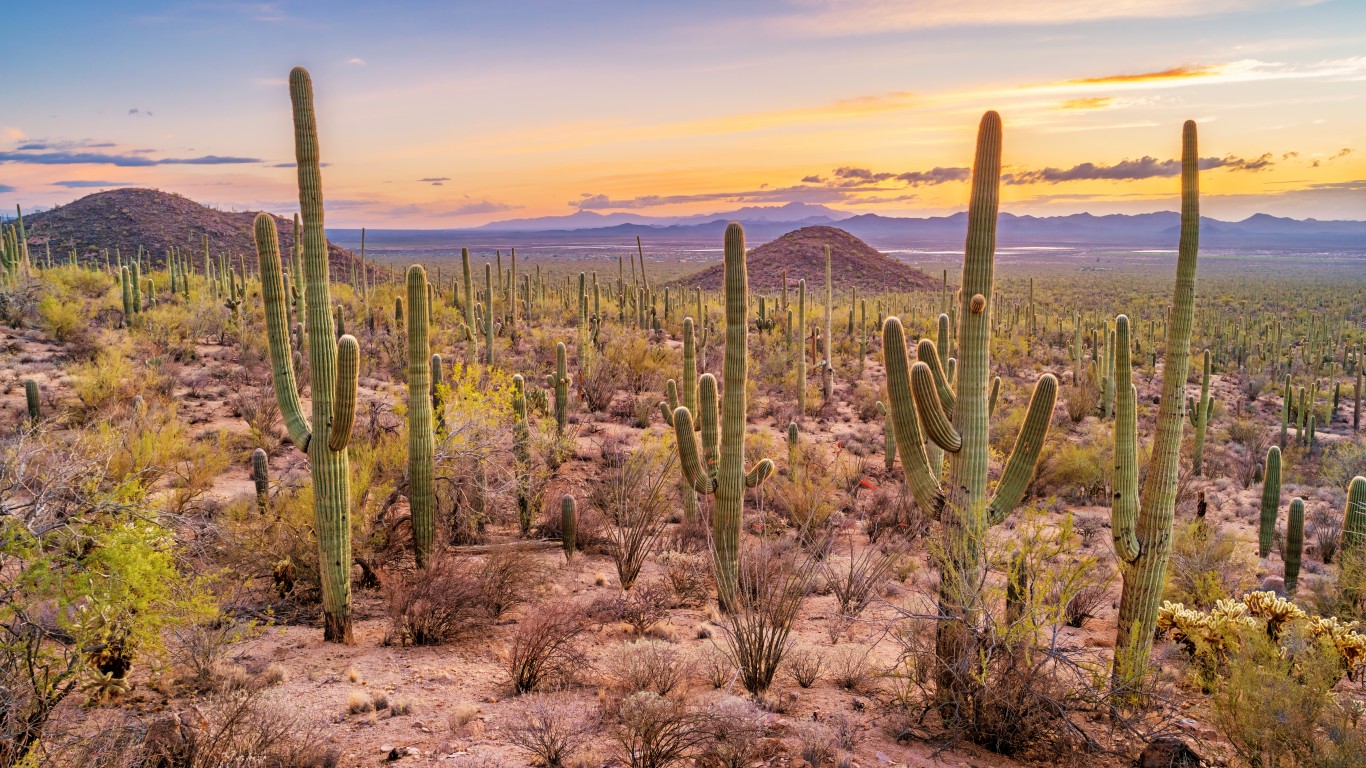
2. Saguaro, Arizona
> Median download speed: 82.2 mbps
> Median upload: 6.2 mbps
> 4G availability: 92.0%
> 5G availability: Yes
[in-text-ad-2]

1. Gateway Arch, Missouri
> Median download speed: 84.6 mbps
> Median upload: 31.1 mbps
> 4G availability: 97.0%
> 5G availability: Yes
Slowest

10. Mammoth Cave, Kentucky
> Median download speed: 6.2 mbps
> Median upload: 0.8 mbps
> 4G availability: Not available
> 5G availability: No
[in-text-ad]
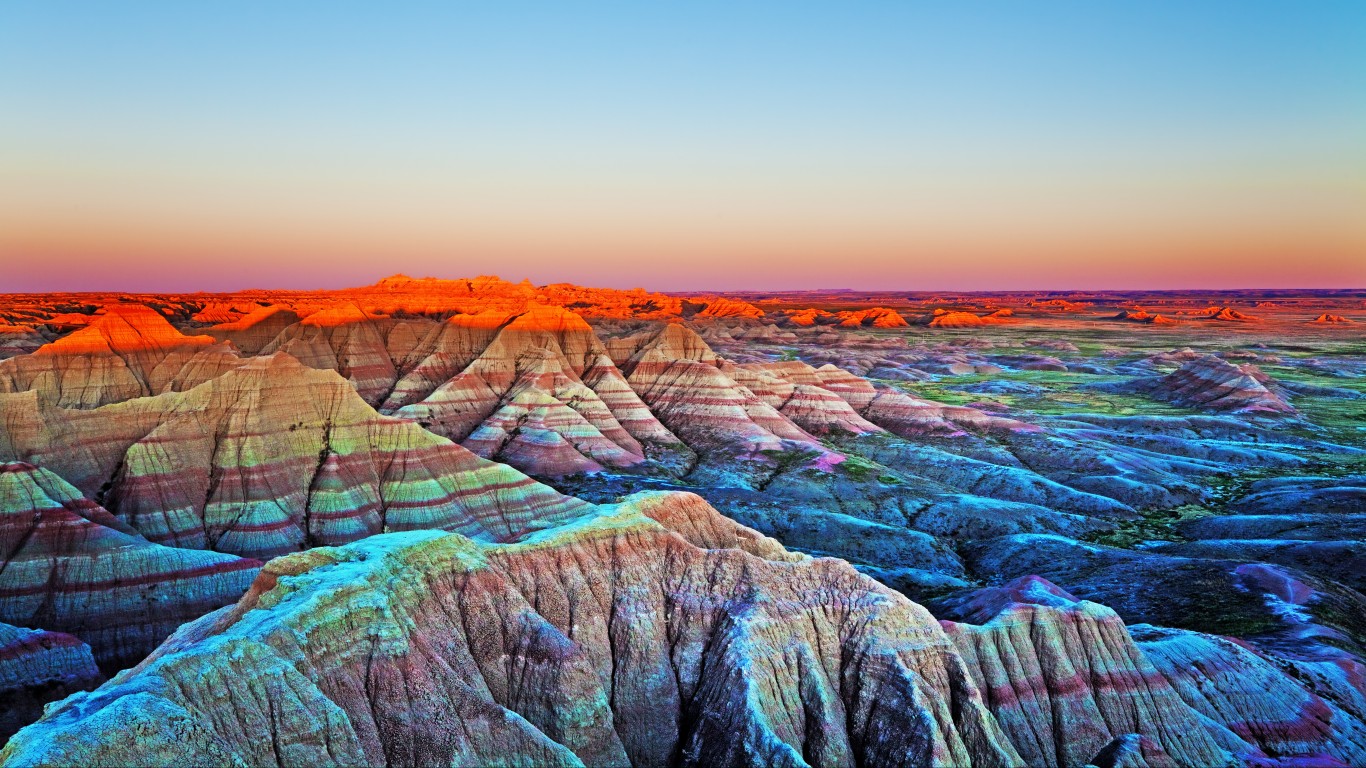
9. Badlands, South Dakota
> Median download speed: 6.0 mbps
> Median upload: 1.7 mbps
> 4G availability: Not available
> 5G availability: No
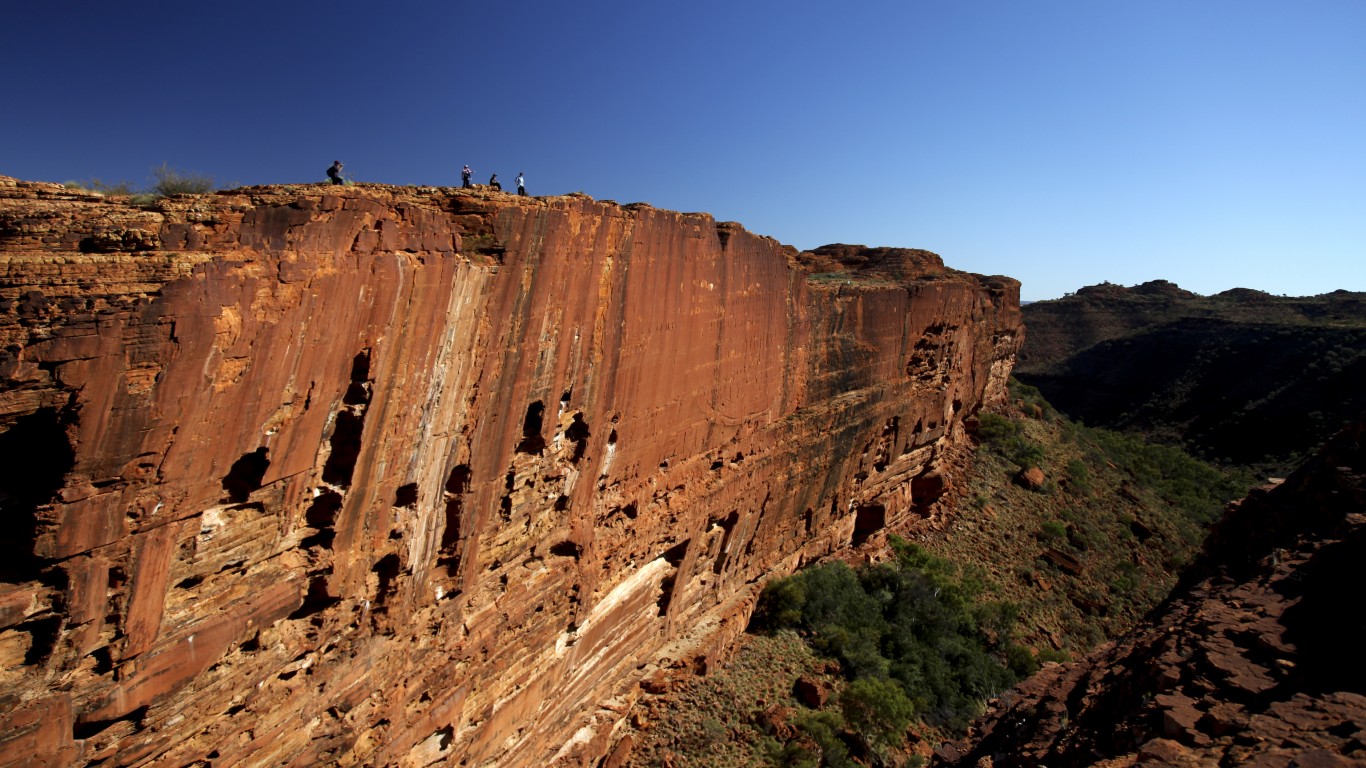
8. Kings Canyon, California
> Median download speed: 5.4 mbps
> Median upload: 1.1 mbps
> 4G availability: 23.0%
> 5G availability: No
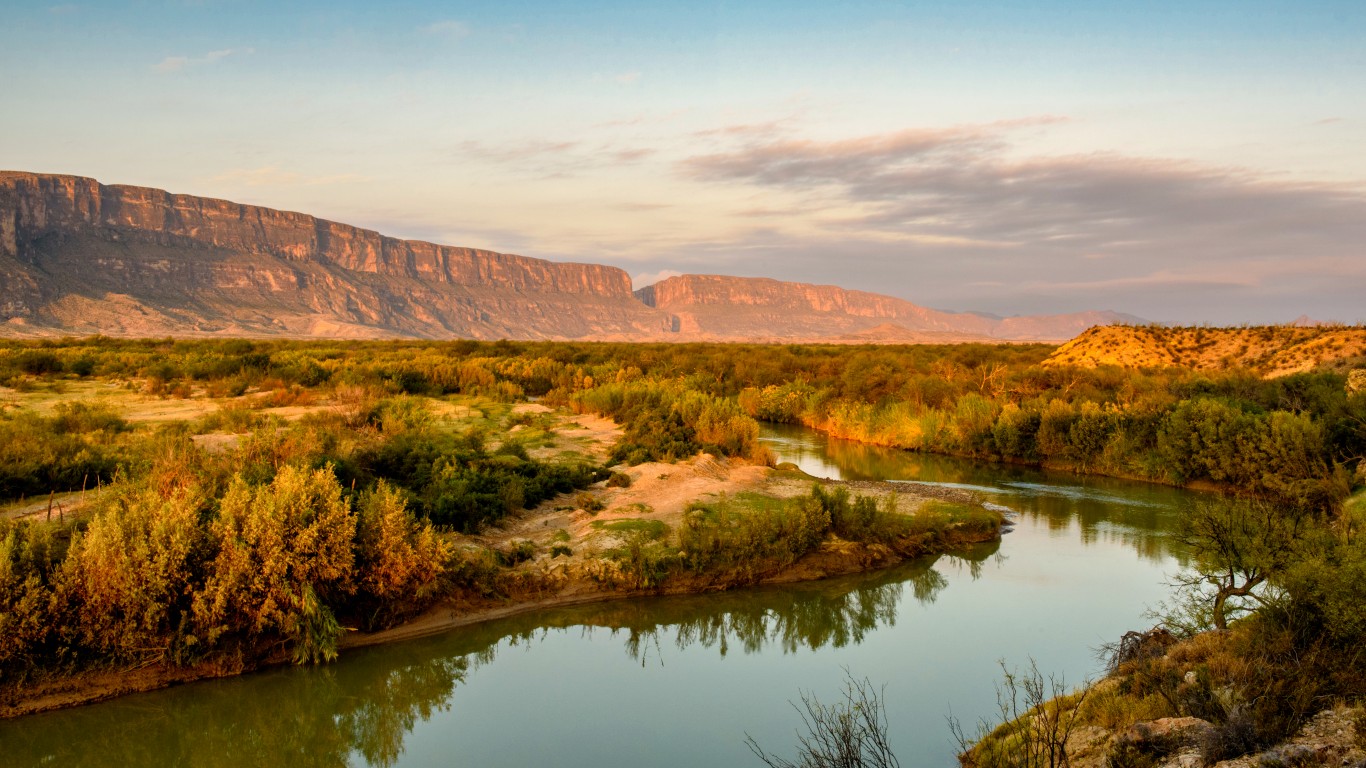
7. Big Bend, Texas
> Median download speed: 5.3 mbps
> Median upload: 1.0 mbps
> 4G availability: 4.0%
> 5G availability: No
[in-text-ad-2]
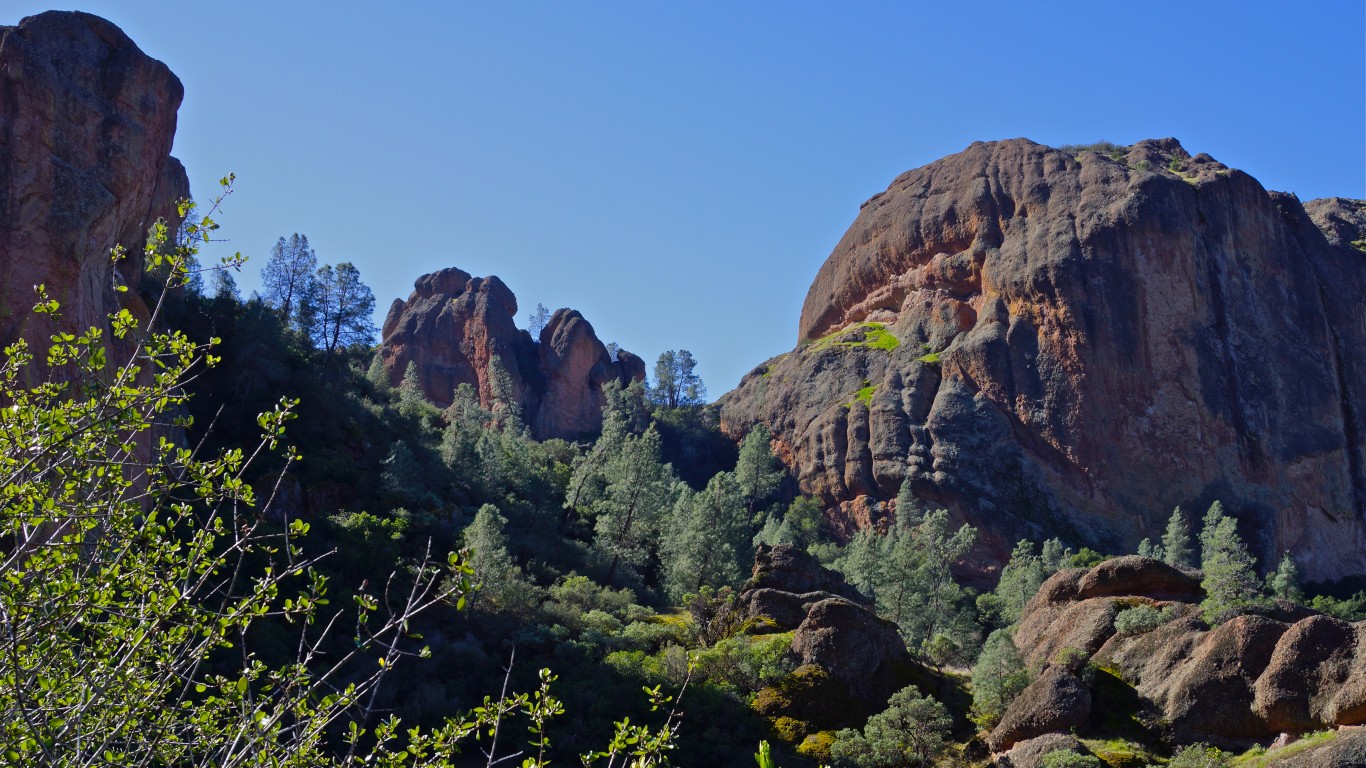
6. Pinnacles, California
> Median download speed: 4.6 mbps
> Median upload: 0.8 mbps
> 4G availability: 23.0%
> 5G availability: No

5. Mesa Verde, Colorado
> Median download speed: 3.0 mbps
> Median upload: 2.2 mbps
> 4G availability: Not available
> 5G availability: No
[in-text-ad]

4. Crater Lake, Oregon
> Median download speed: 2.3 mbps
> Median upload: 0.7 mbps
> 4G availability: Not available
> 5G availability: No
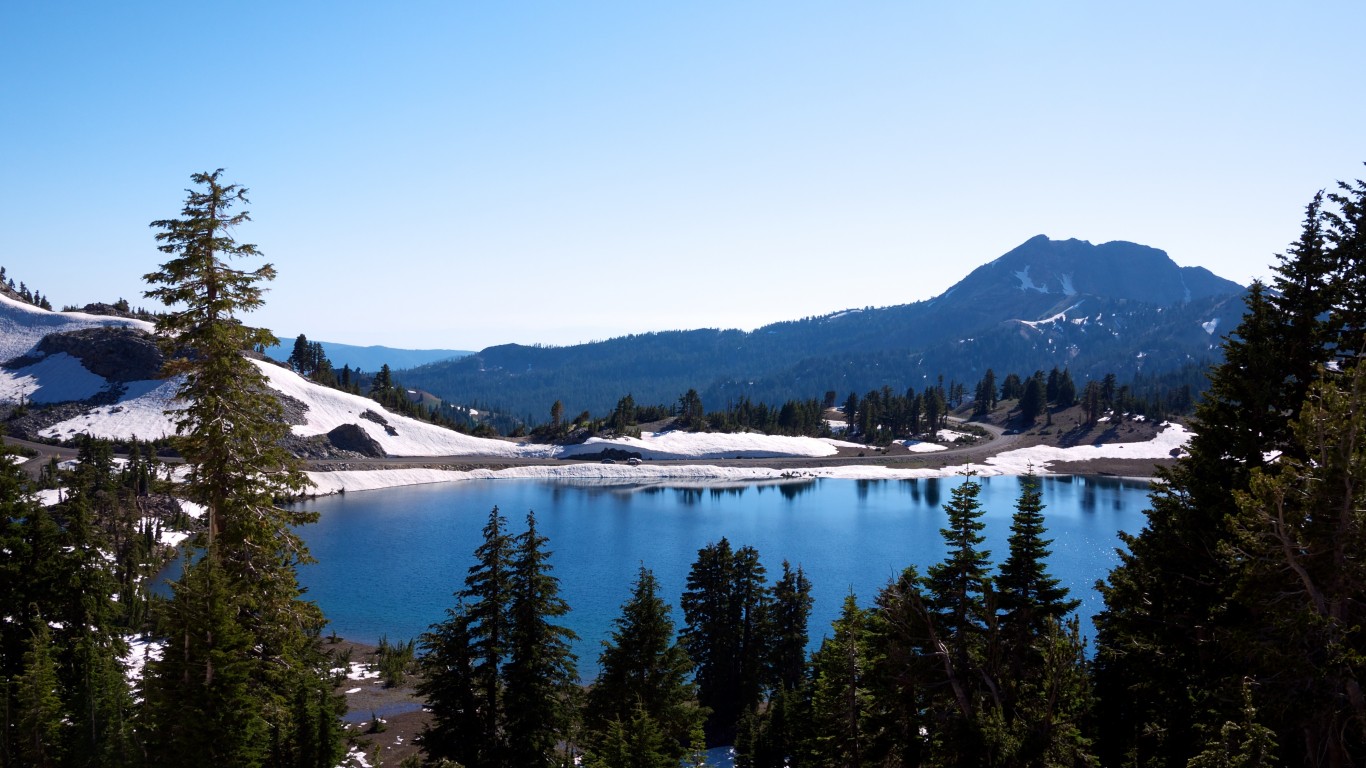
3. Lassen Volcanic, California
> Median download speed: 2.1 mbps
> Median upload: 0.6 mbps
> 4G availability: 22.0%
> 5G availability: No

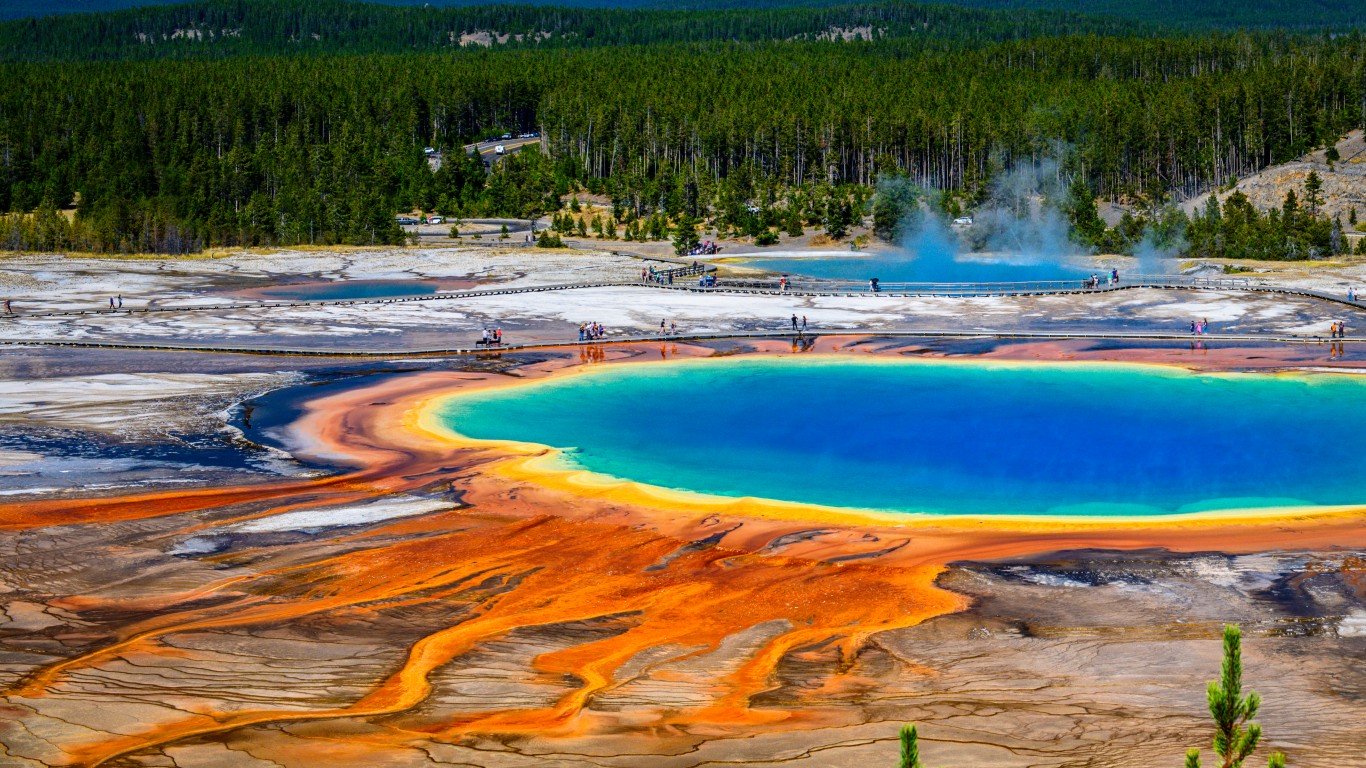
2. Yellowstone, Wyoming
> Median download speed: 1.8 mbps
> Median upload: 0.5 mbps
> 4G availability: 25.0%
> 5G availability: No
[in-text-ad-2]
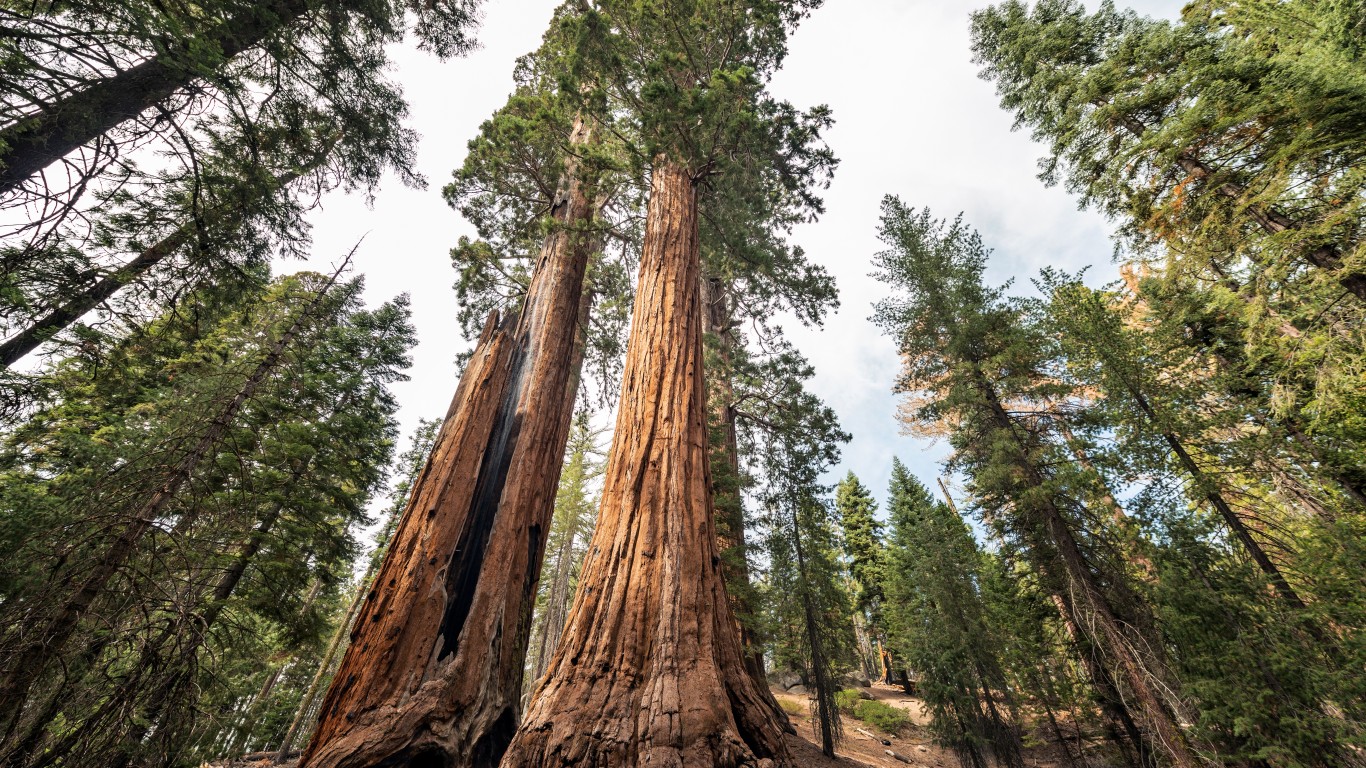
1. Sequoia, California
> Median download speed: 1.4 mbps
> Median upload: 1.4 mbps
> 4G availability: 4.0%
> 5G availability: No
Travel Cards Are Getting Too Good To Ignore (sponsored)
Credit card companies are pulling out all the stops, with the issuers are offering insane travel rewards and perks.
We’re talking huge sign-up bonuses, points on every purchase, and benefits like lounge access, travel credits, and free hotel nights. For travelers, these rewards can add up to thousands of dollars in flights, upgrades, and luxury experiences every year.
It’s like getting paid to travel — and it’s available to qualified borrowers who know where to look.
We’ve rounded up some of the best travel credit cards on the market. Click here to see the list. Don’t miss these offers — they won’t be this good forever.
Thank you for reading! Have some feedback for us?
Contact the 24/7 Wall St. editorial team.

 24/7 Wall St.