
In the continuation of a longer-term trend stretching back over a decade, the number of births in the U.S. fell by 4% in 2020, pushing the birth rate to its lowest point on record. Experts attribute falling birth rates to the increase in the average age of mothers, as people have been marrying and having children later in life. A growing body of evidence suggests that the COVID-19 pandemic may have deterred many would-be parents from starting families.
As it has been since 2007, the U.S. birth rate is well below what is referred to as “replacement-level fertility,” the birth rate a country must maintain to keep population levels stable without immigration. This could prove to be a problem. Though it is impossible to predict the implications with any degree of certainty, an aging and shrinking population could slow economic growth, strain government funding, and lead to worker shortages.
While birth rates are at historic lows nationwide, in some states, birth rates far exceed the national average of 10.8 births per 1,000 people. Using birth data over the one-year period ending on July, 1, 2021 from the U.S. Census Bureau, 24/7 Tempo identified the states with the highest birth rates. Birth rates range from as low as 7.9 per 1,000 to as high as 13.8 per 1,000, depending on the state.
In all but two of the 15 states with the lowest birth rates, deaths outnumbered births from July 1, 2020 to July 1, 2021. Meanwhile, births outnumbered deaths in all but three of the 15 states with the highest birth rates. Births minus deaths, as well as migration — people moving in and out of a given state — are the factors that contribute to overall population change. Here is a look at the top city Americans are moving to.
Generally, the states with the highest birth rates are mostly in the South, while those with the lowest are disproportionately located in the Northeast.
Click here to see the states with the highest birth rates
Methodology
To determine the states with the highest birth rates, 24/7 Wall St. reviewed data from the U.S. Census Bureau’s Population and Housing Unit Estimates Program. States were ranked based on the number of new births from July 1, 2020 to July 1, 2021 per 1,000 residents. Data on total population change and population change due to natural growth — new births minus deaths — were also calculated using data from PEP.

50. Vermont
> Births, July 2020 to July 2021: 7.9 per 1,000 residents (5,057 total)
> Population change due to new births, July 2020 to July 2021: +0.8%
> Total population change, July 2020 to July 2021: +0.5%
> Total population, July 2021: 645,570
[in-text-ad]

49. New Hampshire
> Births, July 2020 to July 2021: 8.3 per 1,000 residents (11,414 total)
> Population change due to new births, July 2020 to July 2021: +0.8%
> Total population change, July 2020 to July 2021: +0.8%
> Total population, July 2021: 1,388,992

48. Maine
> Births, July 2020 to July 2021: 8.3 per 1,000 residents (11,291 total)
> Population change due to new births, July 2020 to July 2021: +0.8%
> Total population change, July 2020 to July 2021: +0.7%
> Total population, July 2021: 1,372,247

47. Rhode Island
> Births, July 2020 to July 2021: 8.9 per 1,000 residents (9,717 total)
> Population change due to new births, July 2020 to July 2021: +0.9%
> Total population change, July 2020 to July 2021: -0.1%
> Total population, July 2021: 1,095,610
[in-text-ad-2]

46. Connecticut
> Births, July 2020 to July 2021: 9.1 per 1,000 residents (32,671 total)
> Population change due to new births, July 2020 to July 2021: +0.9%
> Total population change, July 2020 to July 2021: +0.1%
> Total population, July 2021: 3,605,597

45. Oregon
> Births, July 2020 to July 2021: 9.4 per 1,000 residents (39,877 total)
> Population change due to new births, July 2020 to July 2021: +0.9%
> Total population change, July 2020 to July 2021: +0.1%
> Total population, July 2021: 4,246,155
[in-text-ad]

44. Massachusetts
> Births, July 2020 to July 2021: 9.4 per 1,000 residents (66,197 total)
> Population change due to new births, July 2020 to July 2021: +0.9%
> Total population change, July 2020 to July 2021: -0.5%
> Total population, July 2021: 6,984,723

43. West Virginia
> Births, July 2020 to July 2021: 9.6 per 1,000 residents (17,232 total)
> Population change due to new births, July 2020 to July 2021: +1.0%
> Total population change, July 2020 to July 2021: -0.4%
> Total population, July 2021: 1,782,959
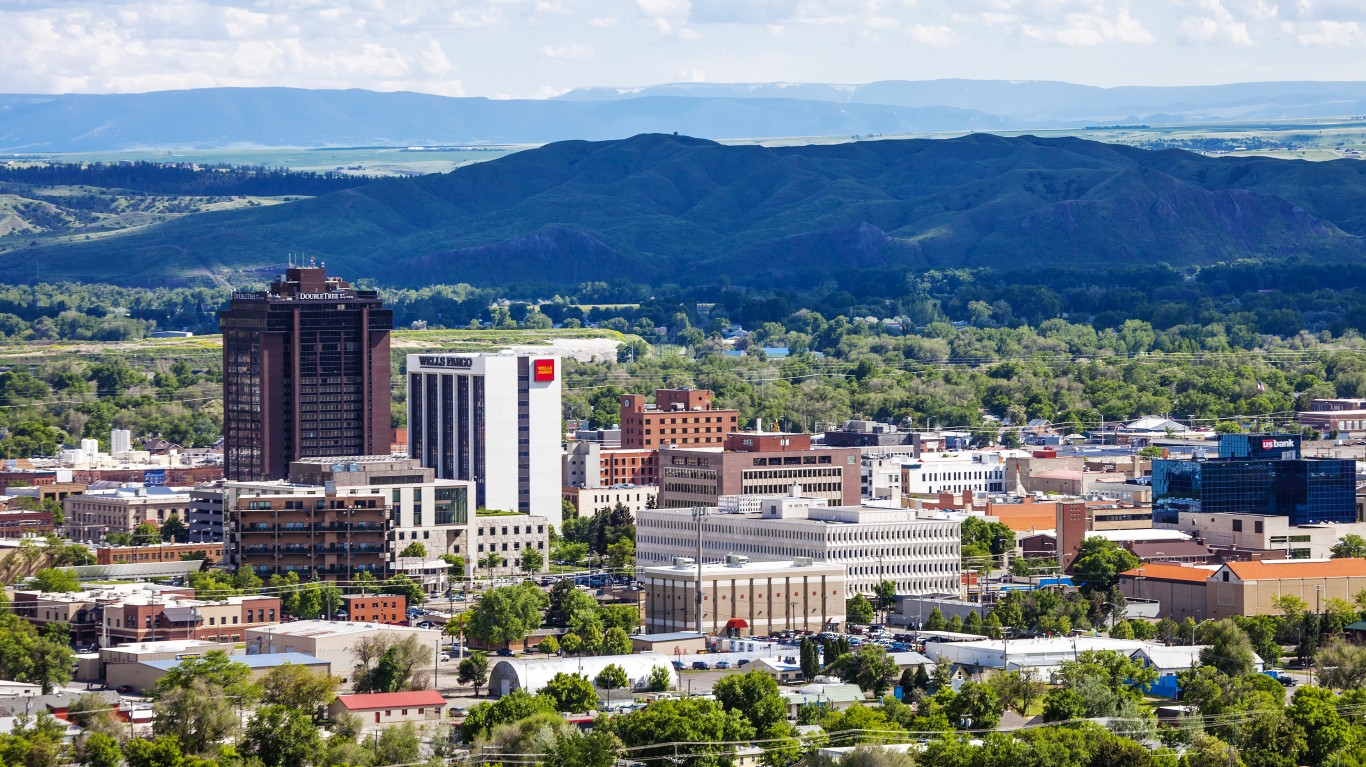
42. Montana
> Births, July 2020 to July 2021: 9.7 per 1,000 residents (10,502 total)
> Population change due to new births, July 2020 to July 2021: +1.0%
> Total population change, July 2020 to July 2021: +1.7%
> Total population, July 2021: 1,104,271
[in-text-ad-2]

41. Florida
> Births, July 2020 to July 2021: 9.7 per 1,000 residents (210,305 total)
> Population change due to new births, July 2020 to July 2021: +1.0%
> Total population change, July 2020 to July 2021: +1.0%
> Total population, July 2021: 21,781,128

40. Pennsylvania
> Births, July 2020 to July 2021: 9.9 per 1,000 residents (128,351 total)
> Population change due to new births, July 2020 to July 2021: +1.0%
> Total population change, July 2020 to July 2021: -0.2%
> Total population, July 2021: 12,964,056
[in-text-ad]

39. Michigan
> Births, July 2020 to July 2021: 10.2 per 1,000 residents (102,983 total)
> Population change due to new births, July 2020 to July 2021: +1.0%
> Total population change, July 2020 to July 2021: -0.2%
> Total population, July 2021: 10,050,811

38. Wisconsin
> Births, July 2020 to July 2021: 10.3 per 1,000 residents (60,404 total)
> Population change due to new births, July 2020 to July 2021: +1.0%
> Total population change, July 2020 to July 2021: +0.1%
> Total population, July 2021: 5,895,908

37. New Jersey
> Births, July 2020 to July 2021: 10.3 per 1,000 residents (95,254 total)
> Population change due to new births, July 2020 to July 2021: +1.0%
> Total population change, July 2020 to July 2021: -0.1%
> Total population, July 2021: 9,267,130
[in-text-ad-2]

36. New Mexico
> Births, July 2020 to July 2021: 10.4 per 1,000 residents (21,996 total)
> Population change due to new births, July 2020 to July 2021: +1.0%
> Total population change, July 2020 to July 2021: -0.1%
> Total population, July 2021: 2,115,877

35. Delaware
> Births, July 2020 to July 2021: 10.4 per 1,000 residents (10,311 total)
> Population change due to new births, July 2020 to July 2021: +1.0%
> Total population change, July 2020 to July 2021: +1.2%
> Total population, July 2021: 1,003,384
[in-text-ad]

34. Illinois
> Births, July 2020 to July 2021: 10.4 per 1,000 residents (133,097 total)
> Population change due to new births, July 2020 to July 2021: +1.0%
> Total population change, July 2020 to July 2021: -0.9%
> Total population, July 2021: 12,671,469

33. New York
> Births, July 2020 to July 2021: 10.5 per 1,000 residents (210,640 total)
> Population change due to new births, July 2020 to July 2021: +1.0%
> Total population change, July 2020 to July 2021: -1.6%
> Total population, July 2021: 19,835,913

32. Colorado
> Births, July 2020 to July 2021: 10.5 per 1,000 residents (60,675 total)
> Population change due to new births, July 2020 to July 2021: +1.0%
> Total population change, July 2020 to July 2021: +0.5%
> Total population, July 2021: 5,812,069
[in-text-ad-2]

31. Washington
> Births, July 2020 to July 2021: 10.5 per 1,000 residents (81,193 total)
> Population change due to new births, July 2020 to July 2021: +1.1%
> Total population change, July 2020 to July 2021: +0.3%
> Total population, July 2021: 7,738,692

30. Arizona
> Births, July 2020 to July 2021: 10.7 per 1,000 residents (76,497 total)
> Population change due to new births, July 2020 to July 2021: +1.1%
> Total population change, July 2020 to July 2021: +1.4%
> Total population, July 2021: 7,276,316
[in-text-ad]

29. South Carolina
> Births, July 2020 to July 2021: 10.7 per 1,000 residents (54,713 total)
> Population change due to new births, July 2020 to July 2021: +1.1%
> Total population change, July 2020 to July 2021: +1.2%
> Total population, July 2021: 5,190,705

28. California
> Births, July 2020 to July 2021: 10.7 per 1,000 residents (424,333 total)
> Population change due to new births, July 2020 to July 2021: +1.1%
> Total population change, July 2020 to July 2021: -0.7%
> Total population, July 2021: 39,237,836
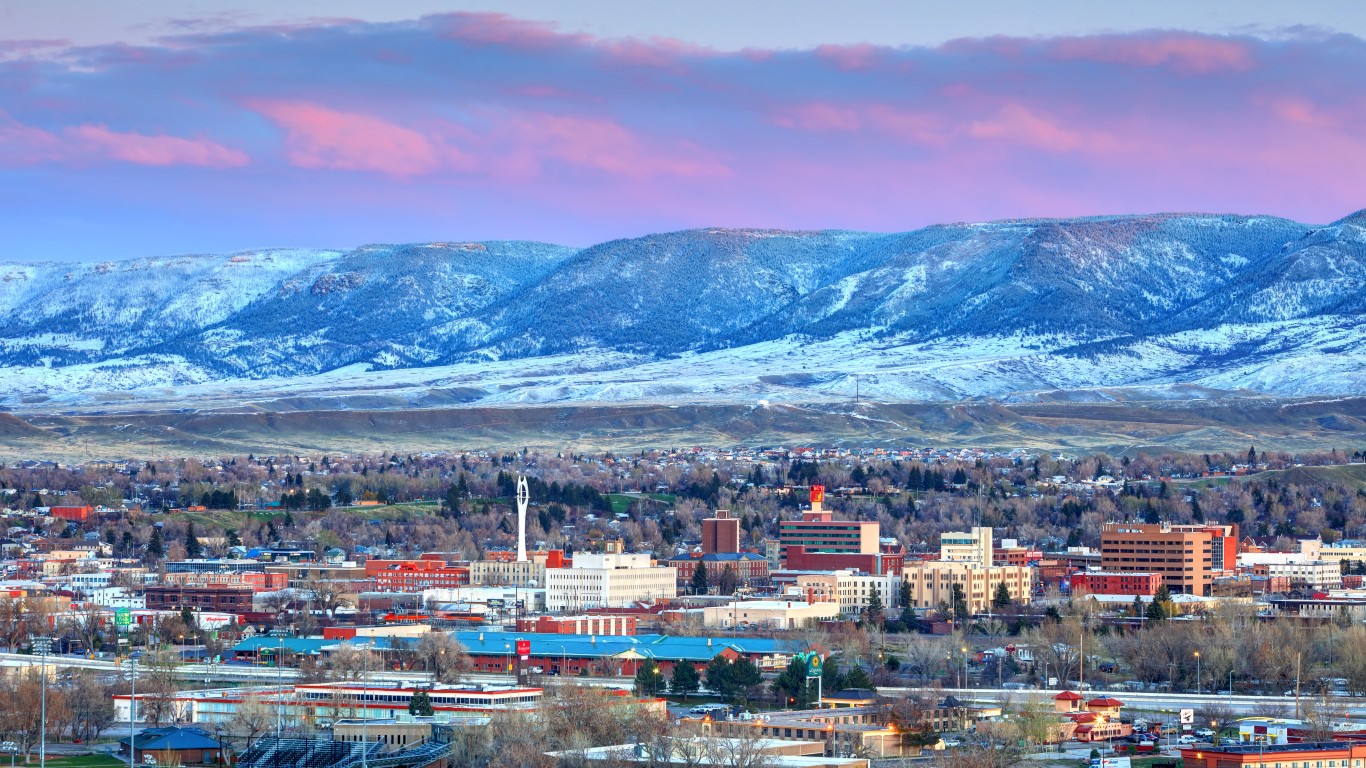
27. Wyoming
> Births, July 2020 to July 2021: 10.8 per 1,000 residents (6,213 total)
> Population change due to new births, July 2020 to July 2021: +1.1%
> Total population change, July 2020 to July 2021: +0.3%
> Total population, July 2021: 578,803
[in-text-ad-2]

26. Virginia
> Births, July 2020 to July 2021: 10.8 per 1,000 residents (93,037 total)
> Population change due to new births, July 2020 to July 2021: +1.1%
> Total population change, July 2020 to July 2021: +0.1%
> Total population, July 2021: 8,642,274

25. Maryland
> Births, July 2020 to July 2021: 10.8 per 1,000 residents (66,906 total)
> Population change due to new births, July 2020 to July 2021: +1.1%
> Total population change, July 2020 to July 2021: -0.1%
> Total population, July 2021: 6,165,129
[in-text-ad]

24. Nevada
> Births, July 2020 to July 2021: 10.9 per 1,000 residents (33,883 total)
> Population change due to new births, July 2020 to July 2021: +1.1%
> Total population change, July 2020 to July 2021: +1.0%
> Total population, July 2021: 3,143,991

23. North Carolina
> Births, July 2020 to July 2021: 10.9 per 1,000 residents (114,011 total)
> Population change due to new births, July 2020 to July 2021: +1.1%
> Total population change, July 2020 to July 2021: +0.9%
> Total population, July 2021: 10,551,162

22. Ohio
> Births, July 2020 to July 2021: 10.9 per 1,000 residents (128,595 total)
> Population change due to new births, July 2020 to July 2021: +1.1%
> Total population change, July 2020 to July 2021: -0.1%
> Total population, July 2021: 11,780,017
[in-text-ad-2]

21. Hawaii
> Births, July 2020 to July 2021: 11.0 per 1,000 residents (15,904 total)
> Population change due to new births, July 2020 to July 2021: +1.1%
> Total population change, July 2020 to July 2021: -0.7%
> Total population, July 2021: 1,441,553

20. Minnesota
> Births, July 2020 to July 2021: 11.1 per 1,000 residents (63,065 total)
> Population change due to new births, July 2020 to July 2021: +1.1%
> Total population change, July 2020 to July 2021: +0.0%
> Total population, July 2021: 5,707,390
[in-text-ad]

19. Tennessee
> Births, July 2020 to July 2021: 11.2 per 1,000 residents (77,353 total)
> Population change due to new births, July 2020 to July 2021: +1.1%
> Total population change, July 2020 to July 2021: +0.8%
> Total population, July 2021: 6,975,218

18. Missouri
> Births, July 2020 to July 2021: 11.2 per 1,000 residents (68,818 total)
> Population change due to new births, July 2020 to July 2021: +1.1%
> Total population change, July 2020 to July 2021: +0.2%
> Total population, July 2021: 6,168,187

17. Alabama
> Births, July 2020 to July 2021: 11.2 per 1,000 residents (56,320 total)
> Population change due to new births, July 2020 to July 2021: +1.1%
> Total population change, July 2020 to July 2021: +0.3%
> Total population, July 2021: 5,039,877
[in-text-ad-2]

16. Iowa
> Births, July 2020 to July 2021: 11.2 per 1,000 residents (35,771 total)
> Population change due to new births, July 2020 to July 2021: +1.1%
> Total population change, July 2020 to July 2021: +0.1%
> Total population, July 2021: 3,193,079

15. Kentucky
> Births, July 2020 to July 2021: 11.3 per 1,000 residents (50,725 total)
> Population change due to new births, July 2020 to July 2021: +1.1%
> Total population change, July 2020 to July 2021: +0.1%
> Total population, July 2021: 4,509,394
[in-text-ad]

14. Georgia
> Births, July 2020 to July 2021: 11.3 per 1,000 residents (121,269 total)
> Population change due to new births, July 2020 to July 2021: +1.1%
> Total population change, July 2020 to July 2021: +0.7%
> Total population, July 2021: 10,799,566

13. Indiana
> Births, July 2020 to July 2021: 11.4 per 1,000 residents (77,598 total)
> Population change due to new births, July 2020 to July 2021: +1.1%
> Total population change, July 2020 to July 2021: +0.3%
> Total population, July 2021: 6,805,985

12. Kansas
> Births, July 2020 to July 2021: 11.5 per 1,000 residents (33,670 total)
> Population change due to new births, July 2020 to July 2021: +1.1%
> Total population change, July 2020 to July 2021: +0.0%
> Total population, July 2021: 2,934,582
[in-text-ad-2]

11. Idaho
> Births, July 2020 to July 2021: 11.5 per 1,000 residents (21,316 total)
> Population change due to new births, July 2020 to July 2021: +1.2%
> Total population change, July 2020 to July 2021: +2.9%
> Total population, July 2021: 1,900,923

10. Arkansas
> Births, July 2020 to July 2021: 11.6 per 1,000 residents (35,021 total)
> Population change due to new births, July 2020 to July 2021: +1.2%
> Total population change, July 2020 to July 2021: +0.5%
> Total population, July 2021: 3,025,891
[in-text-ad]

9. Mississippi
> Births, July 2020 to July 2021: 11.8 per 1,000 residents (34,957 total)
> Population change due to new births, July 2020 to July 2021: +1.2%
> Total population change, July 2020 to July 2021: -0.2%
> Total population, July 2021: 2,949,965

8. Oklahoma
> Births, July 2020 to July 2021: 11.9 per 1,000 residents (47,125 total)
> Population change due to new births, July 2020 to July 2021: +1.2%
> Total population change, July 2020 to July 2021: +0.6%
> Total population, July 2021: 3,986,639

7. Nebraska
> Births, July 2020 to July 2021: 12.0 per 1,000 residents (23,524 total)
> Population change due to new births, July 2020 to July 2021: +1.2%
> Total population change, July 2020 to July 2021: +0.1%
> Total population, July 2021: 1,963,692
[in-text-ad-2]

6. Louisiana
> Births, July 2020 to July 2021: 12.0 per 1,000 residents (55,942 total)
> Population change due to new births, July 2020 to July 2021: +1.2%
> Total population change, July 2020 to July 2021: -0.6%
> Total population, July 2021: 4,624,047

5. South Dakota
> Births, July 2020 to July 2021: 12.2 per 1,000 residents (10,843 total)
> Population change due to new births, July 2020 to July 2021: +1.2%
> Total population change, July 2020 to July 2021: +0.9%
> Total population, July 2021: 895,376
[in-text-ad]

4. Texas
> Births, July 2020 to July 2021: 12.4 per 1,000 residents (362,450 total)
> Population change due to new births, July 2020 to July 2021: +1.2%
> Total population change, July 2020 to July 2021: +1.1%
> Total population, July 2021: 29,527,941

3. North Dakota
> Births, July 2020 to July 2021: 12.6 per 1,000 residents (9,798 total)
> Population change due to new births, July 2020 to July 2021: +1.3%
> Total population change, July 2020 to July 2021: -0.5%
> Total population, July 2021: 774,948

2. Alaska
> Births, July 2020 to July 2021: 12.7 per 1,000 residents (9,280 total)
> Population change due to new births, July 2020 to July 2021: +1.3%
> Total population change, July 2020 to July 2021: +0.0%
> Total population, July 2021: 732,673
[in-text-ad-2]

1. Utah
> Births, July 2020 to July 2021: 13.8 per 1,000 residents (45,159 total)
> Population change due to new births, July 2020 to July 2021: +1.4%
> Total population change, July 2020 to July 2021: +1.7%
> Total population, July 2021: 3,337,975
Get Ready To Retire (Sponsored)
Start by taking a quick retirement quiz from SmartAsset that will match you with up to 3 financial advisors that serve your area and beyond in 5 minutes, or less.
Each advisor has been vetted by SmartAsset and is held to a fiduciary standard to act in your best interests.
Here’s how it works:
1. Answer SmartAsset advisor match quiz
2. Review your pre-screened matches at your leisure. Check out the advisors’ profiles.
3. Speak with advisors at no cost to you. Have an introductory call on the phone or introduction in person and choose whom to work with in the future
Thank you for reading! Have some feedback for us?
Contact the 24/7 Wall St. editorial team.
 24/7 Wall St.
 24/7 Wall St.
 24/7 Wall St.


