
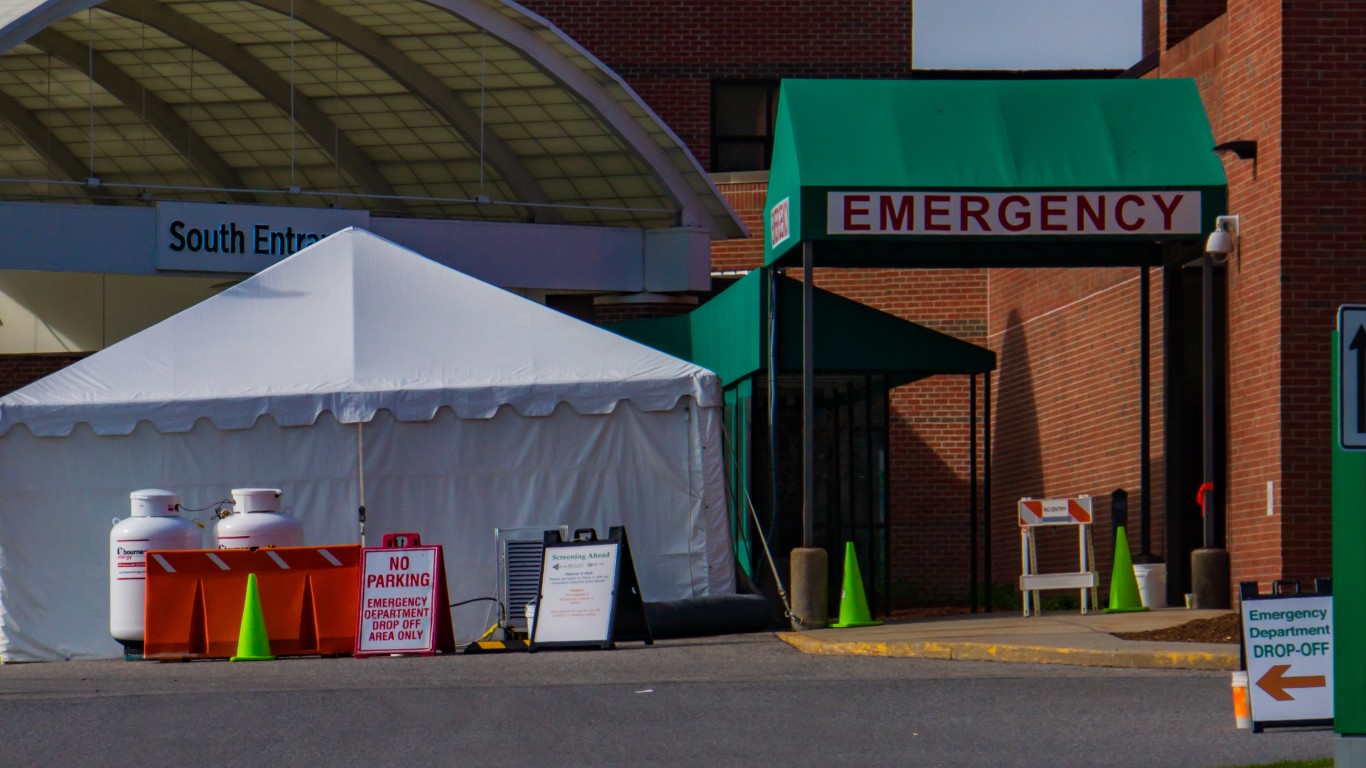
Another wave of COVID-19 infections recently began in America — the fourth by most measures. It has been triggered, primarily, by the new omicron variant, which currently accounts for the vast majority of new cases in the U.S. Its spread outside this country has been extraordinary, overwhelming the U.K. and accounting for a remarkable surge in London.
In the U.S. cases are also spreading fast, with the daily average up over 133% nationwide over the past 14 days to an average of 803,736 cases a day, or 242 daily cases per 100,000 people, according to The New York Times. In some states, the situation is far worse, and the most dangerous state for COVID-19 is Rhode Island.
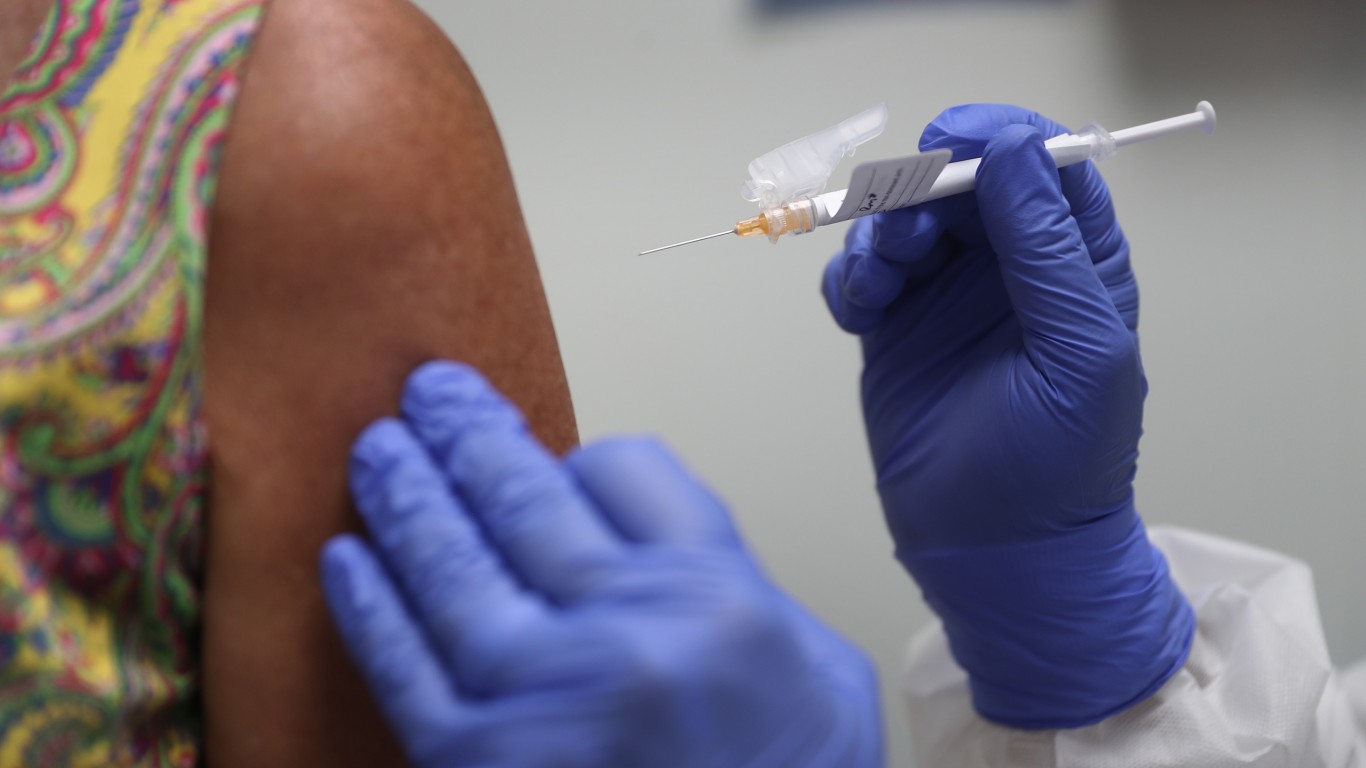
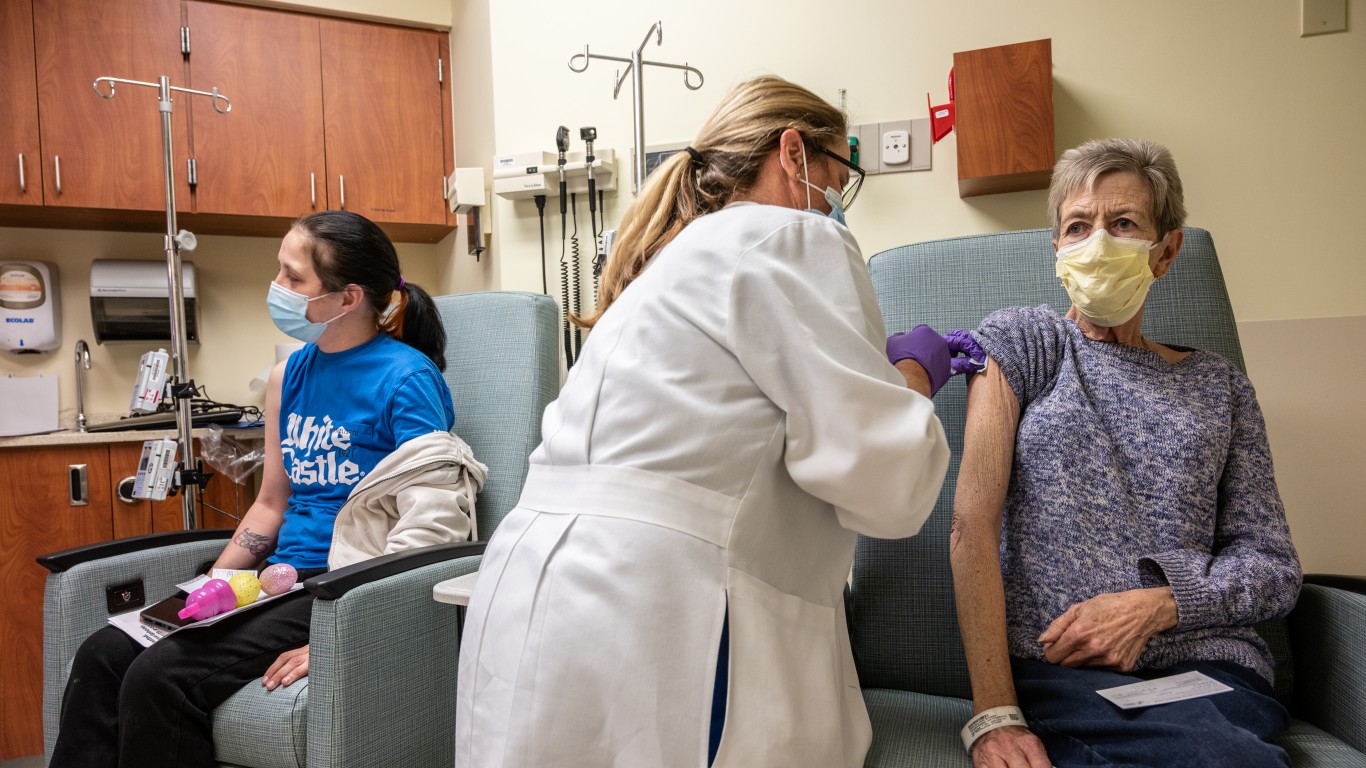
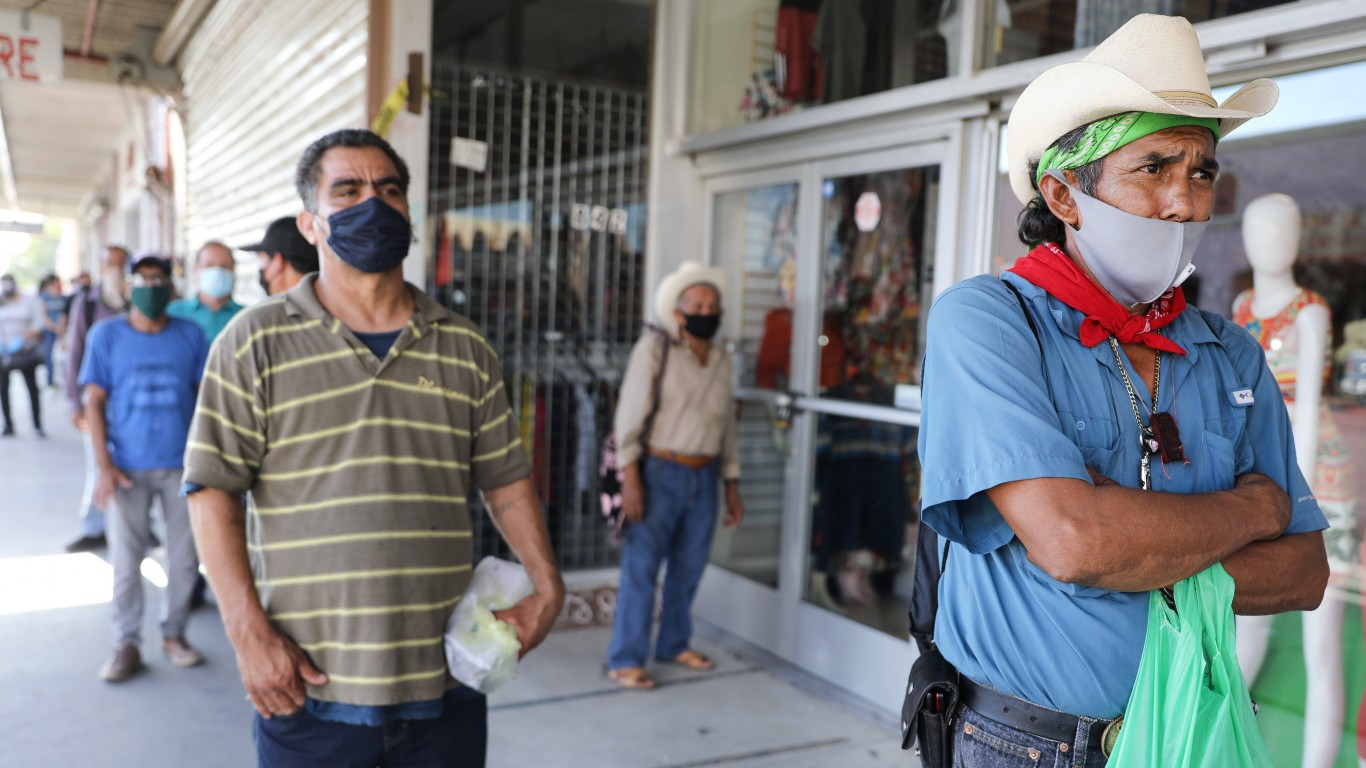
The U.S. is in for a brutal winter in terms of the pandemic, perhaps worse than the period last December and January. Omicron spreads more rapidly than earlier variants, and people have recently gathered together in airports, indoor venues, and their homes during the holidays. In addition, a large portion of the population is not vaccinated.
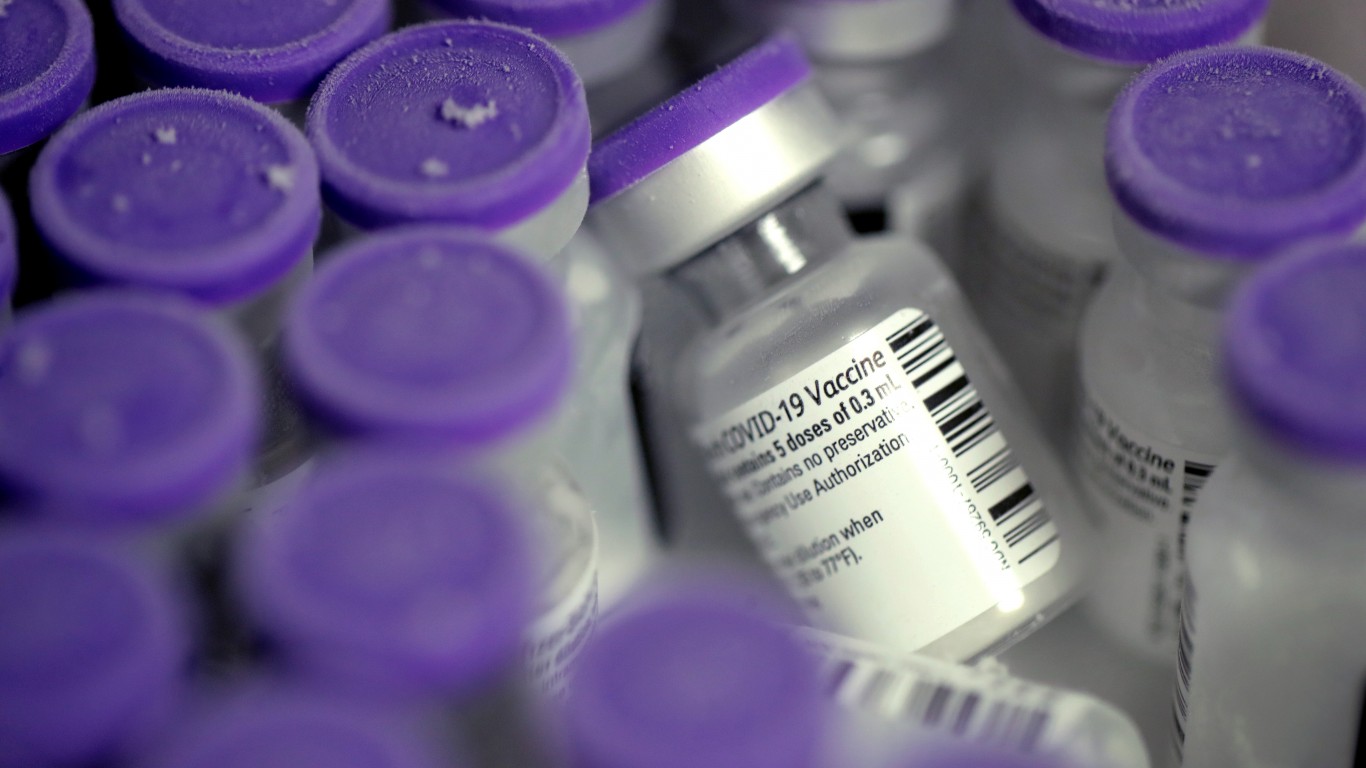
There also appear to be more breakthrough cases with this variant. These cases involve infection among those who are fully vaccinated, including having had a booster. The previous peak of daily cases was above 250,000 a day last January. This peak has been broken.
There are several ways to measure how dangerous a geographic area is. Among these are new cases, deaths, hospitalizations, and vaccinations. And these can be measured by averages over seven- or 14-day periods. For vaccinations, the yardstick is the percentage of the population that has received a shot, or two, or three. (These are the states where the most people are vaccinated.)
To find the most dangerous state, 24/7 Wall St. chose the measure of average daily cases over the most recent seven days per 100,000, using data from federal, state, and local sources as of Jan. 13.
The state with the highest seven-day average of daily cases per 100,000 people is Rhode Island at 507.8. This figure is 266% higher what it was 14 days ago. The daily average of the past seven days in the state is 5,369 cases.
Behind Rhode Island are New York, with 70,000 average daily cases over the past seven days, or 358.2 cases per 100,000 people. Next is Massachusetts, with a seven-day average of daily cases of 24,722, which also translates to 358.2 per 100,000.
Rhode Island does not rank first in terms of 14-day change, however. The state with the highest change is South Carolina, where cases jumped a whopping 2,472% to an average of 13,022 daily cases, or 256 per 100,000.
On Thursday, President Joe Biden announced the federal government will deploy six teams of military doctors, nurses, and other medical personnel to hospitals in New York, New Jersey, Ohio, Rhode Island, Michigan, and New Mexico. As hospitalizations have been breaking all-time records as well, many U.S. hospitals have been grappling with staffing and other shortages. These are 16 states where hospitals are experiencing the worst workforce shortages.
Click here to see the most dangerous state for COVID-19

50. Idaho
> Avg. daily cases per 100,000 (past 7 days): 71.18
> Avg. daily cases (past 7 days): 1,248.71 (6th lowest)
> 14-day change: 209.96% (19th lowest)
[in-text-ad]

49. Maine
> Avg. daily cases per 100,000 (past 7 days): 74.61
> Avg. daily cases (past 7 days): 998.57 (4th lowest)
> 14-day change: 36.58% (the lowest)

48. Montana
> Avg. daily cases per 100,000 (past 7 days): 91.98
> Avg. daily cases (past 7 days): 977.14 (3rd lowest)
> 14-day change: 433.54% (6th highest)
47. Vermont
> Avg. daily cases per 100,000 (past 7 days): 104.24
> Avg. daily cases (past 7 days): 652.86 (the lowest)
> 14-day change: 68.95% (4th lowest)
[in-text-ad-2]

46. Wyoming
> Avg. daily cases per 100,000 (past 7 days): 132.66
> Avg. daily cases (past 7 days): 766.43 (2nd lowest)
> 14-day change: 430.66% (7th highest)

45. Minnesota
> Avg. daily cases per 100,000 (past 7 days): 151.04
> Avg. daily cases (past 7 days): 8,474.86 (24th lowest)
> 14-day change: 194.00% (17th lowest)
[in-text-ad]

44. New Mexico
> Avg. daily cases per 100,000 (past 7 days): 151.21
> Avg. daily cases (past 7 days): 3,168.43 (12th lowest)
> 14-day change: 278.68% (16th highest)
 24/7 Wall St.
43. Iowa
> Avg. daily cases per 100,000 (past 7 days): 155.29
> Avg. daily cases (past 7 days): 4,901.14 (15th lowest)
> 14-day change: 224.61% (25th lowest)
42. Alaska
> Avg. daily cases per 100,000 (past 7 days): 159.96
> Avg. daily cases (past 7 days): 1,179.57 (5th lowest)
> 14-day change: 684.89% (2nd highest)
[in-text-ad-2]

41. Ohio
> Avg. daily cases per 100,000 (past 7 days): 163.53
> Avg. daily cases (past 7 days): 19,115.29 (11th highest)
> 14-day change: 52.61% (2nd lowest)

40. Nebraska
> Avg. daily cases per 100,000 (past 7 days): 163.87
> Avg. daily cases (past 7 days): 3,161.57 (11th lowest)
> 14-day change: 254.38% (22nd highest)
[in-text-ad]

39. Nevada
> Avg. daily cases per 100,000 (past 7 days): 164.84
> Avg. daily cases (past 7 days): 5,001.86 (16th lowest)
> 14-day change: 311.34% (12th highest)

38. North Dakota
> Avg. daily cases per 100,000 (past 7 days): 167.95
> Avg. daily cases (past 7 days): 1,276.57 (7th lowest)
> 14-day change: 299.64% (15th highest)

37. Oregon
> Avg. daily cases per 100,000 (past 7 days): 173.00
> Avg. daily cases (past 7 days): 7,249.86 (22nd lowest)
> 14-day change: 538.27% (4th highest)
[in-text-ad-2]

36. Texas
> Avg. daily cases per 100,000 (past 7 days): 173.61
> Avg. daily cases (past 7 days): 49,830.57 (4th highest)
> 14-day change: 261.88% (21st highest)
35. Kentucky
> Avg. daily cases per 100,000 (past 7 days): 180.02
> Avg. daily cases (past 7 days): 8,044.00 (23rd lowest)
> 14-day change: 229.58% (25th highest)
[in-text-ad]

34. Oklahoma
> Avg. daily cases per 100,000 (past 7 days): 182.21
> Avg. daily cases (past 7 days): 7,184.86 (21st lowest)
> 14-day change: 428.52% (8th highest)
 24/7 Wall St.
33. West Virginia
> Avg. daily cases per 100,000 (past 7 days): 182.73
> Avg. daily cases (past 7 days): 3,299.71 (13th lowest)
> 14-day change: 223.18% (23rd lowest)
32. Arizona
> Avg. daily cases per 100,000 (past 7 days): 186.78
> Avg. daily cases (past 7 days): 13,395.29 (17th highest)
> 14-day change: 302.57% (13th highest)
[in-text-ad-2]

31. Michigan
> Avg. daily cases per 100,000 (past 7 days): 187.36
> Avg. daily cases (past 7 days): 18,728.71 (12th highest)
> 14-day change: 132.68% (10th lowest)

30. Missouri
> Avg. daily cases per 100,000 (past 7 days): 187.72
> Avg. daily cases (past 7 days): 11,500.86 (23rd highest)
> 14-day change: 223.04% (22nd lowest)
[in-text-ad]

29. Washington
> Avg. daily cases per 100,000 (past 7 days): 196.22
> Avg. daily cases (past 7 days): 14,786.00 (14th highest)
> 14-day change: 246.75% (23rd highest)

28. Indiana
> Avg. daily cases per 100,000 (past 7 days): 196.34
> Avg. daily cases (past 7 days): 13,138.86 (19th highest)
> 14-day change: 198.06% (18th lowest)

27. South Dakota
> Avg. daily cases per 100,000 (past 7 days): 197.13
> Avg. daily cases (past 7 days): 1,739.14 (8th lowest)
> 14-day change: 356.30% (10th highest)
[in-text-ad-2]
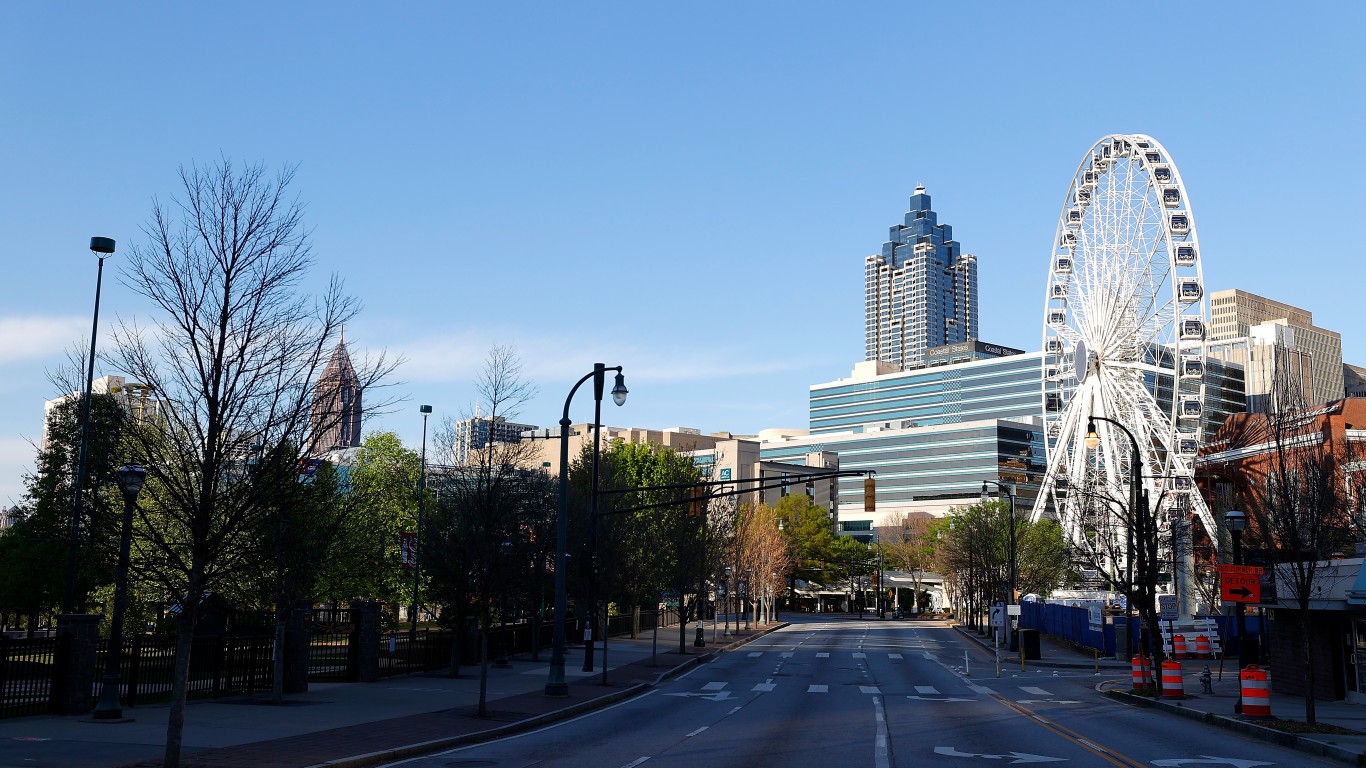
26. Georgia
> Avg. daily cases per 100,000 (past 7 days): 197.20
> Avg. daily cases (past 7 days): 20,744.14 (10th highest)
> 14-day change: 118.64% (9th lowest)

25. Maryland
> Avg. daily cases per 100,000 (past 7 days): 201.23
> Avg. daily cases (past 7 days): 12,159.86 (21st highest)
> 14-day change: 55.53% (3rd lowest)
[in-text-ad]

24. Mississippi
> Avg. daily cases per 100,000 (past 7 days): 204.09
> Avg. daily cases (past 7 days): 6,095.14 (18th lowest)
> 14-day change: 301.41% (14th highest)

23. Alabama
> Avg. daily cases per 100,000 (past 7 days): 211.52
> Avg. daily cases (past 7 days): 10,338.86 (24th highest)
> 14-day change: 277.00% (17th highest)

22. Tennessee
> Avg. daily cases per 100,000 (past 7 days): 211.71
> Avg. daily cases (past 7 days): 14,332.57 (15th highest)
> 14-day change: 220.41% (21st lowest)
[in-text-ad-2]
21. Virginia
> Avg. daily cases per 100,000 (past 7 days): 215.30
> Avg. daily cases (past 7 days): 18,338.86 (13th highest)
> 14-day change: 140.85% (11th lowest)

20. Pennsylvania
> Avg. daily cases per 100,000 (past 7 days): 219.83
> Avg. daily cases (past 7 days): 28,153.29 (7th highest)
> 14-day change: 173.41% (15th lowest)
[in-text-ad]

19. Kansas
> Avg. daily cases per 100,000 (past 7 days): 221.88
> Avg. daily cases (past 7 days): 6,460.00 (19th lowest)
> 14-day change: 276.43% (18th highest)

18. North Carolina
> Avg. daily cases per 100,000 (past 7 days): 223.46
> Avg. daily cases (past 7 days): 23,203.00 (9th highest)
> 14-day change: 338.31% (11th highest)

17. New Hampshire
> Avg. daily cases per 100,000 (past 7 days): 223.64
> Avg. daily cases (past 7 days): 3,033.57 (10th lowest)
> 14-day change: 177.07% (16th lowest)
[in-text-ad-2]

16. Wisconsin
> Avg. daily cases per 100,000 (past 7 days): 226.05
> Avg. daily cases (past 7 days): 13,141.57 (18th highest)
> 14-day change: 213.46% (20th lowest)

15. Arkansas
> Avg. daily cases per 100,000 (past 7 days): 230.80
> Avg. daily cases (past 7 days): 6,955.86 (20th lowest)
> 14-day change: 455.14% (5th highest)
[in-text-ad]
14. California
> Avg. daily cases per 100,000 (past 7 days): 247.53
> Avg. daily cases (past 7 days): 97,913.86 (the highest)
> 14-day change: 395.39% (9th highest)

13. Louisiana
> Avg. daily cases per 100,000 (past 7 days): 247.69
> Avg. daily cases (past 7 days): 11,542.14 (22nd highest)
> 14-day change: 275.49% (19th highest)

12. Colorado
> Avg. daily cases per 100,000 (past 7 days): 250.30
> Avg. daily cases (past 7 days): 14,255.86 (16th highest)
> 14-day change: 244.12% (24th highest)
[in-text-ad-2]
11. Illinois
> Avg. daily cases per 100,000 (past 7 days): 252.52
> Avg. daily cases (past 7 days): 32,173.43 (5th highest)
> 14-day change: 100.57% (6th lowest)

10. South Carolina
> Avg. daily cases per 100,000 (past 7 days): 256.15
> Avg. daily cases (past 7 days): 13,022.86 (20th highest)
> 14-day change: 2,472.96% (the highest)
[in-text-ad]

9. Hawaii
> Avg. daily cases per 100,000 (past 7 days): 263.19
> Avg. daily cases (past 7 days): 3,738.57 (14th lowest)
> 14-day change: 157.35% (13th lowest)

8. Utah
> Avg. daily cases per 100,000 (past 7 days): 269.30
> Avg. daily cases (past 7 days): 8,512.71 (25th lowest)
> 14-day change: 553.53% (3rd highest)

7. Connecticut
> Avg. daily cases per 100,000 (past 7 days): 269.50
> Avg. daily cases (past 7 days): 9,628.43 (25th highest)
> 14-day change: 147.89% (12th lowest)
[in-text-ad-2]

6. Delaware
> Avg. daily cases per 100,000 (past 7 days): 277.51
> Avg. daily cases (past 7 days): 2,684.00 (9th lowest)
> 14-day change: 168.25% (14th lowest)

5. Florida
> Avg. daily cases per 100,000 (past 7 days): 307.76
> Avg. daily cases (past 7 days): 65,551.29 (3rd highest)
> 14-day change: 115.94% (8th lowest)
[in-text-ad]

4. New Jersey
> Avg. daily cases per 100,000 (past 7 days): 349.09
> Avg. daily cases (past 7 days): 31,098.43 (6th highest)
> 14-day change: 102.36% (7th lowest)

3. Massachusetts
> Avg. daily cases per 100,000 (past 7 days): 358.19
> Avg. daily cases (past 7 days): 24,722.71 (8th highest)
> 14-day change: 223.29% (24th lowest)
2. New York
> Avg. daily cases per 100,000 (past 7 days): 358.20
> Avg. daily cases (past 7 days): 70,000.86 (2nd highest)
> 14-day change: 69.86% (5th lowest)
[in-text-ad-2]
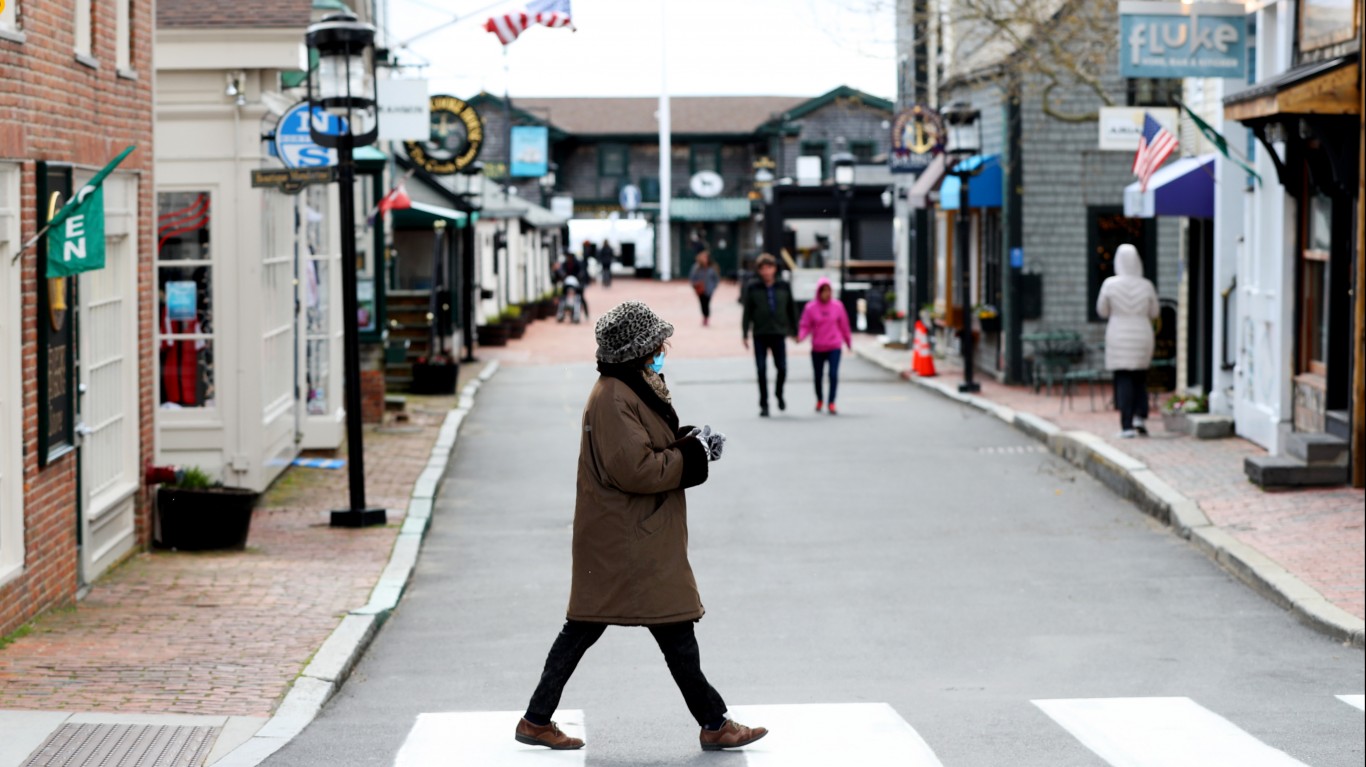
1. Rhode Island
> Avg. daily cases per 100,000 (past 7 days): 507.80
> Avg. daily cases (past 7 days): 5,369.00 (17th lowest)
> 14-day change: 266.48% (20th highest)
Thank you for reading! Have some feedback for us?
Contact the 24/7 Wall St. editorial team.
Latest from 24/7