
The U.S. is in for a brutal winter of COVID-19 infections. The current wave has been triggered, primarily, by the omicron variant, which currently accounts for the vast majority of new cases in the U.S. Omicron spreads more rapidly than earlier variants, and people have gathered in airports, indoor venues, and in their homes during the holidays. In addition, a large portion of the population is not vaccinated. (These are the states where the most people are vaccinated.)
There also appear to be more breakthrough cases with this variant. These cases involve infection among those who are fully vaccinated, including having had a booster. While omicron is said to cause milder disease, the sheer number of cases means hospitalizations and deaths are climbing nationwide. The deadliest state for COVID-19 is Indiana.
Nationwide, the average of daily deaths is 0.56 per 100,000 people, or 1,873 COVID-19-realted deaths per day, according to The New York Times.
There are several ways to measure how dangerous or deadly a geographic area is. Among these are new cases, deaths, hospitalizations, and vaccinations. And, these can be measured by averages over seven- or 14-day periods. For vaccinations, the yardstick is the percentage of the population that has received a shot, or two, or three.
To find the deadliest state for COVID-19, 24/7 Wall St. chose the measure of average daily deaths over the most recent seven days per 100,000, using data from federal, state, and local sources as of Jan. 13.
The death rate in Indiana is the highest at 1.39 average daily deaths per 100,000 people. That is a seven-day average of 93 deaths a day. Indiana is followed by Delaware at 1.29 per 100,000, or 12 deaths a day. Next, Pennsylvania has a figure of 1.04 per 100,000, or 133 deaths per day.
Indiana moved several schools to e-learning because of the alarming spread of omicron. More concerning is that as statewide COVID-19 hospitalizations continue to surpass previous highs, some hospitals are saying they are running low on treatments that prevent severe illness.
Fox59 reports that “This set back in supply means area hospitals are now forced to restrict who is eligible to receive the life-saving treatment.” In addition to supplies, some states are experiencing medical staff shortages. These are 16 states where hospitals are experiencing the worst workforce shortages.
Click here to see this is the deadliest state for COVID-19
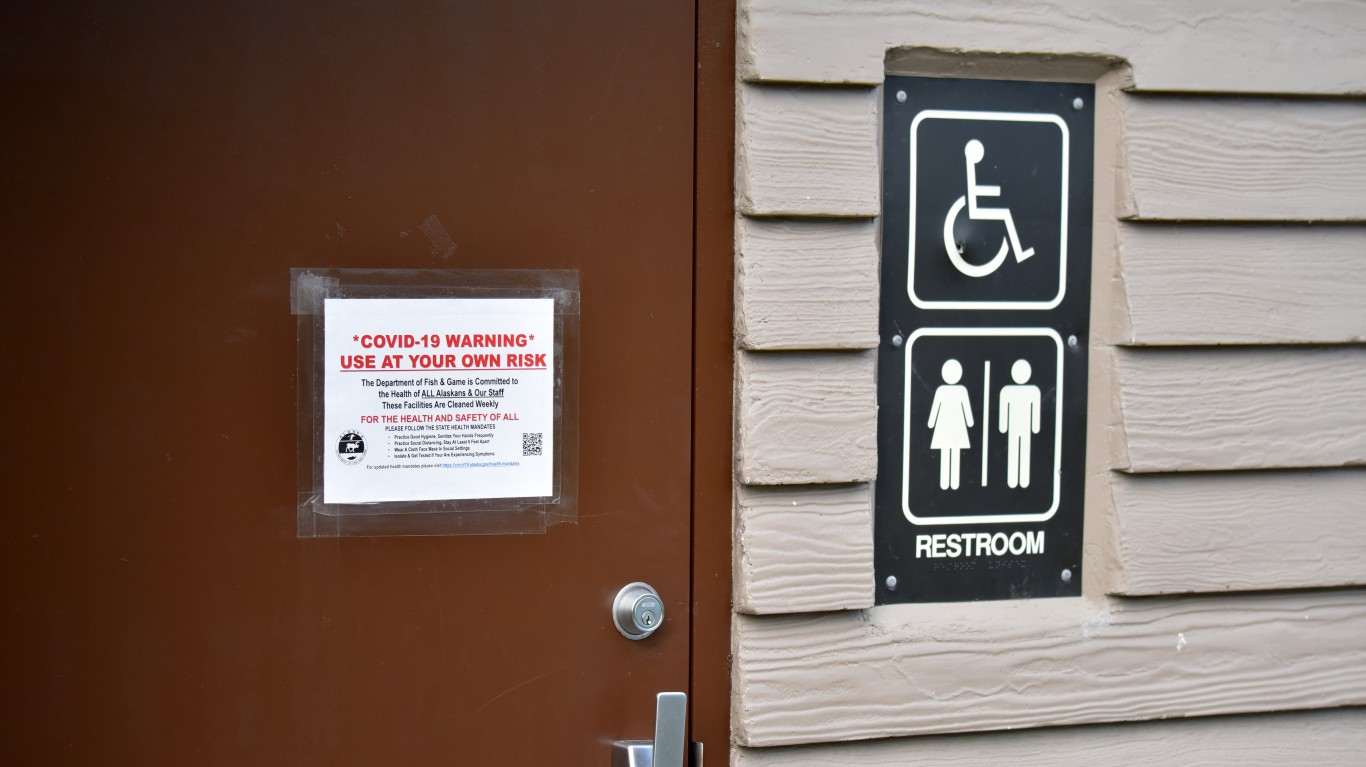
50. Alaska
> Avg. daily deaths per 100,000 people (past 7 days): 0.02
> Avg. daily deaths (past 7 days): 0.14 (2nd lowest)
[in-text-ad]

49. Vermont
> Avg. daily deaths per 100,000 people (past 7 days): 0.02
> Avg. daily deaths (past 7 days): 0.14 (2nd lowest)

48. Hawaii
> Avg. daily deaths per 100,000 people (past 7 days): 0.11
> Avg. daily deaths (past 7 days): 1.57 (3rd lowest)

47. Florida
> Avg. daily deaths per 100,000 people (past 7 days): 0.19
> Avg. daily deaths (past 7 days): 39.57 (15th highest)
[in-text-ad-2]

46. Virginia
> Avg. daily deaths per 100,000 people (past 7 days): 0.20
> Avg. daily deaths (past 7 days): 17.00 (23rd lowest)

45. Montana
> Avg. daily deaths per 100,000 people (past 7 days): 0.22
> Avg. daily deaths (past 7 days): 2.29 (5th lowest)
[in-text-ad]

44. Washington
> Avg. daily deaths per 100,000 people (past 7 days): 0.23
> Avg. daily deaths (past 7 days): 17.00 (23rd lowest)

43. California
> Avg. daily deaths per 100,000 people (past 7 days): 0.23
> Avg. daily deaths (past 7 days): 91.43 (7th highest)

42. Louisiana
> Avg. daily deaths per 100,000 people (past 7 days): 0.26
> Avg. daily deaths (past 7 days): 12.00 (14th lowest)
[in-text-ad-2]
41. North Carolina
> Avg. daily deaths per 100,000 people (past 7 days): 0.29
> Avg. daily deaths (past 7 days): 30.29 (19th highest)
40. New Hampshire
> Avg. daily deaths per 100,000 people (past 7 days): 0.29
> Avg. daily deaths (past 7 days): 4.00 (7th lowest)
[in-text-ad]
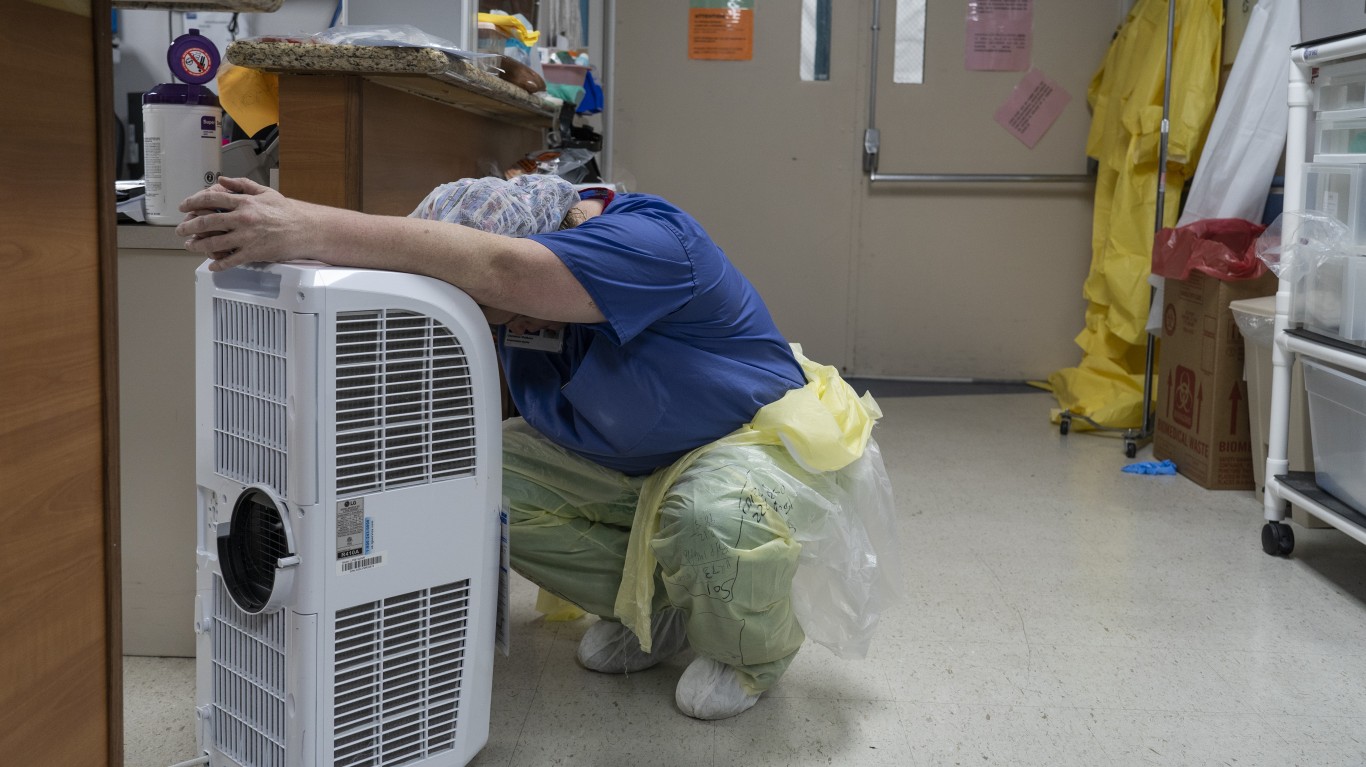
39. Texas
> Avg. daily deaths per 100,000 people (past 7 days): 0.30
> Avg. daily deaths (past 7 days): 85.86 (8th highest)
38. Oklahoma
> Avg. daily deaths per 100,000 people (past 7 days): 0.33
> Avg. daily deaths (past 7 days): 12.86 (16th lowest)
37. North Dakota
> Avg. daily deaths per 100,000 people (past 7 days): 0.34
> Avg. daily deaths (past 7 days): 2.57 (6th lowest)
[in-text-ad-2]

36. Georgia
> Avg. daily deaths per 100,000 people (past 7 days): 0.34
> Avg. daily deaths (past 7 days): 35.71 (16th highest)

35. Mississippi
> Avg. daily deaths per 100,000 people (past 7 days): 0.34
> Avg. daily deaths (past 7 days): 10.14 (13th lowest)
[in-text-ad]

34. Kansas
> Avg. daily deaths per 100,000 people (past 7 days): 0.34
> Avg. daily deaths (past 7 days): 10.00 (12th lowest)
33. Oregon
> Avg. daily deaths per 100,000 people (past 7 days): 0.35
> Avg. daily deaths (past 7 days): 14.86 (19th lowest)

32. South Carolina
> Avg. daily deaths per 100,000 people (past 7 days): 0.37
> Avg. daily deaths (past 7 days): 18.57 (25th lowest)
[in-text-ad-2]

31. Wyoming
> Avg. daily deaths per 100,000 people (past 7 days): 0.40
> Avg. daily deaths (past 7 days): 2.29 (5th lowest)

30. Alabama
> Avg. daily deaths per 100,000 people (past 7 days): 0.40
> Avg. daily deaths (past 7 days): 19.71 (25th highest)
[in-text-ad]

29. Maine
> Avg. daily deaths per 100,000 people (past 7 days): 0.44
> Avg. daily deaths (past 7 days): 5.86 (9th lowest)

28. Nevada
> Avg. daily deaths per 100,000 people (past 7 days): 0.44
> Avg. daily deaths (past 7 days): 13.29 (18th lowest)
27. Idaho
> Avg. daily deaths per 100,000 people (past 7 days): 0.45
> Avg. daily deaths (past 7 days): 7.86 (11th lowest)
[in-text-ad-2]

26. Colorado
> Avg. daily deaths per 100,000 people (past 7 days): 0.48
> Avg. daily deaths (past 7 days): 27.57 (20th highest)

25. South Dakota
> Avg. daily deaths per 100,000 people (past 7 days): 0.49
> Avg. daily deaths (past 7 days): 4.29 (8th lowest)
[in-text-ad]

24. Tennessee
> Avg. daily deaths per 100,000 people (past 7 days): 0.50
> Avg. daily deaths (past 7 days): 33.86 (18th highest)

23. Utah
> Avg. daily deaths per 100,000 people (past 7 days): 0.50
> Avg. daily deaths (past 7 days): 15.86 (21st lowest)
22. Arkansas
> Avg. daily deaths per 100,000 people (past 7 days): 0.52
> Avg. daily deaths (past 7 days): 15.71 (20th lowest)
[in-text-ad-2]

21. Kentucky
> Avg. daily deaths per 100,000 people (past 7 days): 0.57
> Avg. daily deaths (past 7 days): 25.57 (22nd highest)

20. Minnesota
> Avg. daily deaths per 100,000 people (past 7 days): 0.61
> Avg. daily deaths (past 7 days): 34.00 (17th highest)
[in-text-ad]

19. Connecticut
> Avg. daily deaths per 100,000 people (past 7 days): 0.64
> Avg. daily deaths (past 7 days): 23.00 (23rd highest)

18. Rhode Island
> Avg. daily deaths per 100,000 people (past 7 days): 0.65
> Avg. daily deaths (past 7 days): 6.86 (10th lowest)

17. Missouri
> Avg. daily deaths per 100,000 people (past 7 days): 0.66
> Avg. daily deaths (past 7 days): 40.71 (13th highest)
[in-text-ad-2]

16. Wisconsin
> Avg. daily deaths per 100,000 people (past 7 days): 0.69
> Avg. daily deaths (past 7 days): 40.14 (14th highest)

15. West Virginia
> Avg. daily deaths per 100,000 people (past 7 days): 0.72
> Avg. daily deaths (past 7 days): 13.00 (17th lowest)
[in-text-ad]

14. Massachusetts
> Avg. daily deaths per 100,000 people (past 7 days): 0.73
> Avg. daily deaths (past 7 days): 50.43 (12th highest)

13. New Jersey
> Avg. daily deaths per 100,000 people (past 7 days): 0.77
> Avg. daily deaths (past 7 days): 69.00 (9th highest)

12. Illinois
> Avg. daily deaths per 100,000 people (past 7 days): 0.80
> Avg. daily deaths (past 7 days): 102.29 (4th highest)
[in-text-ad-2]
11. Iowa
> Avg. daily deaths per 100,000 people (past 7 days): 0.82
> Avg. daily deaths (past 7 days): 26.00 (21st highest)
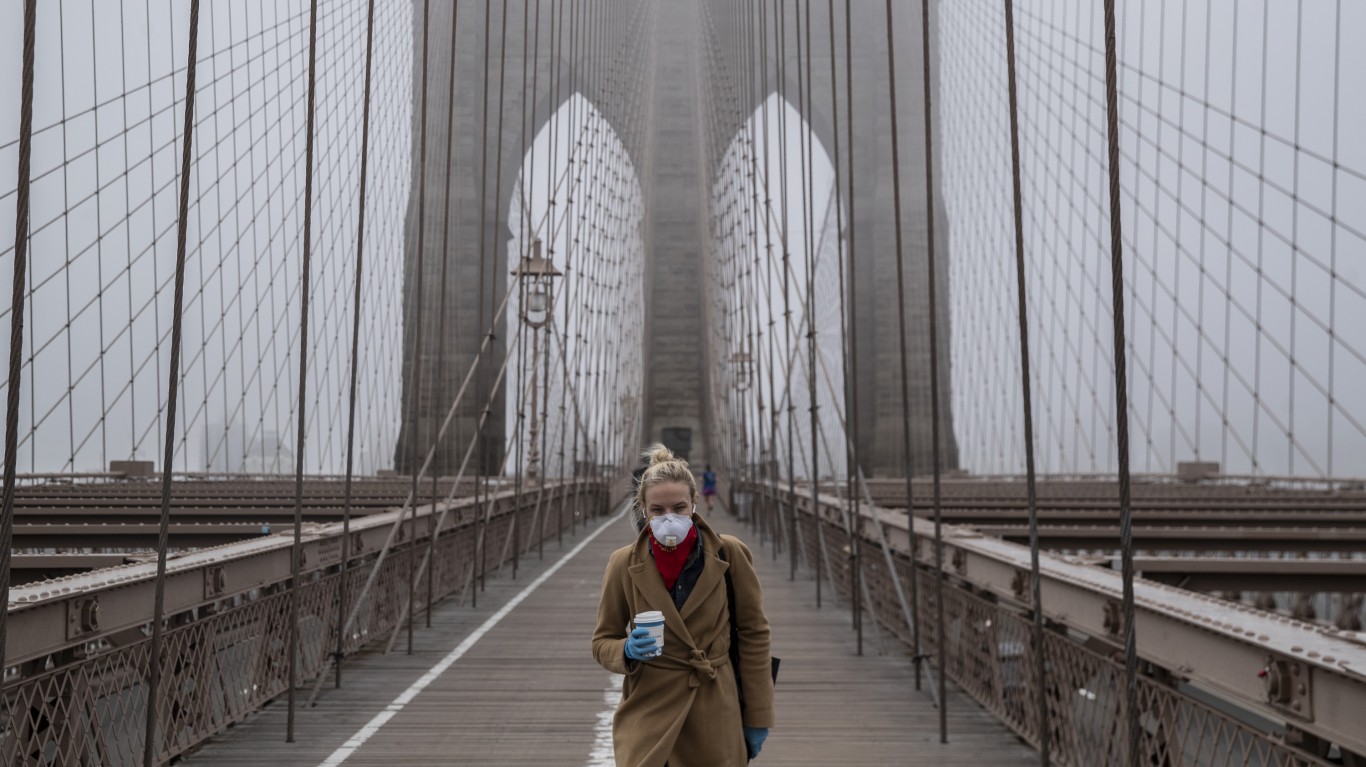
10. New York
> Avg. daily deaths per 100,000 people (past 7 days): 0.83
> Avg. daily deaths (past 7 days): 162.43 (the highest)
[in-text-ad]
9. Nebraska
> Avg. daily deaths per 100,000 people (past 7 days): 0.90
> Avg. daily deaths (past 7 days): 17.43 (24th lowest)

8. Ohio
> Avg. daily deaths per 100,000 people (past 7 days): 0.93
> Avg. daily deaths (past 7 days): 108.71 (3rd highest)

7. Arizona
> Avg. daily deaths per 100,000 people (past 7 days): 0.95
> Avg. daily deaths (past 7 days): 68.14 (10th highest)
[in-text-ad-2]

6. Michigan
> Avg. daily deaths per 100,000 people (past 7 days): 0.96
> Avg. daily deaths (past 7 days): 96.00 (5th highest)

5. Maryland
> Avg. daily deaths per 100,000 people (past 7 days): 1.00
> Avg. daily deaths (past 7 days): 60.29 (11th highest)
[in-text-ad]

4. New Mexico
> Avg. daily deaths per 100,000 people (past 7 days): 1.01
> Avg. daily deaths (past 7 days): 21.14 (24th highest)

3. Pennsylvania
> Avg. daily deaths per 100,000 people (past 7 days): 1.04
> Avg. daily deaths (past 7 days): 133.00 (2nd highest)

2. Delaware
> Avg. daily deaths per 100,000 people (past 7 days): 1.29
> Avg. daily deaths (past 7 days): 12.43 (15th lowest)
[in-text-ad-2]
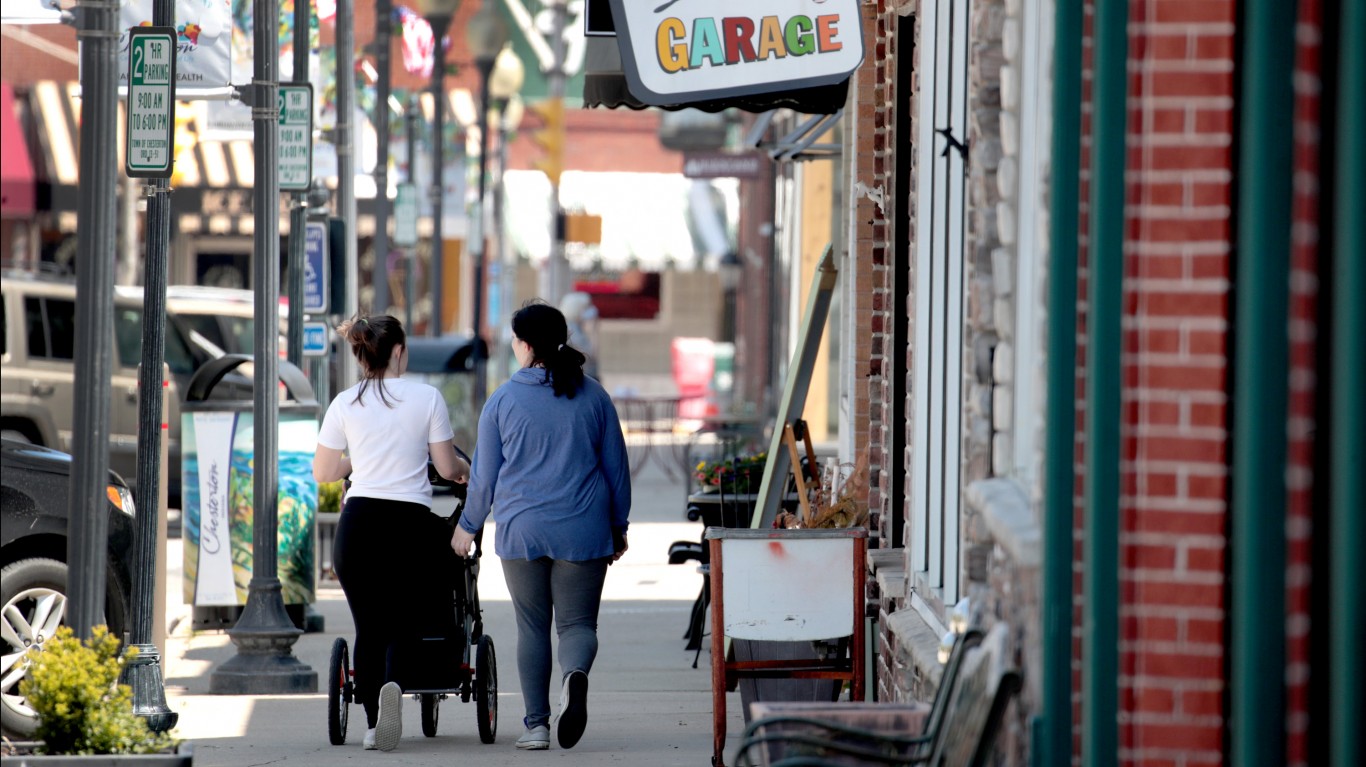
1. Indiana
> Avg. daily deaths per 100,000 people (past 7 days): 1.39
> Avg. daily deaths (past 7 days): 93.14 (6th highest)
Credit card companies are handing out rewards and benefits to win the best customers. A good cash back card can be worth thousands of dollars a year in free money, not to mention other perks like travel, insurance, and access to fancy lounges. See our top picks for the best credit cards today. You won’t want to miss some of these offers.
Flywheel Publishing has partnered with CardRatings for our coverage of credit card products. Flywheel Publishing and CardRatings may receive a commission from card issuers.
Thank you for reading! Have some feedback for us?
Contact the 24/7 Wall St. editorial team.
 24/7 Wall St.


 24/7 Wall St.

 24/7 Wall St.
