
It was hard for almost anyone in America to understand what a real pandemic would be like. Who could imagine that the nation with the most sophisticated and advanced health care system in the world could not prevent a wave of tens of millions of virus-driven cases and almost 1 million deaths? Still, even with the omicron variant, some states are safer than others, and the safest state for COVID-19 is Maine.
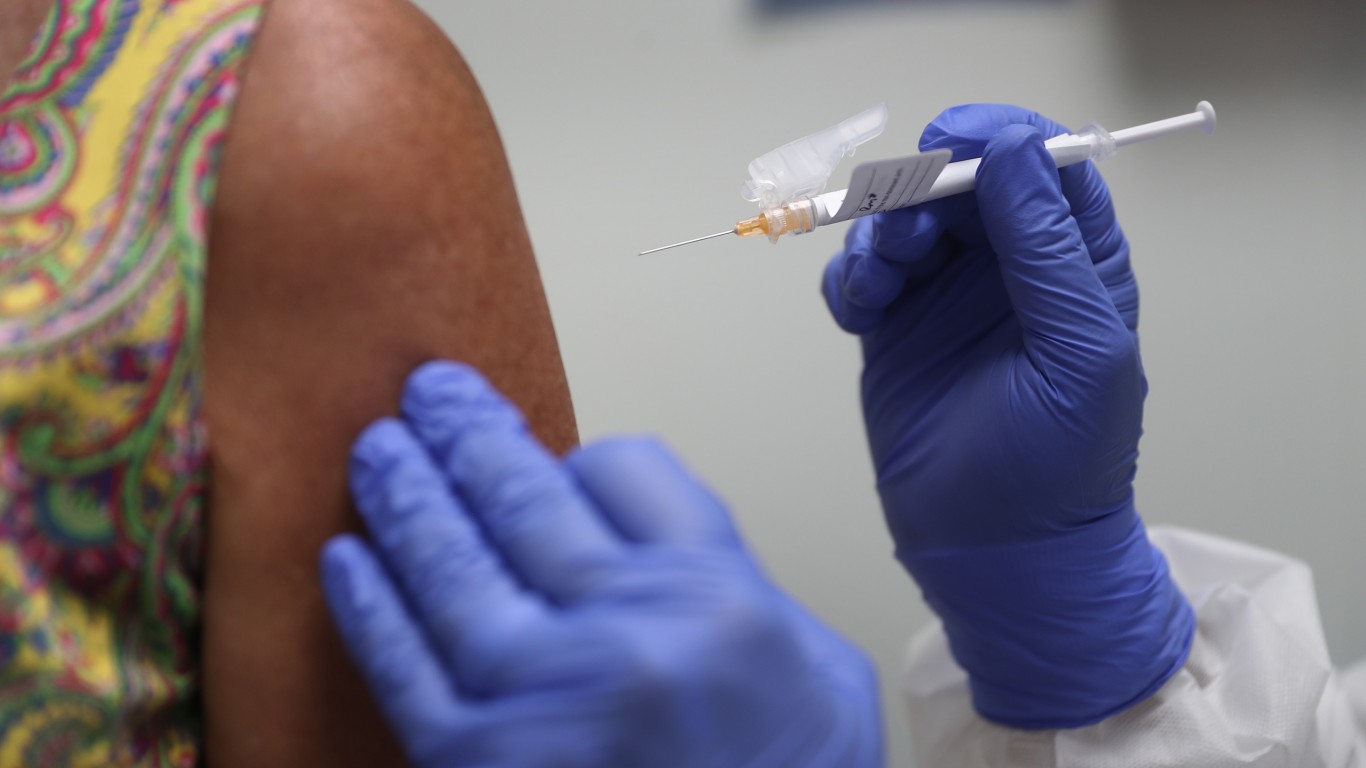
In the early days of the pandemic it was hard to imagine that the disease would come in waves, with the worst wave (the fourth one) starting just weeks ago, despite a huge push for vaccination and tens of millions of Americans getting the shots.
It was likely also difficult to fathom that the virus would have variants that could become more dangerous or transmissible as each one emerged or that a high percentage of Americans would reject vaccines, despite rock-solid research that they are safe and effective and that not getting vaccinated would put many in grave danger.
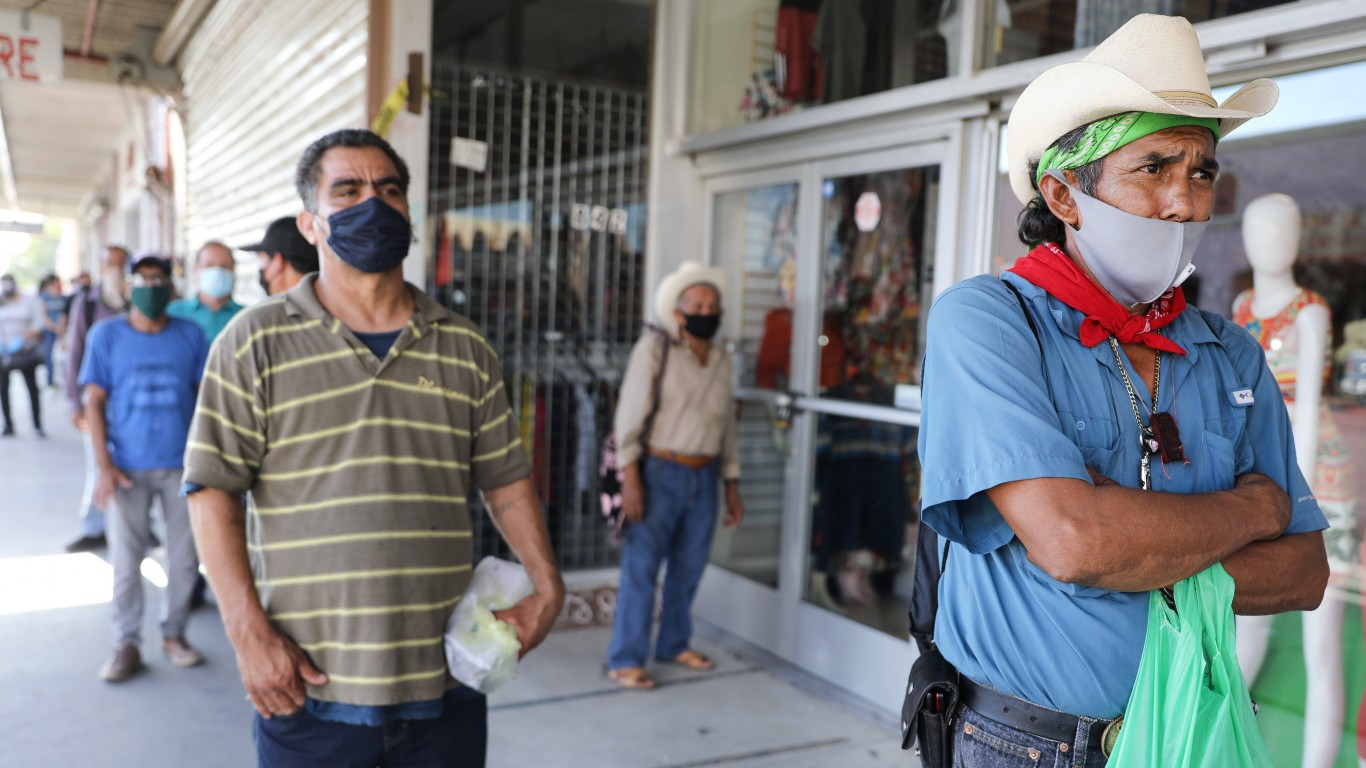
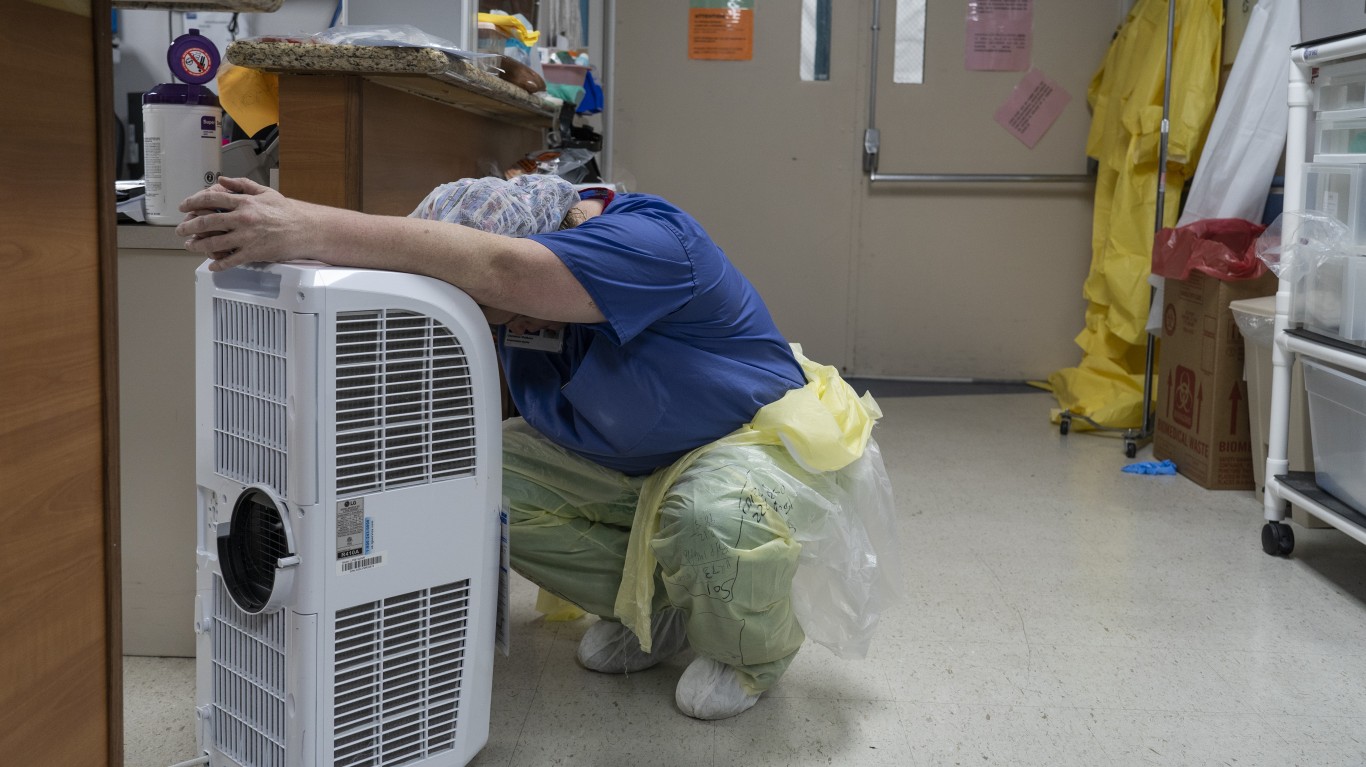
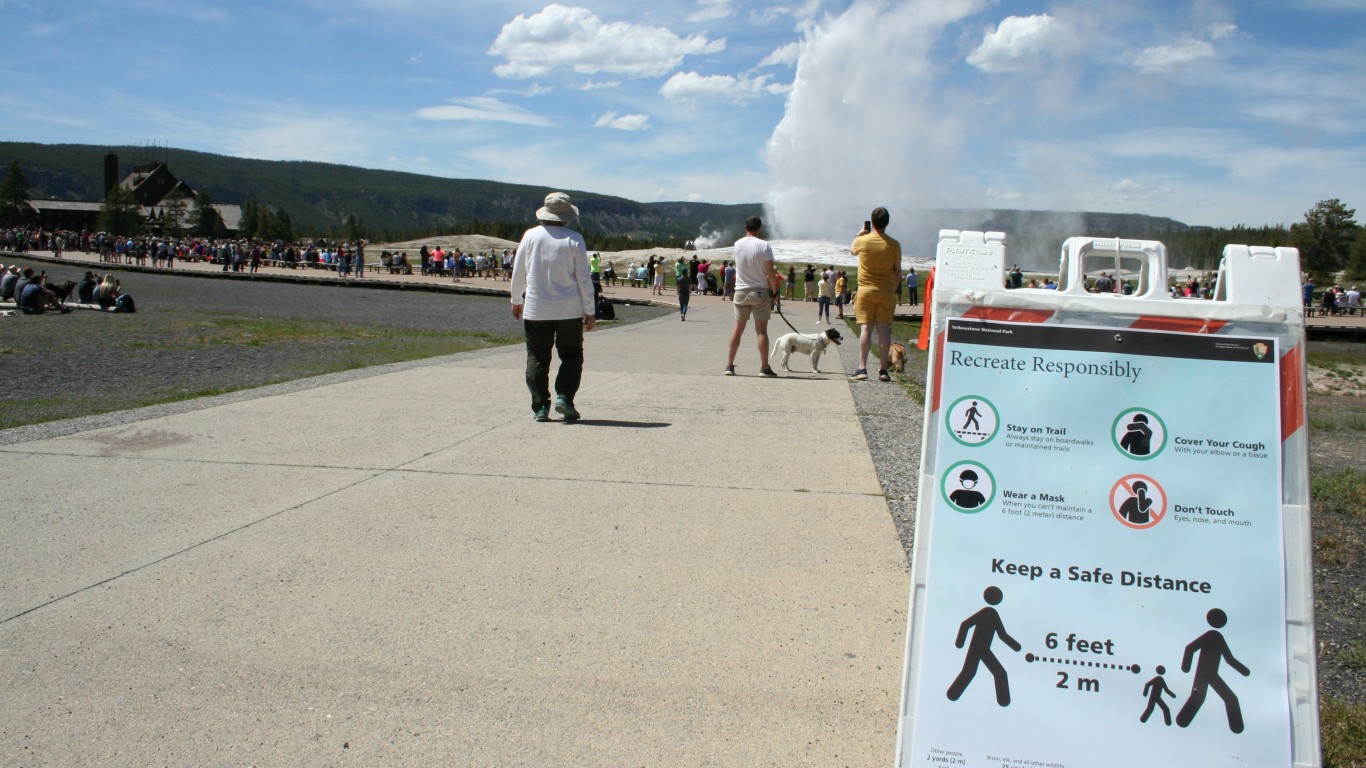
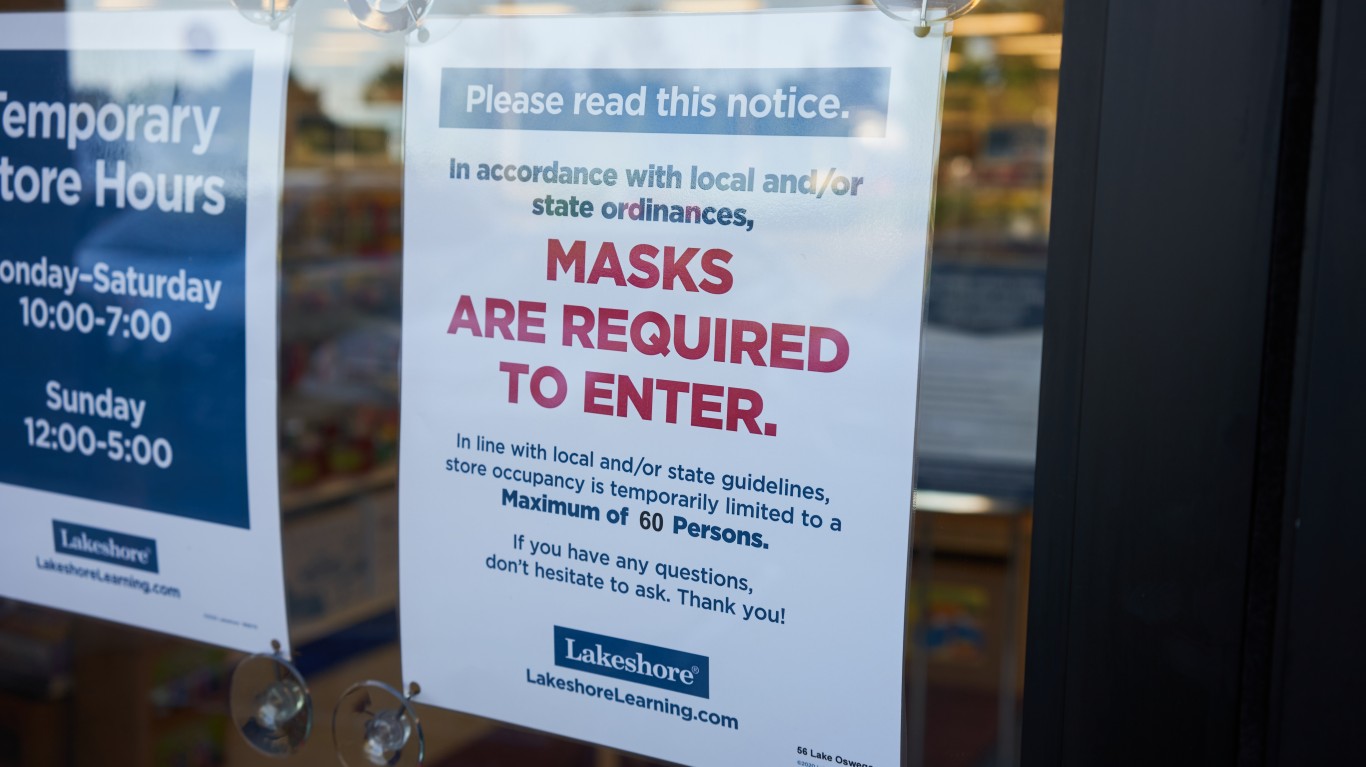
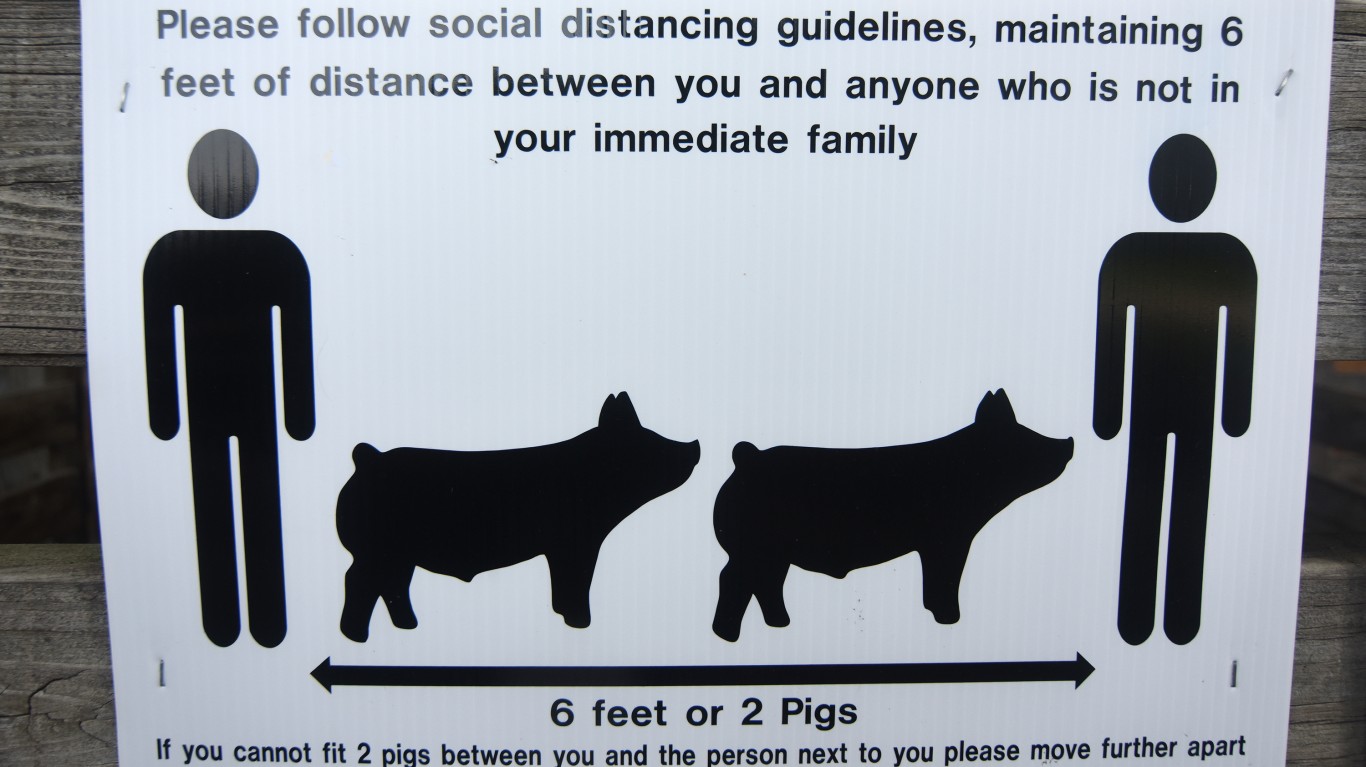
This spread of COVID-19 has shown that almost no one is safe. That has become particularly true with the new omicron variant, which is extremely transmissible. Vaccination, mask-wearing, and social distancing have become critical to individual protection, as much as at any time in the past. (COVID-19: All the countries the CDC doesn’t want you to go.)
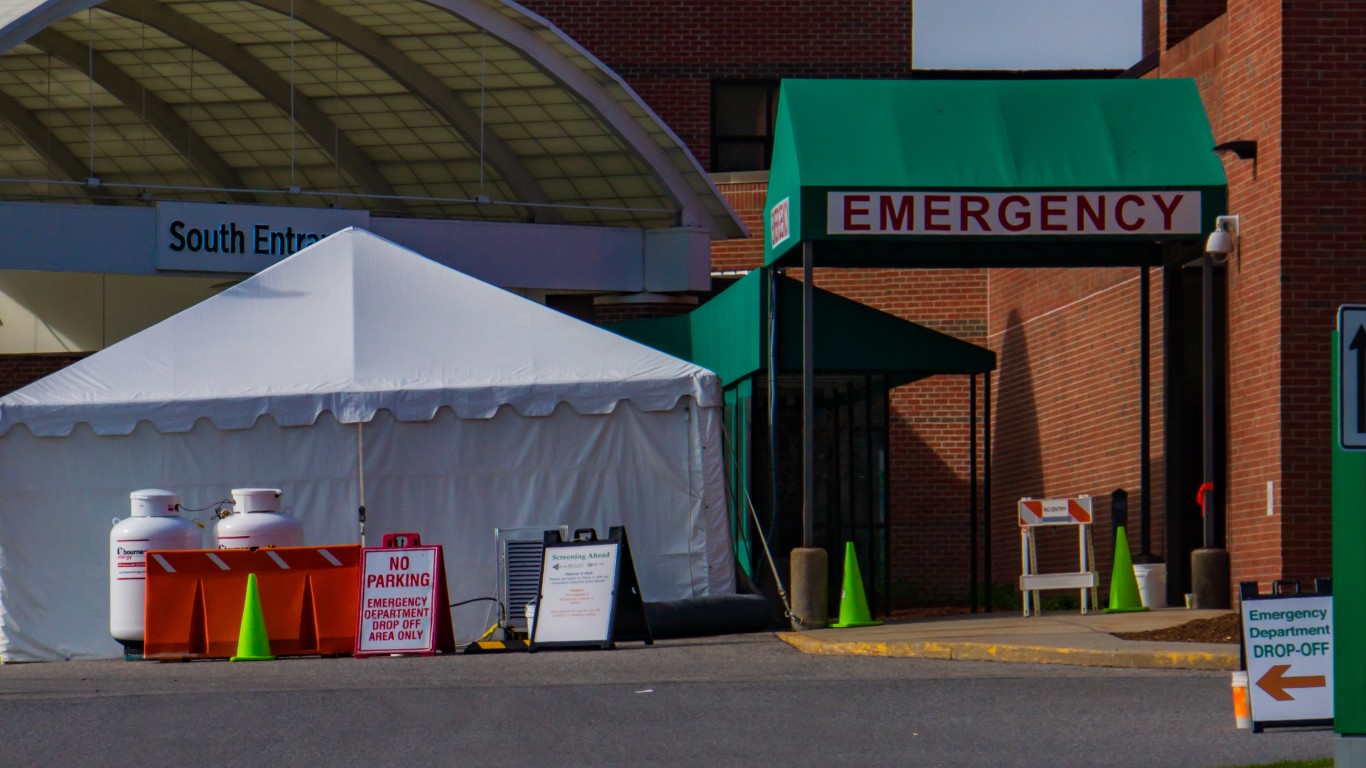
Some of the people who have not followed these protocols carefully have gotten sick, but also some who tried their best. Some vaccinated people also got infected. These cases have contributed to the overflow of patients in hospitals being treated for the virus. Once again, some of these hospitals might need to triage who should be treated, and perhaps, who will not be.
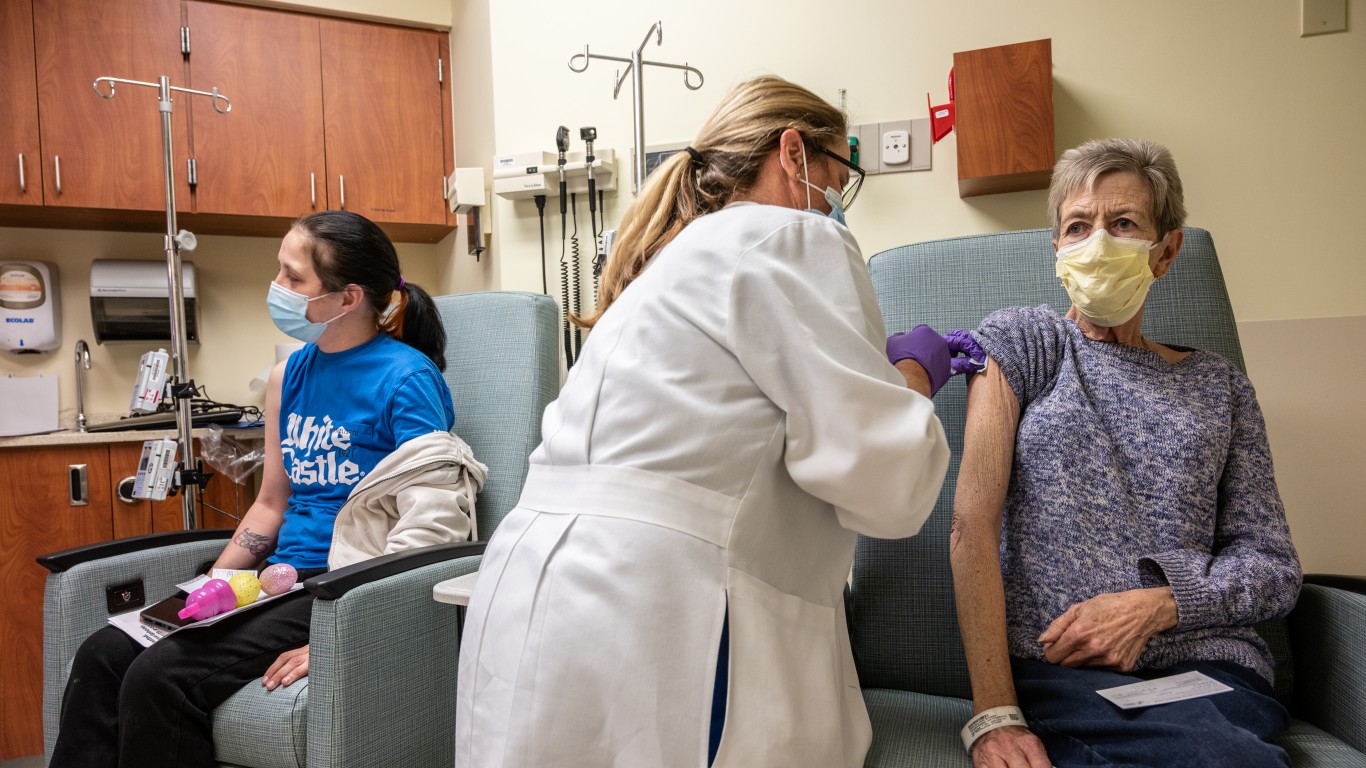
There are several ways to measure how dangerous or safe a geographic area is. Among these are new cases, deaths, hospitalizations, and vaccinations. And these can be measured by averages over seven- or 14-day periods. For vaccinations, the yardstick is the percentage of the population that has received a shot, or two, or three. (These are the states where the most people are vaccinated.)
To find the safest state for COVID-19, 24/7 Wall St. chose the measure of average daily cases over the most recent seven days per 100,000, using data from The New York Times as of Jan. 19. Nationwide, the daily average cases was up over 38% over the past 14 days to 756,752 cases a day, or 228 daily cases per 100,000 people.
The state with the lowest seven-day average of daily cases per 100,000 people is Maine at 66. This figure is 26% higher than it was 14 days ago. The daily average of new cases over the past seven days in the state is 891.
Behind Maine is Michigan, with an average of 99 new cases over the past seven days per 100,000 people, or 9,913 average daily cases. This is actually 16% lower compared to 14 days ago. Next is Idaho, with a seven-day average of daily cases of 1,929, which translates to 108 per 100,000. New daily cases in Idaho grew 182% over the past 14 days.
Click here to see the safest state for COVID-19

50. Rhode Island
> Avg. daily new cases per 100,000 (past 7 days): 437
> Avg. daily new cases (past 7 days): 4,634 (14th lowest)
> 14-day change: +39% (18th lowest)
[in-text-ad]

49. Wisconsin
> Avg. daily new cases per 100,000 (past 7 days): 407
> Avg. daily new cases (past 7 days): 23,723 (9th highest)
> 14-day change: +260% (the highest)
 24/7 Wall St.
48. South Carolina
> Avg. daily new cases per 100,000 (past 7 days): 341
> Avg. daily new cases (past 7 days): 17,567 (11th highest)
> 14-day change: +216% (5th highest)

47. Utah
> Avg. daily new cases per 100,000 (past 7 days): 331
> Avg. daily new cases (past 7 days): 10,603 (24th highest)
> 14-day change: +182% (11th highest)
[in-text-ad-2]

46. Hawaii
> Avg. daily new cases per 100,000 (past 7 days): 307
> Avg. daily new cases (past 7 days): 4,348 (13th lowest)
> 14-day change: +65% (22nd lowest)

45. Delaware
> Avg. daily new cases per 100,000 (past 7 days): 300
> Avg. daily new cases (past 7 days): 2,920 (9th lowest)
> 14-day change: +15% (10th lowest)
[in-text-ad]

44. North Carolina
> Avg. daily new cases per 100,000 (past 7 days): 297
> Avg. daily new cases (past 7 days): 31,170 (5th highest)
> 14-day change: +111% (18th highest)

43. California
> Avg. daily new cases per 100,000 (past 7 days): 277
> Avg. daily new cases (past 7 days): 109,623 (the highest)
> 14-day change: +107% (20th highest)
42. Vermont
> Avg. daily new cases per 100,000 (past 7 days): 276
> Avg. daily new cases (past 7 days): 1,725 (5th lowest)
> 14-day change: +77% (25th lowest)
[in-text-ad-2]

41. Arkansas
> Avg. daily new cases per 100,000 (past 7 days): 275
> Avg. daily new cases (past 7 days): 8,309 (23rd lowest)
> 14-day change: +113% (17th highest)
40. Arizona
> Avg. daily new cases per 100,000 (past 7 days): 275
> Avg. daily new cases (past 7 days): 20,016 (10th highest)
> 14-day change: +197% (9th highest)
[in-text-ad]

39. North Dakota
> Avg. daily new cases per 100,000 (past 7 days): 274
> Avg. daily new cases (past 7 days): 2,086 (8th lowest)
> 14-day change: +235% (4th highest)
 24/7 Wall St.
38. New Mexico
> Avg. daily new cases per 100,000 (past 7 days): 265
> Avg. daily new cases (past 7 days): 5,557 (16th lowest)
> 14-day change: +207% (7th highest)

37. Oklahoma
> Avg. daily new cases per 100,000 (past 7 days): 265
> Avg. daily new cases (past 7 days): 10,476 (25th highest)
> 14-day change: +250% (2nd highest)
[in-text-ad-2]
36. Alaska
> Avg. daily new cases per 100,000 (past 7 days): 258
> Avg. daily new cases (past 7 days): 1,888 (6th lowest)
> 14-day change: +241% (3rd highest)

35. New Hampshire
> Avg. daily new cases per 100,000 (past 7 days): 257
> Avg. daily new cases (past 7 days): 3,493 (10th lowest)
> 14-day change: +147% (13th highest)
[in-text-ad]

34. Massachusetts
> Avg. daily new cases per 100,000 (past 7 days): 252
> Avg. daily new cases (past 7 days): 17,381 (13th highest)
> 14-day change: +8% (8th lowest)
33. Kentucky
> Avg. daily new cases per 100,000 (past 7 days): 240
> Avg. daily new cases (past 7 days): 10,743 (23rd highest)
> 14-day change: +108% (19th highest)

32. West Virginia
> Avg. daily new cases per 100,000 (past 7 days): 239
> Avg. daily new cases (past 7 days): 4,280 (12th lowest)
> 14-day change: +86% (23rd highest)
[in-text-ad-2]
31. Texas
> Avg. daily new cases per 100,000 (past 7 days): 235
> Avg. daily new cases (past 7 days): 68,071 (2nd highest)
> 14-day change: +82% (25th highest)

30. Ohio
> Avg. daily new cases per 100,000 (past 7 days): 235
> Avg. daily new cases (past 7 days): 27,416 (7th highest)
> 14-day change: +39% (18th lowest)
[in-text-ad]

29. Louisiana
> Avg. daily new cases per 100,000 (past 7 days): 233
> Avg. daily new cases (past 7 days): 10,830 (22nd highest)
> 14-day change: +22% (13th lowest)
 24/7 Wall St.
28. Mississippi
> Avg. daily new cases per 100,000 (past 7 days): 232
> Avg. daily new cases (past 7 days): 6,902 (21st lowest)
> 14-day change: +57% (20th lowest)

27. Tennessee
> Avg. daily new cases per 100,000 (past 7 days): 232
> Avg. daily new cases (past 7 days): 15,830 (16th highest)
> 14-day change: +56% (19th lowest)
[in-text-ad-2]

26. Florida
> Avg. daily new cases per 100,000 (past 7 days): 231
> Avg. daily new cases (past 7 days): 49,537 (3rd highest)
> 14-day change: -12% (6th lowest)

25. New York
> Avg. daily new cases per 100,000 (past 7 days): 230
> Avg. daily new cases (past 7 days): 44,647 (4th highest)
> 14-day change: -33% (3rd lowest)
[in-text-ad]

24. Alabama
> Avg. daily new cases per 100,000 (past 7 days): 227
> Avg. daily new cases (past 7 days): 11,121 (21st highest)
> 14-day change: +66% (23rd lowest)

23. Illinois
> Avg. daily new cases per 100,000 (past 7 days): 220
> Avg. daily new cases (past 7 days): 27,822 (6th highest)
> 14-day change: +18% (12th lowest)

22. Nebraska
> Avg. daily new cases per 100,000 (past 7 days): 215
> Avg. daily new cases (past 7 days): 4,159 (11th lowest)
> 14-day change: +140% (14th highest)
[in-text-ad-2]

21. Washington
> Avg. daily new cases per 100,000 (past 7 days): 214
> Avg. daily new cases (past 7 days): 16,275 (14th highest)
> 14-day change: +125% (15th highest)

20. Kansas
> Avg. daily new cases per 100,000 (past 7 days): 207
> Avg. daily new cases (past 7 days): 6,034 (17th lowest)
> 14-day change: +91% (22nd highest)
[in-text-ad]

19. Colorado
> Avg. daily new cases per 100,000 (past 7 days): 207
> Avg. daily new cases (past 7 days): 11,918 (19th highest)
> 14-day change: +36% (16th lowest)
 24/7 Wall St.
18. Nevada
> Avg. daily new cases per 100,000 (past 7 days): 205
> Avg. daily new cases (past 7 days): 6,320 (18th lowest)
> 14-day change: +101% (21st highest)
17. Indiana
> Avg. daily new cases per 100,000 (past 7 days): 203
> Avg. daily new cases (past 7 days): 13,679 (18th highest)
> 14-day change: +61% (21st lowest)
[in-text-ad-2]

16. New Jersey
> Avg. daily new cases per 100,000 (past 7 days): 197
> Avg. daily new cases (past 7 days): 17,509 (12th highest)
> 14-day change: -40% (the lowest)

15. Missouri
> Avg. daily new cases per 100,000 (past 7 days): 193
> Avg. daily new cases (past 7 days): 11,868 (20th highest)
> 14-day change: +67% (24th lowest)
[in-text-ad]
14. Wyoming
> Avg. daily new cases per 100,000 (past 7 days): 193
> Avg. daily new cases (past 7 days): 1,114 (2nd lowest)
> 14-day change: +215% (6th highest)

13. Pennsylvania
> Avg. daily new cases per 100,000 (past 7 days): 190
> Avg. daily new cases (past 7 days): 24,263 (8th highest)
> 14-day change: +18% (12th lowest)
12. Virginia
> Avg. daily new cases per 100,000 (past 7 days): 187
> Avg. daily new cases (past 7 days): 15,998 (15th highest)
> 14-day change: +11% (9th lowest)
[in-text-ad-2]
11. Oregon
> Avg. daily new cases per 100,000 (past 7 days): 187
> Avg. daily new cases (past 7 days): 7,888 (22nd lowest)
> 14-day change: +184% (10th highest)

10. Connecticut
> Avg. daily new cases per 100,000 (past 7 days): 184
> Avg. daily new cases (past 7 days): 6,545 (20th lowest)
> 14-day change: -7% (7th lowest)
[in-text-ad]
9. Iowa
> Avg. daily new cases per 100,000 (past 7 days): 172
> Avg. daily new cases (past 7 days): 5,441 (15th lowest)
> 14-day change: +125% (15th highest)

8. South Dakota
> Avg. daily new cases per 100,000 (past 7 days): 165
> Avg. daily new cases (past 7 days): 1,457 (4th lowest)
> 14-day change: +83% (24th highest)

7. Georgia
> Avg. daily new cases per 100,000 (past 7 days): 142
> Avg. daily new cases (past 7 days): 15,166 (17th highest)
> 14-day change: -15% (5th lowest)
[in-text-ad-2]

6. Maryland
> Avg. daily new cases per 100,000 (past 7 days): 140
> Avg. daily new cases (past 7 days): 8,445 (24th lowest)
> 14-day change: -35% (2nd lowest)

5. Montana
> Avg. daily new cases per 100,000 (past 7 days): 132
> Avg. daily new cases (past 7 days): 1,408 (3rd lowest)
> 14-day change: +205% (8th highest)
[in-text-ad]

4. Minnesota
> Avg. daily new cases per 100,000 (past 7 days): 112
> Avg. daily new cases (past 7 days): 6,342 (19th lowest)
> 14-day change: +27% (15th lowest)

3. Idaho
> Avg. daily new cases per 100,000 (past 7 days): 108
> Avg. daily new cases (past 7 days): 1,929 (7th lowest)
> 14-day change: +182% (11th highest)

2. Michigan
> Avg. daily new cases per 100,000 (past 7 days): 99
> Avg. daily new cases (past 7 days): 9,913 (25th lowest)
> 14-day change: -16% (4th lowest)
[in-text-ad-2]

1. Maine
> Avg. daily new cases per 100,000 (past 7 days): 66
> Avg. daily new cases (past 7 days): 891 (the lowest)
> 14-day change: +25% (14th lowest)
Thank you for reading! Have some feedback for us?
Contact the 24/7 Wall St. editorial team.