People often worry about the safety of air travel, but the odds of a passenger dying in a plane crash are 1 in 9,821, while the odds of meeting your maker in a car accident are 1 in 114. Driving, that is, can be a dangerous activity.
In fact, while the pandemic kept many drivers off the roads in 2020, with Americans covering 13% fewer miles than in the previous year, traffic deaths actually increased. Some 42,060 people died in vehicle accidents last year, according to the National Safety Council, representing an 8% increase over 2019.
Some places are safer to drive than others, though, and while we don’t necessarily have a choice about where we drive, it’s instructive to learn which cities have the fewest collisions and traffic deaths per capita.
24/7 Wall St. looked at collision and fatality data from 194 cities across the United States to assemble a list of the 25 safest cities to drive. (Picking a new car for your safe city? Be careful when you do, because these new cars are most likely to break down.)
The list covers some 17 states, and includes cities all the way from Anchorage, Alaska, to Port St. Lucie, Florida. Arizona takes the safety prize with four cities in the top 25, and you may be surprised to learn that New York City made the cut, along with two of its busiest commuter cities — Jersey City, New Jersey, and Yonkers, New York. These, on the other hand, are America’s worst cities to drive in.
Click here to see the safest cities for driving

25. Elk Grove, California
> Avg time between collisions: 9.0 years
> Likelihood of collision compared to US avg: 18.2% — #92 out of 194 cities
> Motor vehicle fatalities per 100k: 3.1 — #179 out of 194 cities
> Population: 174,791
[in-text-ad]

24. New York City, New York
> Avg time between collisions: 8.8 years
> Likelihood of collision compared to US avg: 19.9% — #84 out of 194 cities
> Motor vehicle fatalities per 100k: 2.4 — #188 out of 194 cities
> Population: 8,336,817
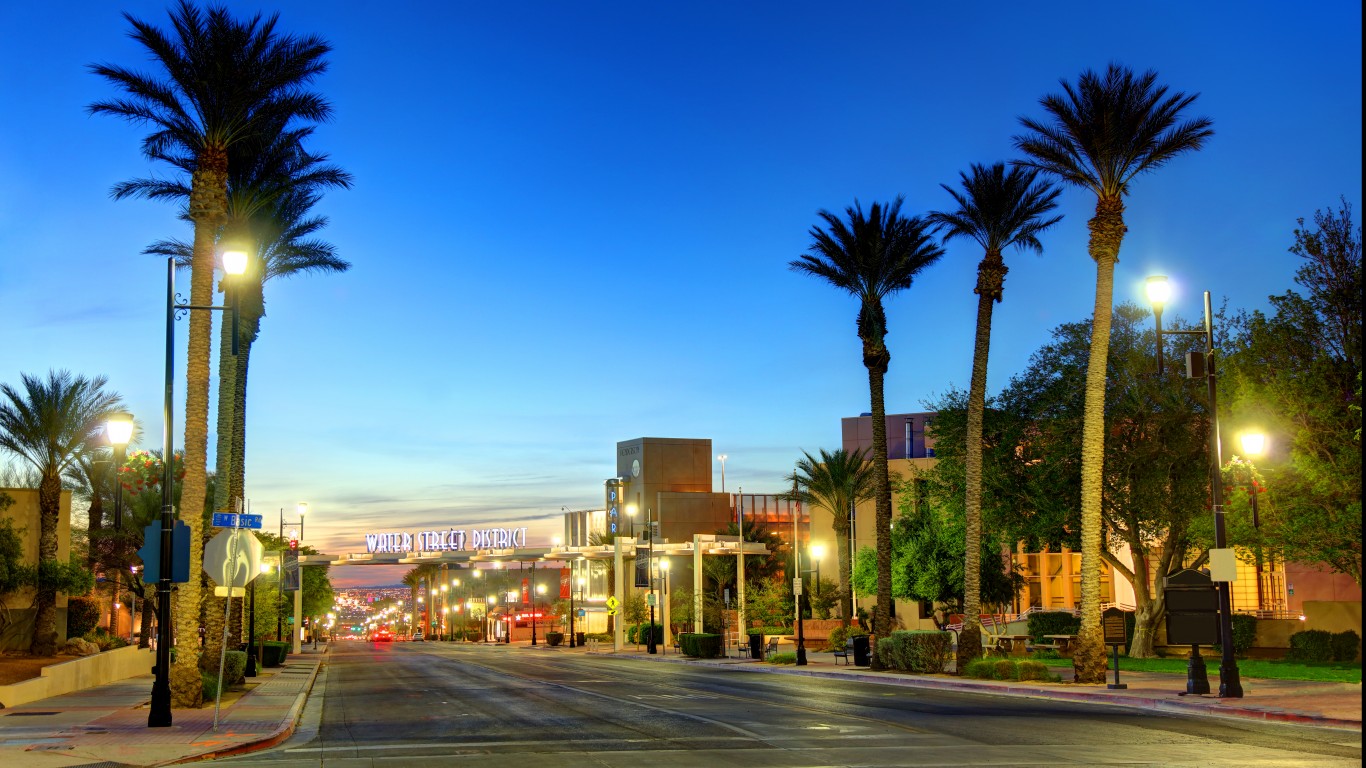
23. Henderson, Nevada
> Avg time between collisions: 9.8 years
> Likelihood of collision compared to US avg: 7.9% — #128 out of 194 cities
> Motor vehicle fatalities per 100k: 3.2 — #178 out of 194 cities
> Population: 320,190
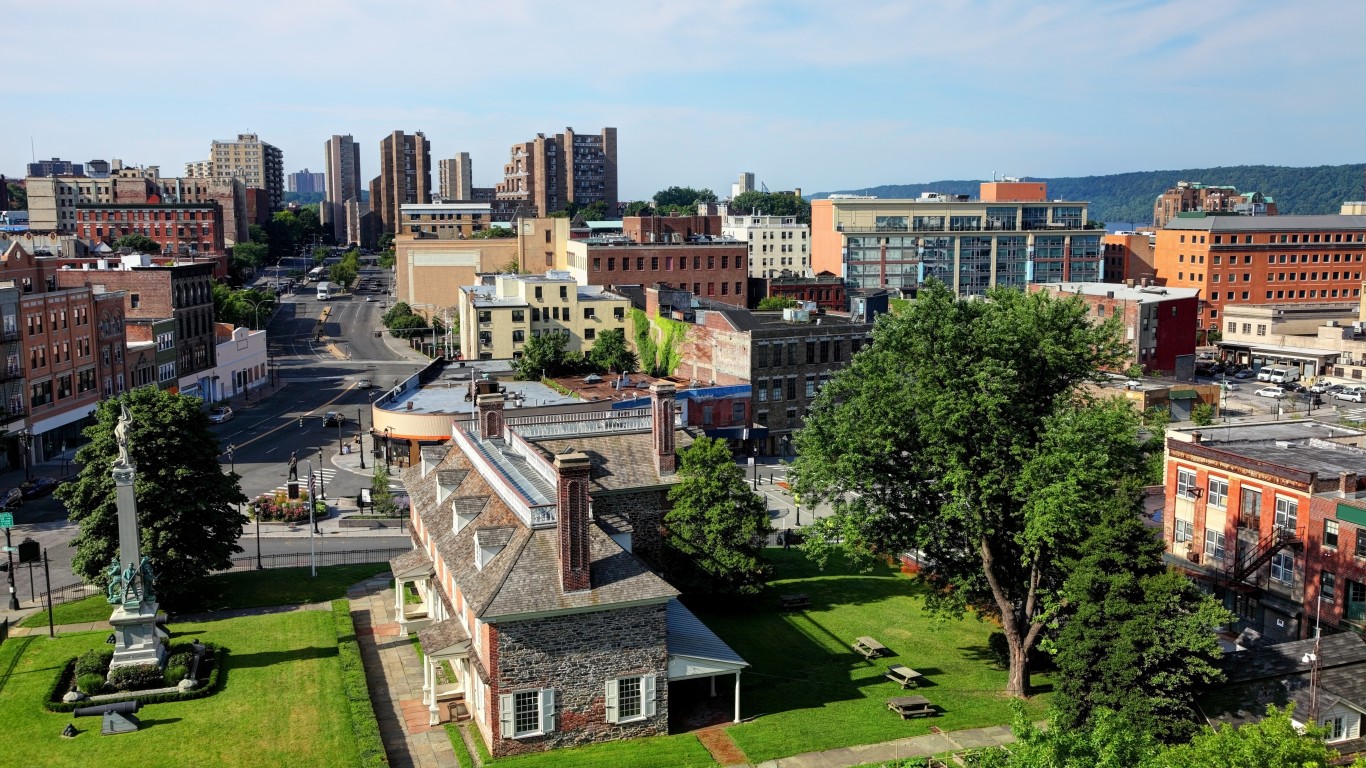
22. Yonkers, New York
> Avg time between collisions: 8.4 years
> Likelihood of collision compared to US avg: 26.1% — #71 out of 194 cities
> Motor vehicle fatalities per 100k: 2.2 — #189 out of 194 cities
> Population: 200,362
[in-text-ad-2]
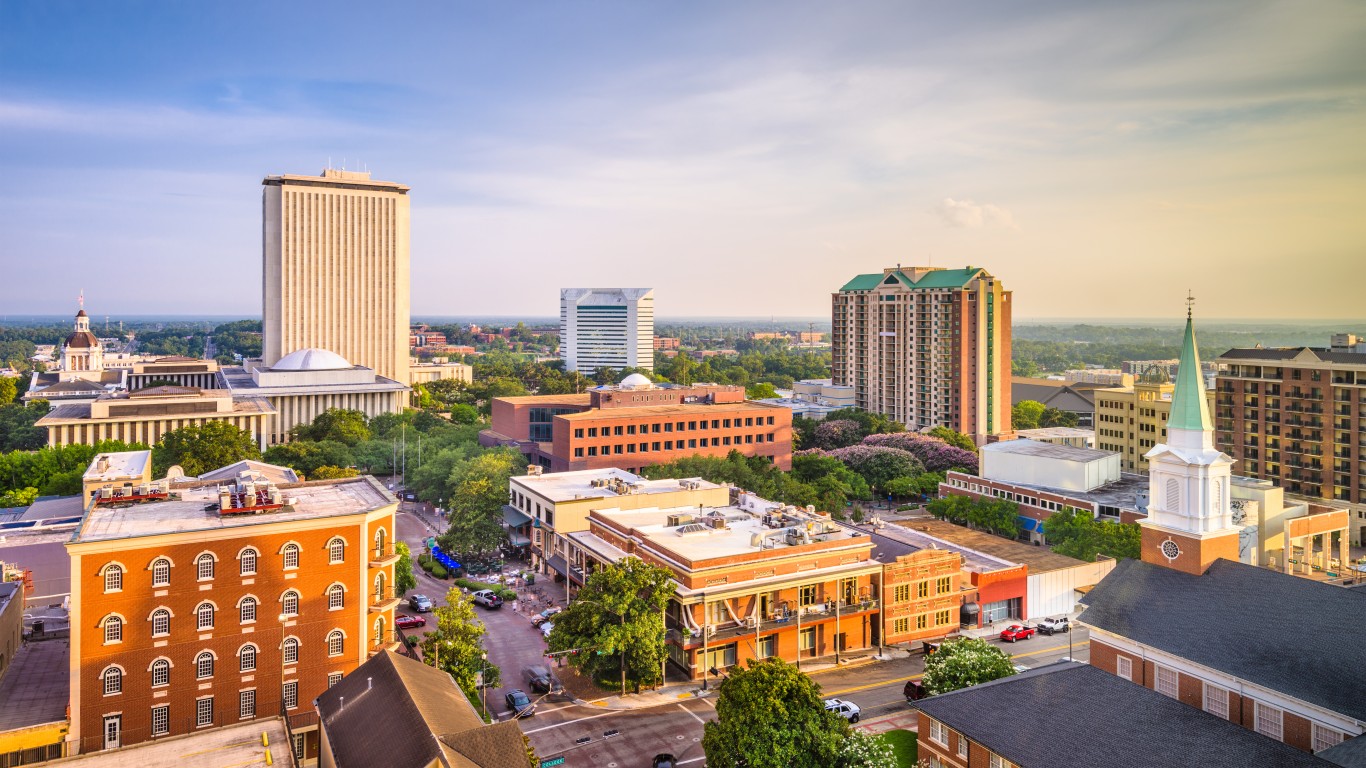
21. Tallahassee, Florida
> Avg time between collisions: 10.6 years
> Likelihood of collision compared to US avg: -0.5% — #153 out of 194 cities
> Motor vehicle fatalities per 100k: 7.6 — #95 out of 194 cities
> Population: 194,503
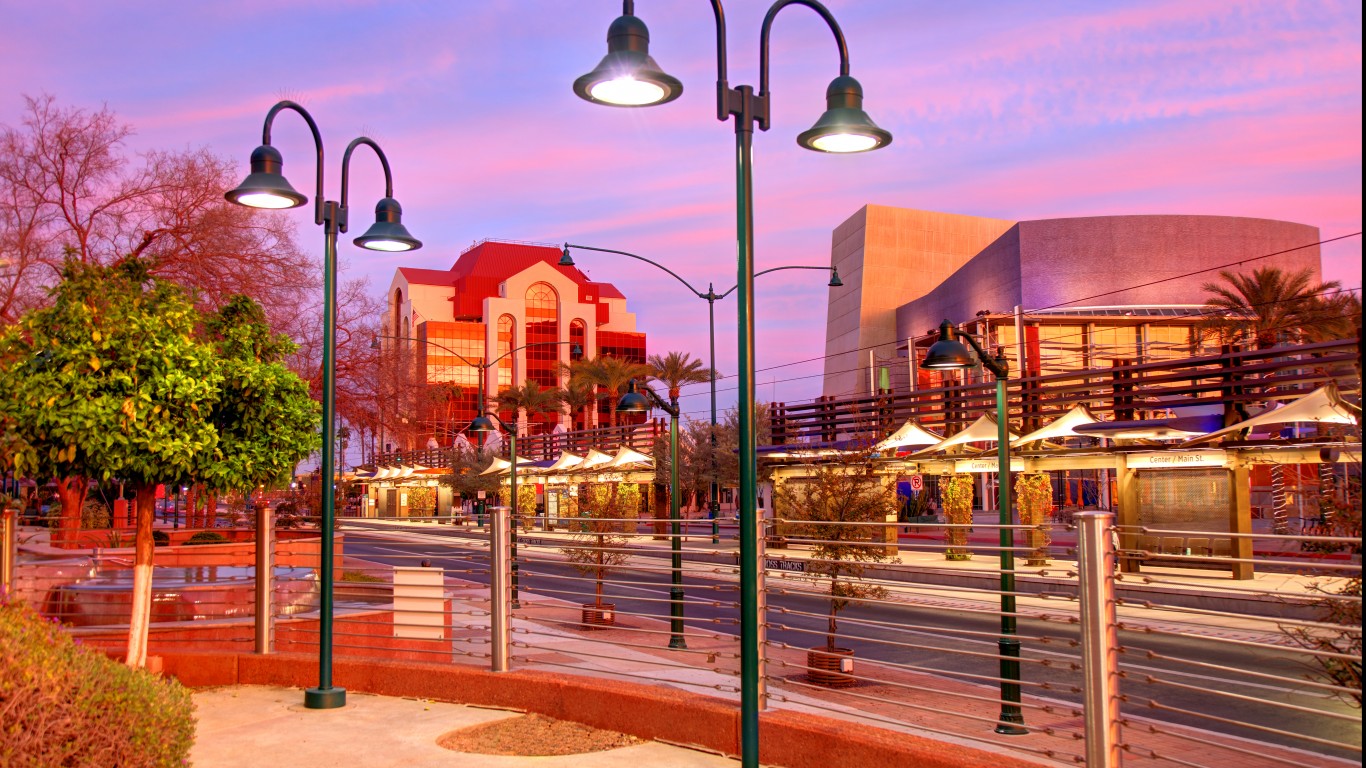
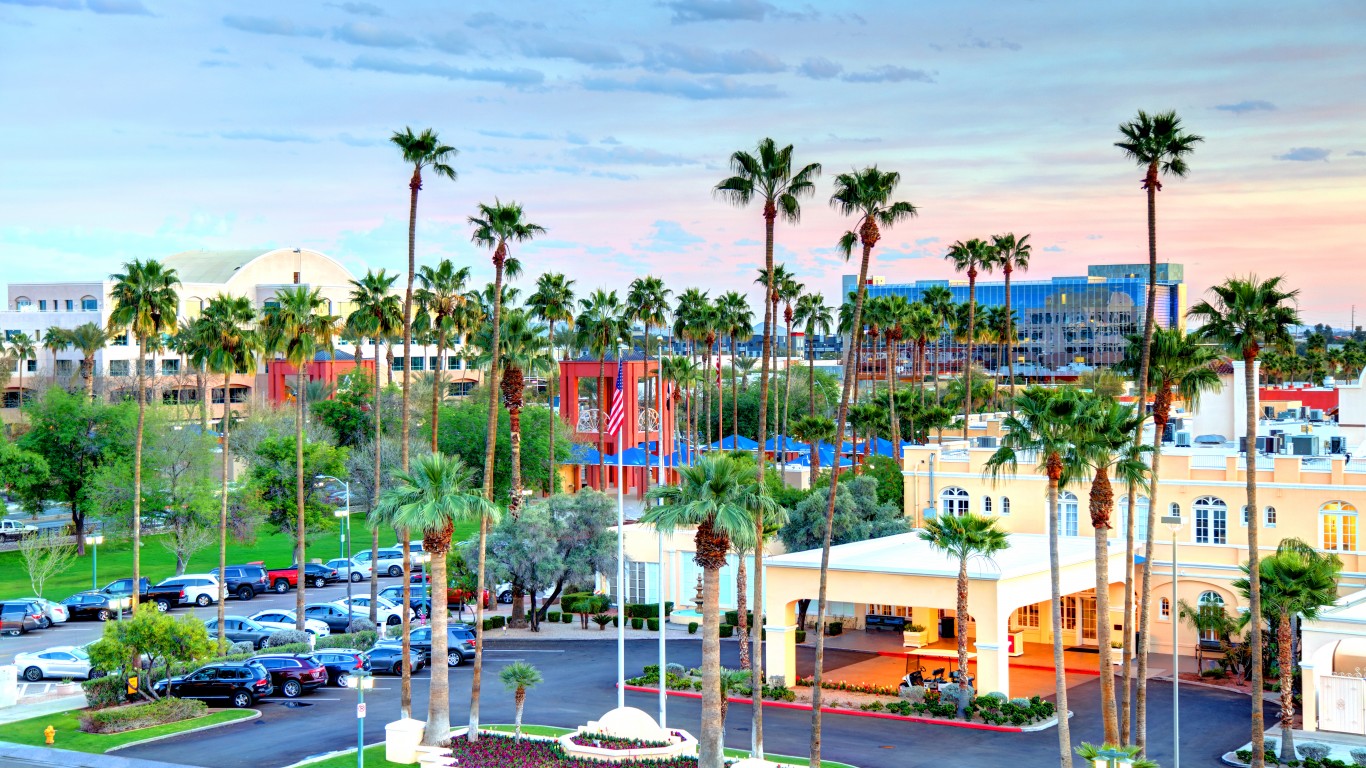
20. Mesa, Arizona
> Avg time between collisions: 11.6 years
> Likelihood of collision compared to US avg: -8.8% — #179 out of 194 cities
> Motor vehicle fatalities per 100k: 8.3 — #84 out of 194 cities
> Population: 517,981
[in-text-ad]
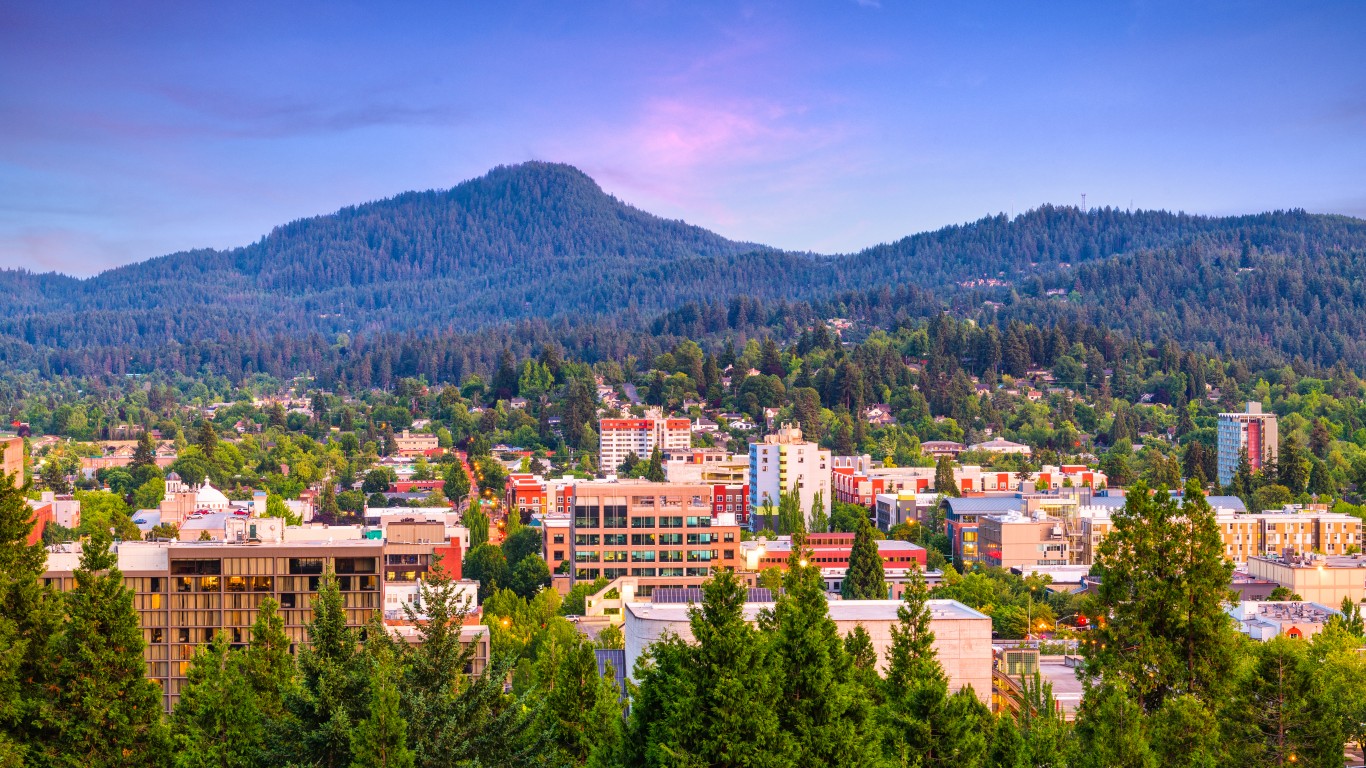
19. Eugene, Oregon
> Avg time between collisions: 10.9 years
> Likelihood of collision compared to US avg: -2.6% — #162 out of 194 cities
> Motor vehicle fatalities per 100k: 3.1 — #179 out of 194 cities
> Population: 172,614

18. Jersey City, New Jersey
> Avg time between collisions: 8.8 years
> Likelihood of collision compared to US avg: 19.7% — #86 out of 194 cities
> Motor vehicle fatalities per 100k: 4.1 — #167 out of 194 cities
> Population: 262,075
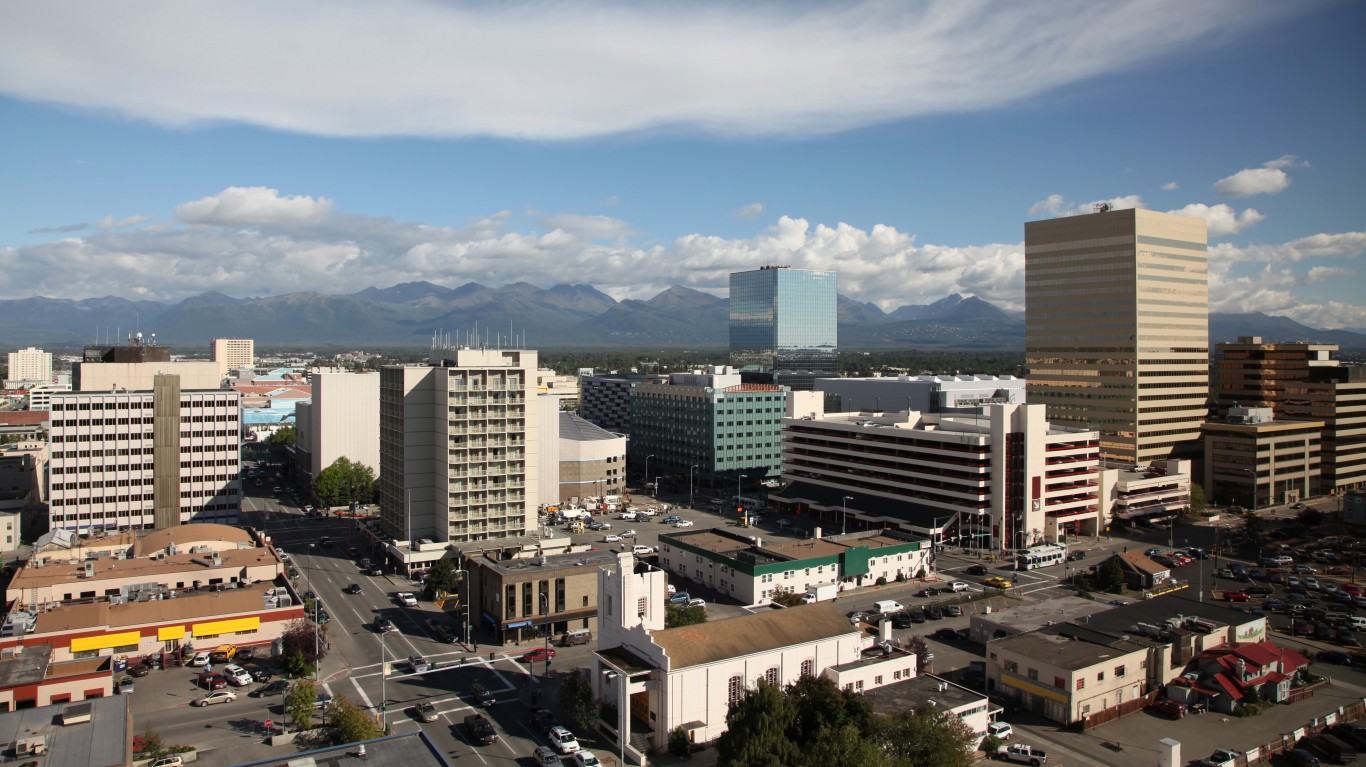
17. Anchorage, Alaska
> Avg time between collisions: 11.2 years
> Likelihood of collision compared to US avg: -5.4% — #168 out of 194 cities
> Motor vehicle fatalities per 100k: 6.2 — #129 out of 194 cities
> Population: 288,000
[in-text-ad-2]
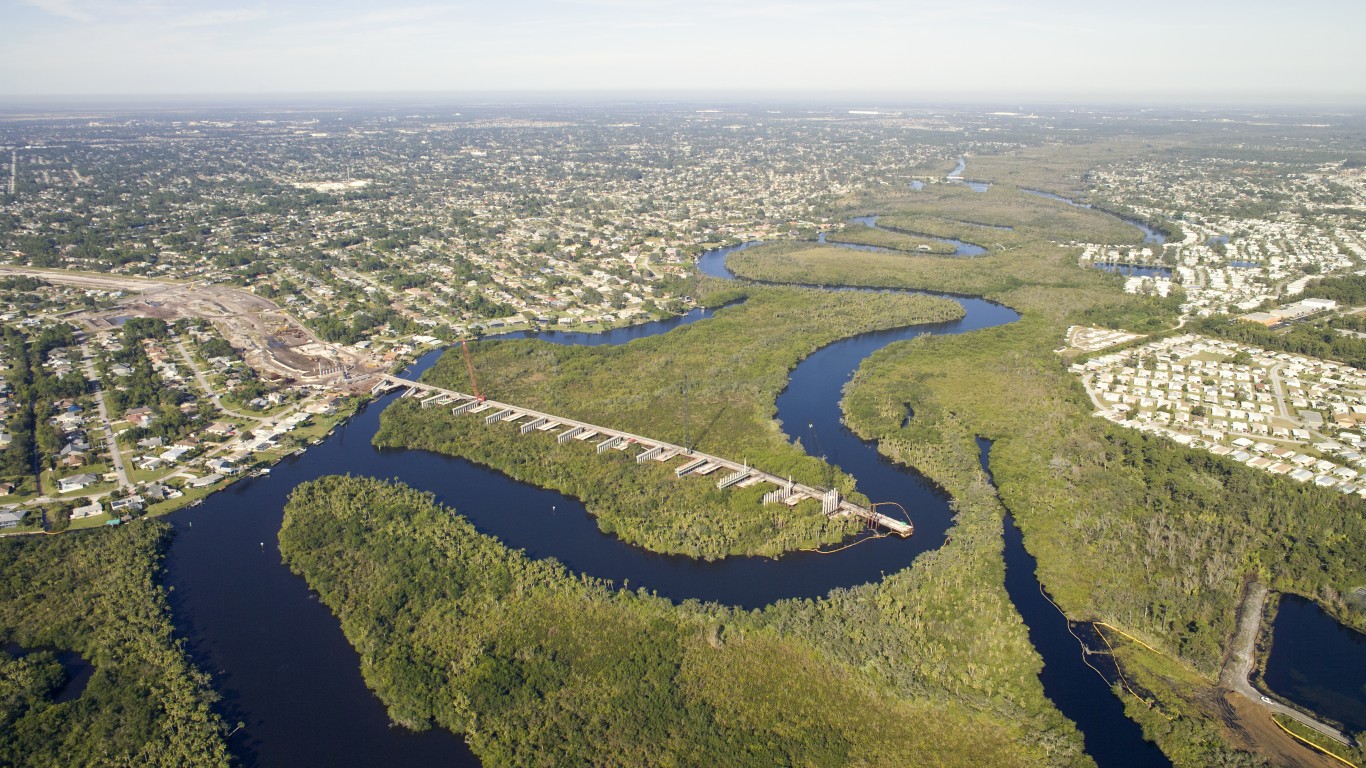
16. Port St. Lucie, Florida
> Avg time between collisions: 11.8 years
> Likelihood of collision compared to US avg: -10.7% — #181 out of 194 cities
> Motor vehicle fatalities per 100k: 5.6 — #145 out of 194 cities
> Population: 201,858
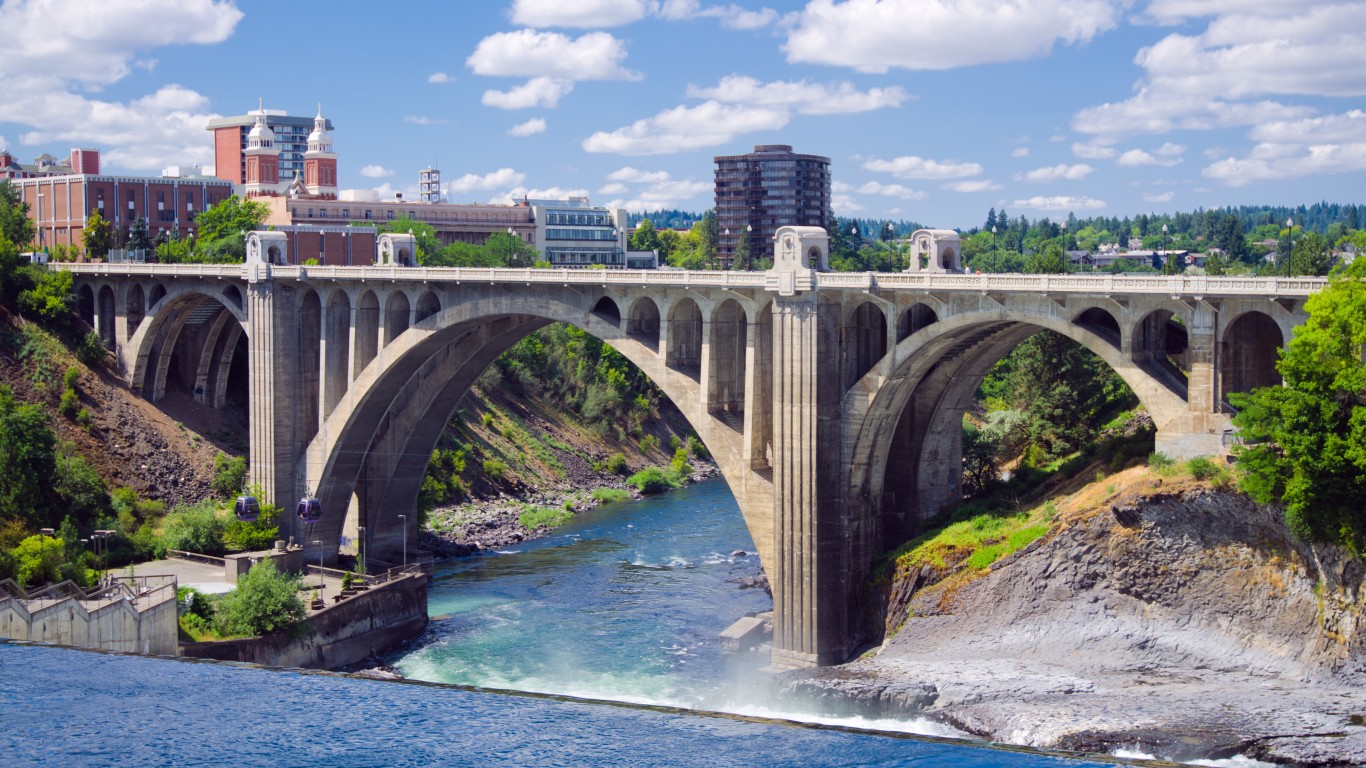
15. Spokane, Washington
> Avg time between collisions: 9.2 years
> Likelihood of collision compared to US avg: 14.4% — #109 out of 194 cities
> Motor vehicle fatalities per 100k: 4.7 — #159 out of 194 cities
> Population: 222,082
[in-text-ad]
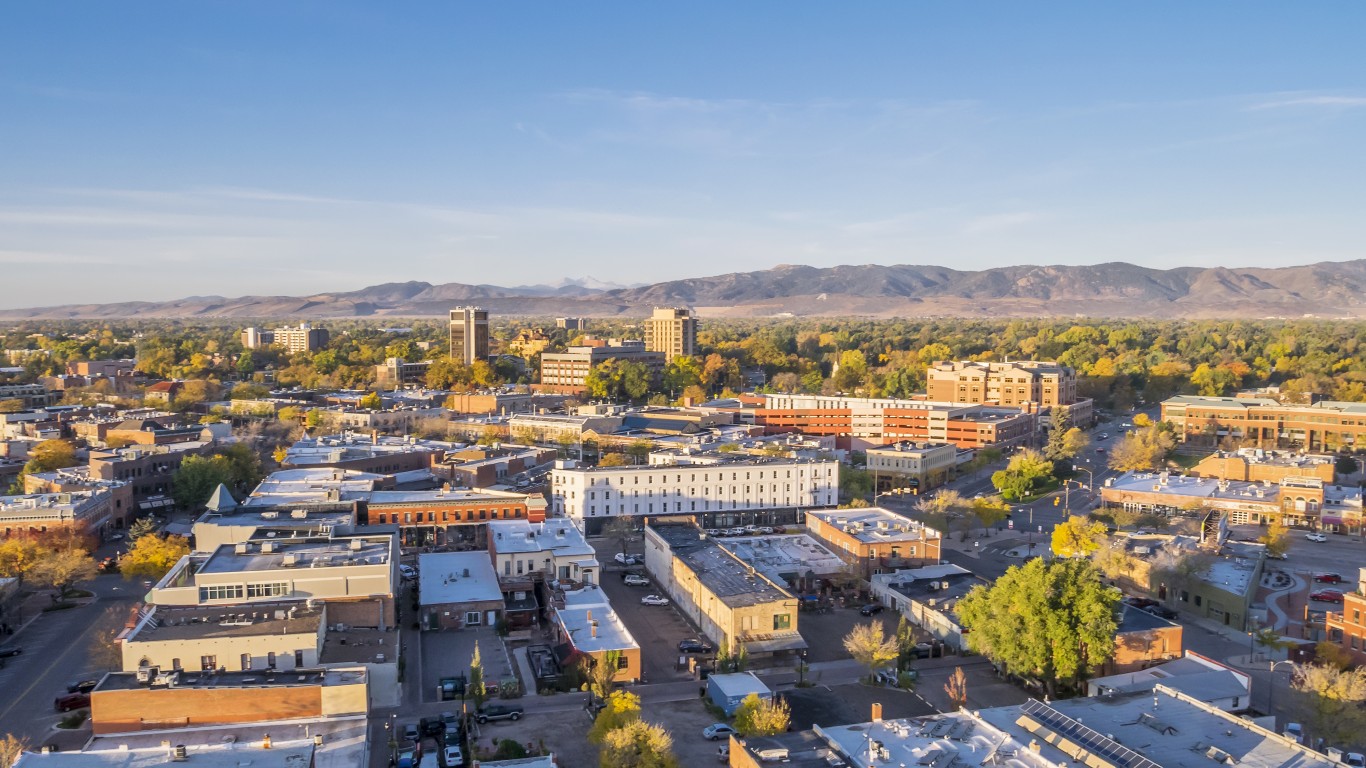
14. Fort Collins, Colorado
> Avg time between collisions: 12.6 years
> Likelihood of collision compared to US avg: -16.1% — #188 out of 194 cities
> Motor vehicle fatalities per 100k: 6.8 — #113 out of 194 cities
> Population: 170,245
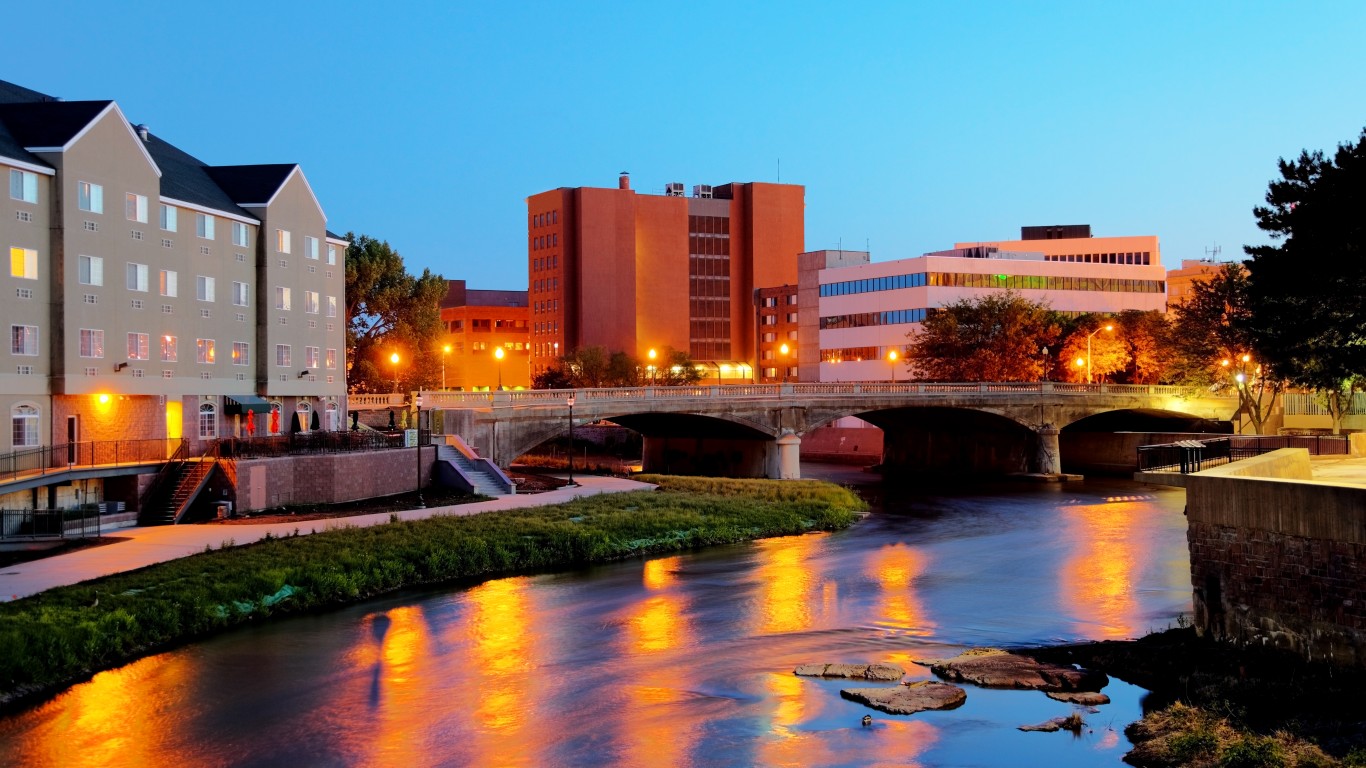
13. Sioux Falls, South Dakota
> Avg time between collisions: 9.6 years
> Likelihood of collision compared to US avg: 10.1% — #124 out of 194 cities
> Motor vehicle fatalities per 100k: 3.3 — #175 out of 194 cities
> Population: 183,799
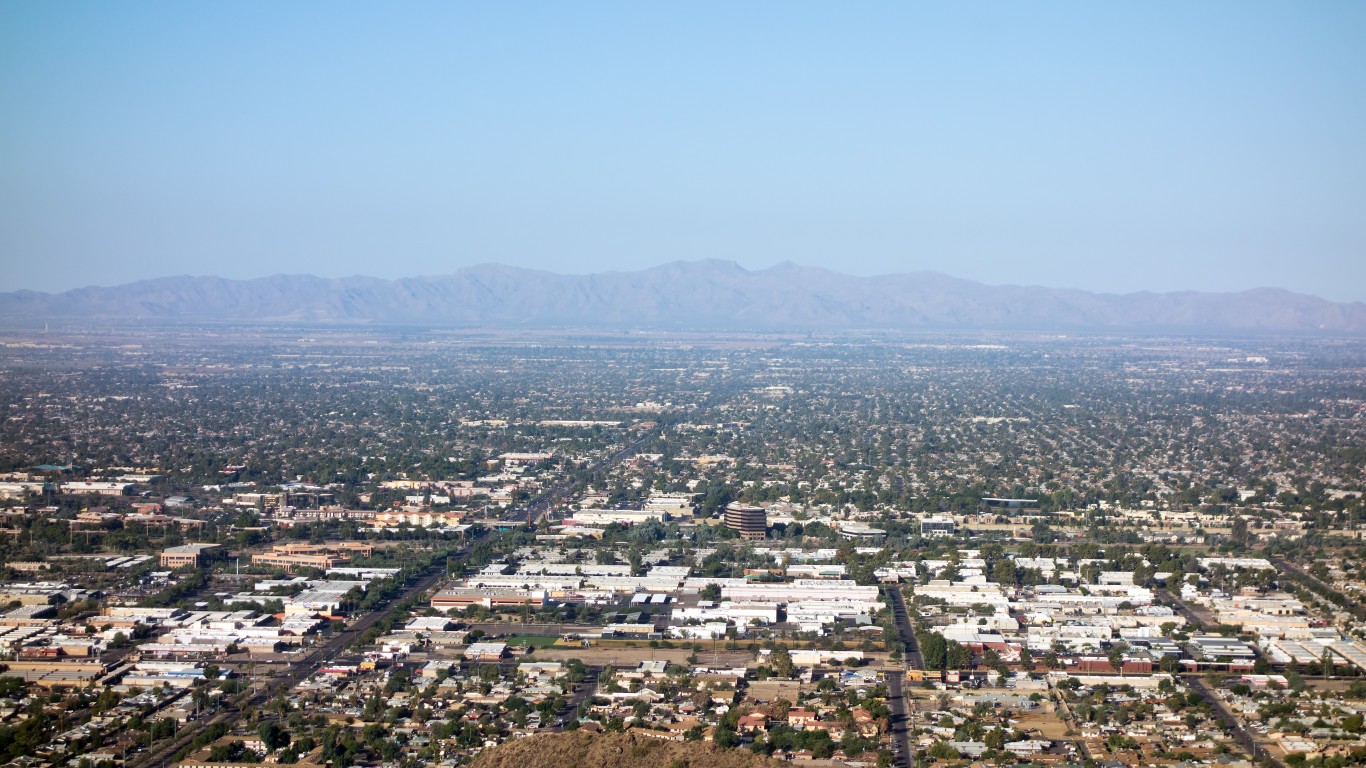
12. Peoria, Arizona
> Avg time between collisions: 10.8 years
> Likelihood of collision compared to US avg: -2.5% — #161 out of 194 cities
> Motor vehicle fatalities per 100k: 6.6 — #119 out of 194 cities
> Population: 175,960
[in-text-ad-2]

11. Reno, Nevada
> Avg time between collisions: 11.3 years
> Likelihood of collision compared to US avg: -6.1% — #170 out of 194 cities
> Motor vehicle fatalities per 100k: 7.4 — #101 out of 194 cities
> Population: 255,624
10. Chandler, Arizona
> Avg time between collisions: 11.2 years
> Likelihood of collision compared to US avg: -5.7% — #169 out of 194 cities
> Motor vehicle fatalities per 100k: 6.1 — #133 out of 194 cities
> Population: 261,149
[in-text-ad]
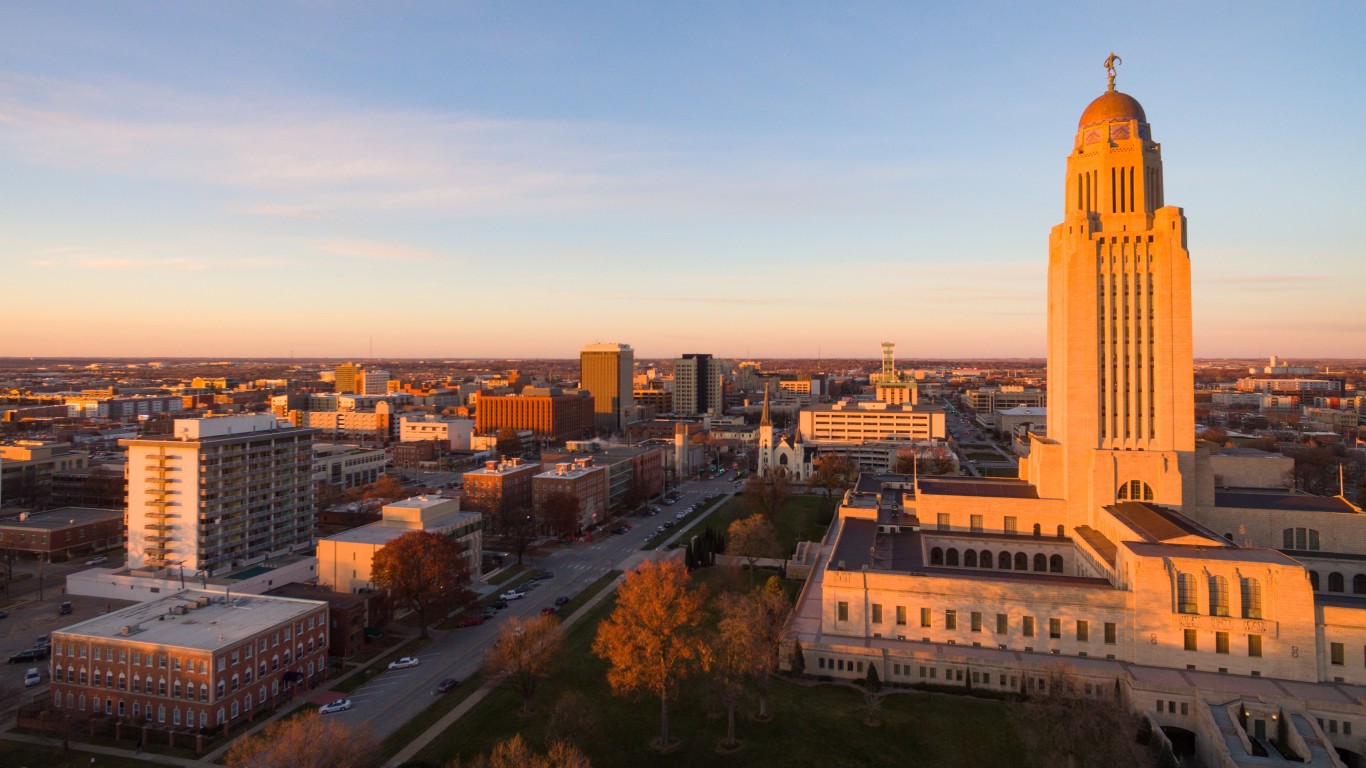
9. Lincoln, Nebraska
> Avg time between collisions: 11.5 years
> Likelihood of collision compared to US avg: -7.7% — #173 out of 194 cities
> Motor vehicle fatalities per 100k: 4.2 — #166 out of 194 cities
> Population: 289,096
 24/7 Wall St.
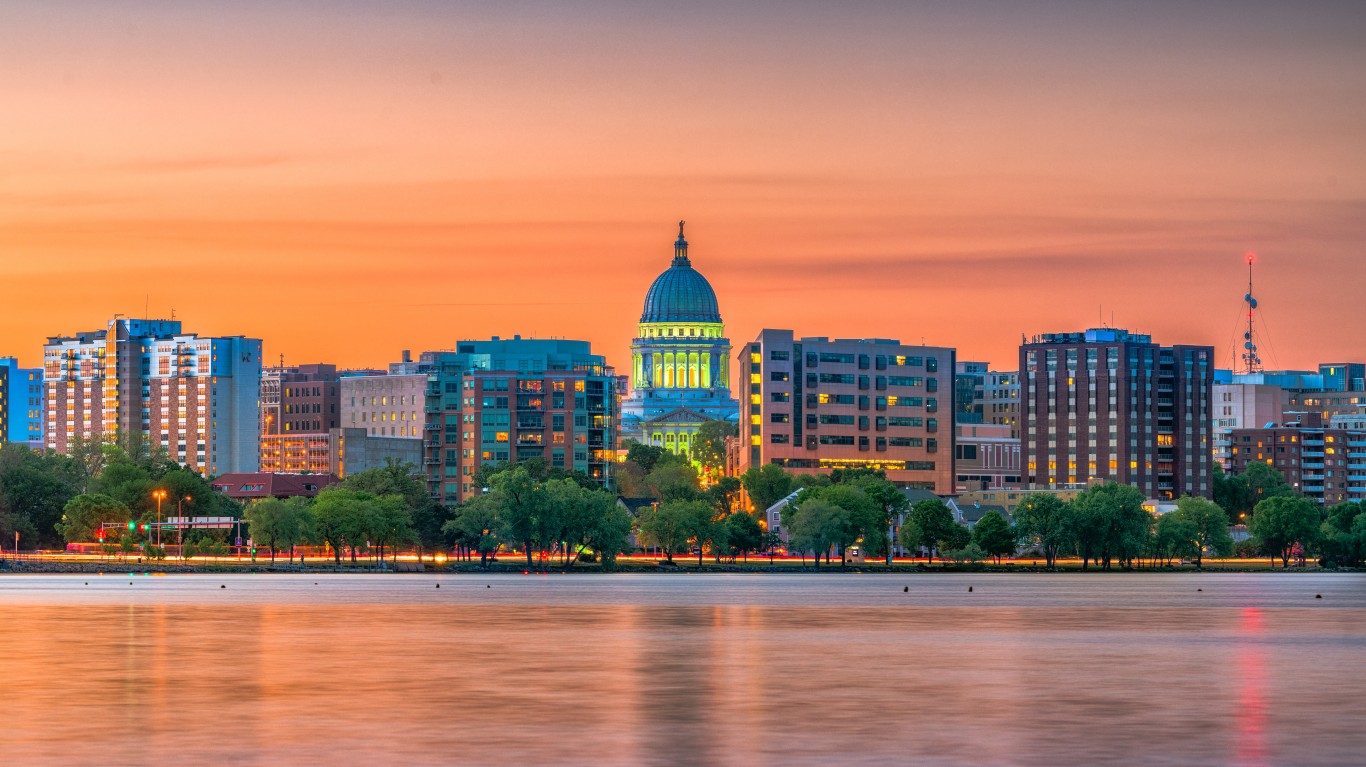
8. Madison, Wisconsin
> Avg time between collisions: 12.2 years
> Likelihood of collision compared to US avg: -13.2% — #184 out of 194 cities
> Motor vehicle fatalities per 100k: 3.0 — #182 out of 194 cities
> Population: 259,673
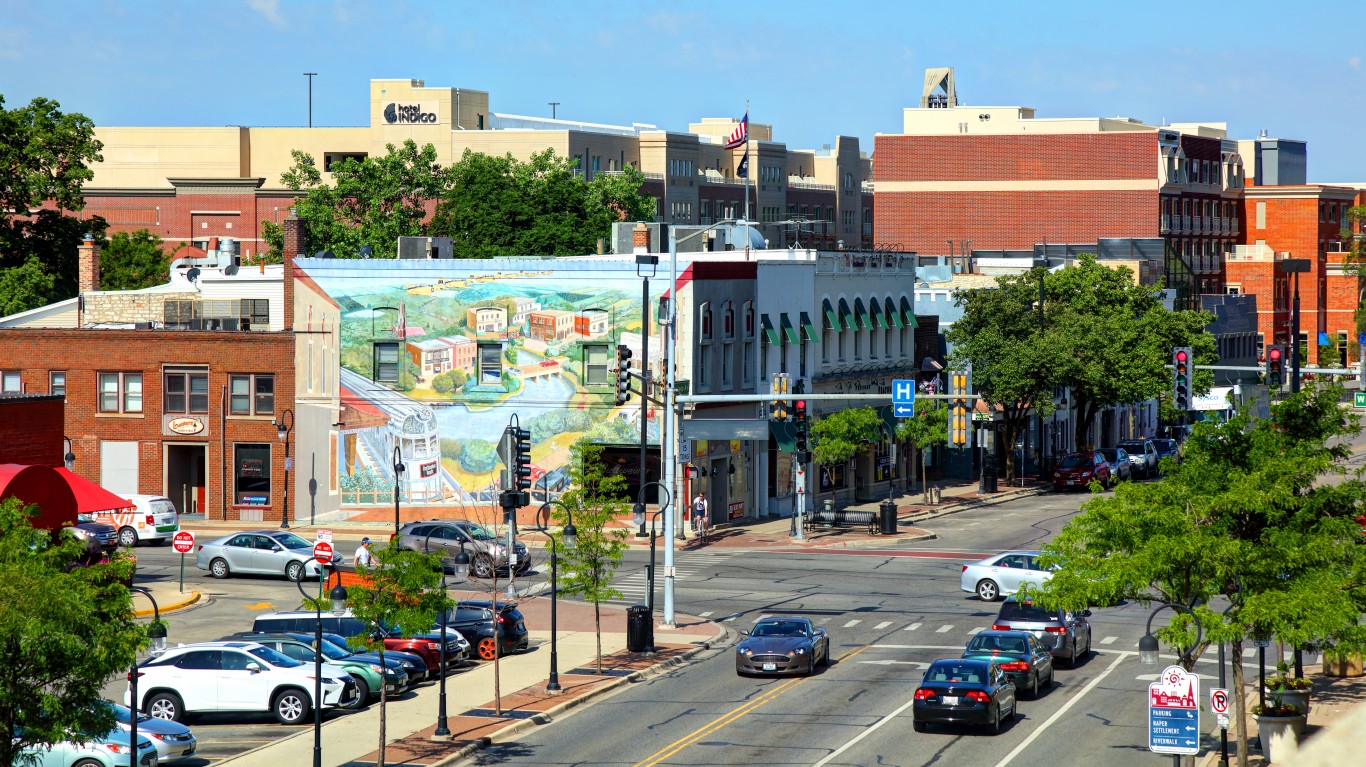
7. Naperville, Illinois
> Avg time between collisions: 9.8 years
> Likelihood of collision compared to US avg: 8.5% — #126 out of 194 cities
> Motor vehicle fatalities per 100k: 1.8 — #191 out of 194 cities
> Population: 149,640
[in-text-ad-2]
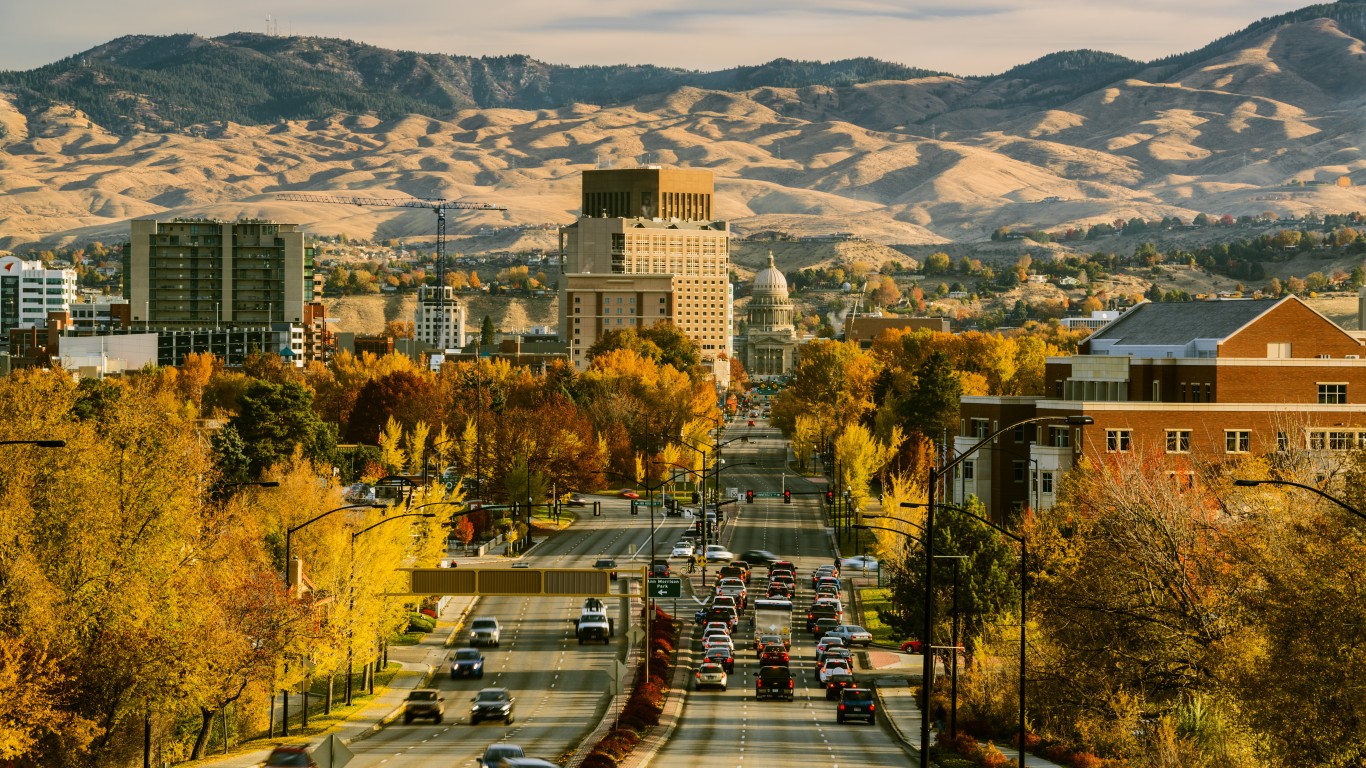
6. Boise, Idaho
> Avg time between collisions: 13.7 years
> Likelihood of collision compared to US avg: -22.6% — #193 out of 194 cities
> Motor vehicle fatalities per 100k: 6.0 — #134 out of 194 cities
> Population: 228,965
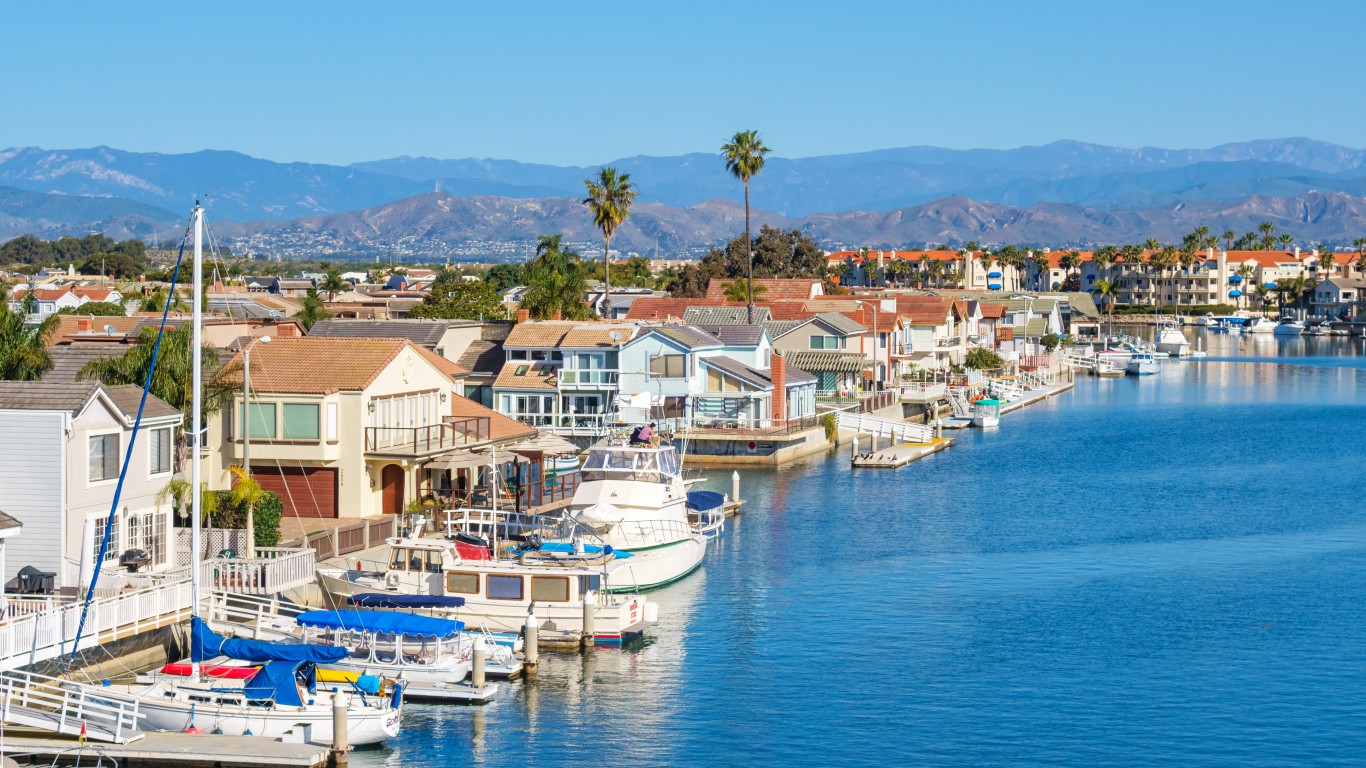
5. Oxnard, California
> Avg time between collisions: 10.1 years
> Likelihood of collision compared to US avg: 4.3% — #141 out of 194 cities
> Motor vehicle fatalities per 100k: 2.9 — #184 out of 194 cities
> Population: 208,875
[in-text-ad]
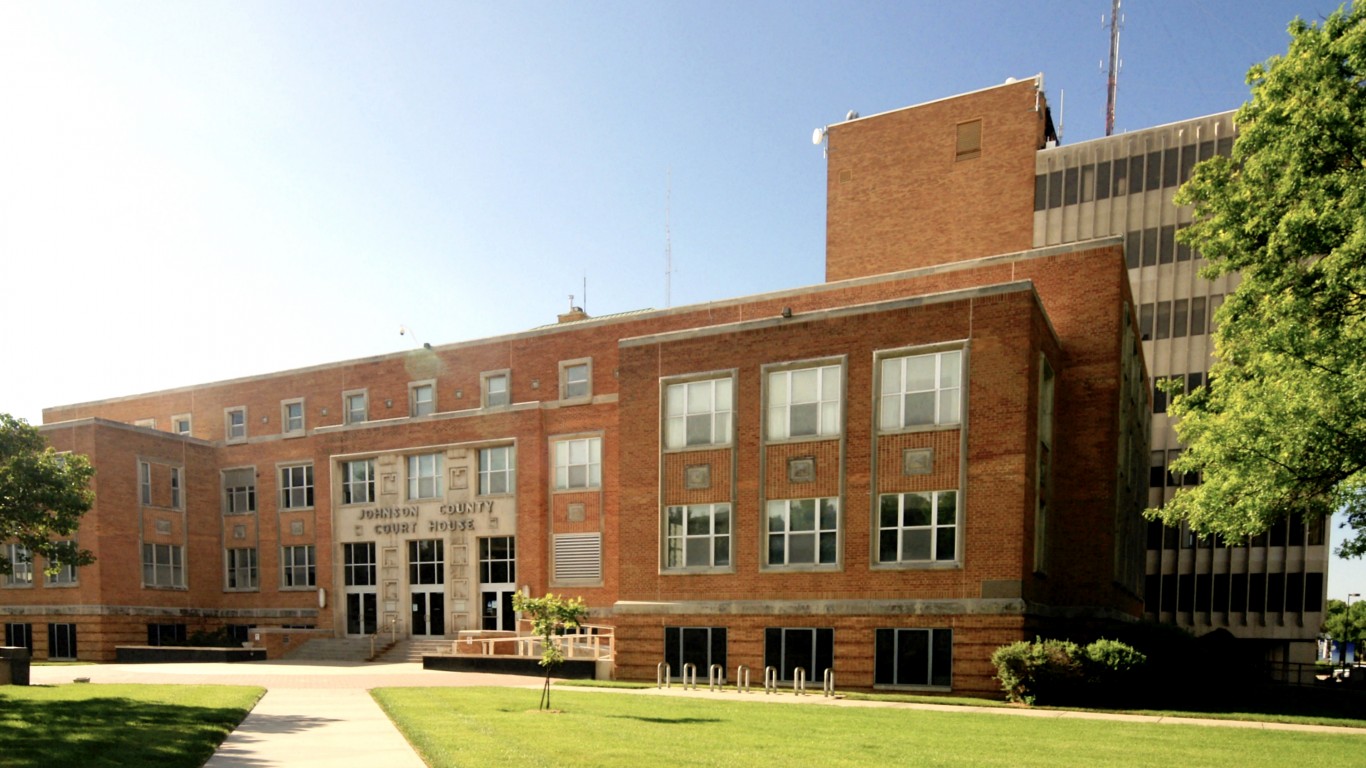
4. Olathe, Kansas
> Avg time between collisions: 12.7 years
> Likelihood of collision compared to US avg: -16.5% — #189 out of 194 cities
> Motor vehicle fatalities per 100k: 3.6 — #170 out of 194 cities
> Population: 140,557
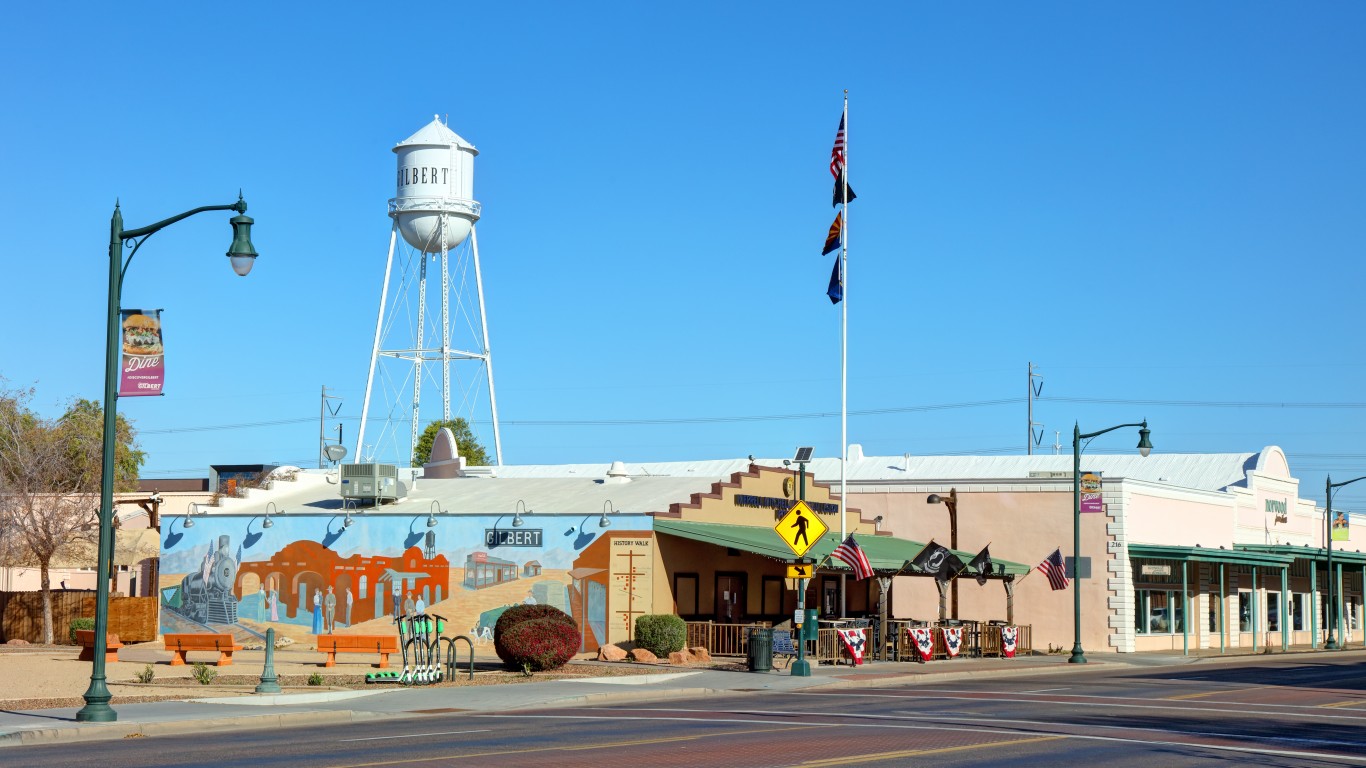
3. Gilbert, Arizona
> Avg time between collisions: 10.8 years
> Likelihood of collision compared to US avg: -1.6% — #155 out of 194 cities
> Motor vehicle fatalities per 100k: 3.1 — #179 out of 194 cities
> Population: 254,115
2. Overland Park, Kansas
> Avg time between collisions: 12.4 years
> Likelihood of collision compared to US avg: -15.0% — #187 out of 194 cities
> Motor vehicle fatalities per 100k: 3.5 — #171 out of 194 cities
> Population: 195,483
[in-text-ad-2]

1. Cary, North Carolina
> Avg time between collisions: 12.0 years
> Likelihood of collision compared to US avg: -12.0% — #182 out of 194 cities
> Motor vehicle fatalities per 100k: 1.8 — #191 out of 194 cities
> Population: 171,143
The Average American Has No Idea How Much Money You Can Make Today (Sponsor)
The last few years made people forget how much banks and CD’s can pay. Meanwhile, interest rates have spiked and many can afford to pay you much more, but most are keeping yields low and hoping you won’t notice.
But there is good news. To win qualified customers, some accounts are paying almost 10x the national average! That’s an incredible way to keep your money safe and earn more at the same time. Our top pick for high yield savings accounts includes other benefits as well. You can earn up to 3.80% with a Checking & Savings Account today Sign up and get up to $300 with direct deposit. No account fees. FDIC Insured.
Click here to see how much more you could be earning on your savings today. It takes just a few minutes to open an account to make your money work for you.
Our top pick for high yield savings accounts includes other benefits as well. You can earn up to 4.00% with a Checking & Savings Account from Sofi. Sign up and get up to $300 with direct deposit. No account fees. FDIC Insured.
Thank you for reading! Have some feedback for us?
Contact the 24/7 Wall St. editorial team.

Our expert who first called NVIDIA in 2009 is predicting 2025 will see a historic AI breakthrough.
You can follow him investing $500,000 of his own money on our top AI stocks for free.