Data on homelessness in the United States is inexact. By most measures, the figure is slightly less than 600,000. However, people who are homeless for brief periods number differently from those who are constantly homeless – and the figures have changed over the course of the COVID-19 pandemic. For reasons at least partly related to the pandemic, a portion of Americans – as high as 35% in some states – say they have missed their rent or mortgage payments or have low confidence that they can pay next month’s, according to the U.S. Census Bureau’s Household Pulse Survey. (These are states where people can’t pay their mortgages.)
Among the aspects of the homeless problem which are commonly discussed is that the country is nowhere near finding a solution. Another is that solutions, even those which partially address the problem, have been expensive. According to CNBC, New York City spent $3 billion to support its homeless population in 2019. And by current measures, New York is the state with the most homeless people per capita in America.
To compile a list of homeless numbers in every state, 24/7 Tempo reviewed the most comprehensive study of homelessness in America, State of Homelessness: 2021 Edition, published by the National Alliance to End Homelessness.
As invaluable as the study is, the authors point to one important drawback to the work:
“The current report,” they point out, “draws from the nationwide Point-in-Time Count that occurred in January of 2020, just a few weeks before COVID-19 was declared a national emergency. Thus, the data does not reflect any of the changes brought about by the crisis.”
The report looks at a number of aspects of the problem, based first and foremost on demographics and geographic data. The foundation of the report is that 580,466 experienced homelessness in January 2020. About a third were families with children. Data about veterans and unaccompanied youth have also been collected. The study also captured information on which people are sheltered homeless and which people were unsheltered.
Men are much more likely to be homeless than women. White Americans are more likely to be homeless than Black Americans. However, since there are many more whites than Blacks, this number has only partial value.
Over the past decade and a half, homelessness started to fall but rose quickly again in the past few years. There were 657,248 homeless Americans in 2007. Of course, this was at the start of the Great Recession. It dropped to 549,528 in 2016. (These are America’s richest and poorest states.)
Logically, the largest state in the country based on population would have the most homeless people. This is true. California had 161,548 in 2020. This population relation breaks down based on the next state. New York ranks fourth among states in population behind California, Texas, and Florida. It ranked second in the homeless population at 91,271. This is primarily because of the size of this population in New York City.
Raw population, therefore, may not be the best way to evaluate homelessness by geography. Another way the study looks at homelessness is per 10,000 people of the total population. On that basis, New York State has the highest number at 46.9, followed by Hawaii at 45.6 and California at 40.9.
Click here to see the state with the most homeless people

50. Mississippi
>Rate per 10,000: 3.7
>Total 2019 population: 2,976,149 — 17th lowest
[in-text-ad]

49. Louisiana
>Rate per 10,000: 6.8
>Total 2019 population: 4,648,794 — 25th highest
[recirclink id=877651]

48. Alabama
>Rate per 10,000: 6.8
>Total 2019 population: 4,903,185 — 24th highest

47. Virginia
>Rate per 10,000: 7.0
>Total 2019 population: 8,535,519 — 12th highest
[in-text-ad-2]

46. North Dakota
>Rate per 10,000: 7.1
>Total 2019 population: 762,062 — 4th lowest

45. West Virginia
>Rate per 10,000: 7.5
>Total 2019 population: 1,792,147 — 13th lowest
[in-text-ad]
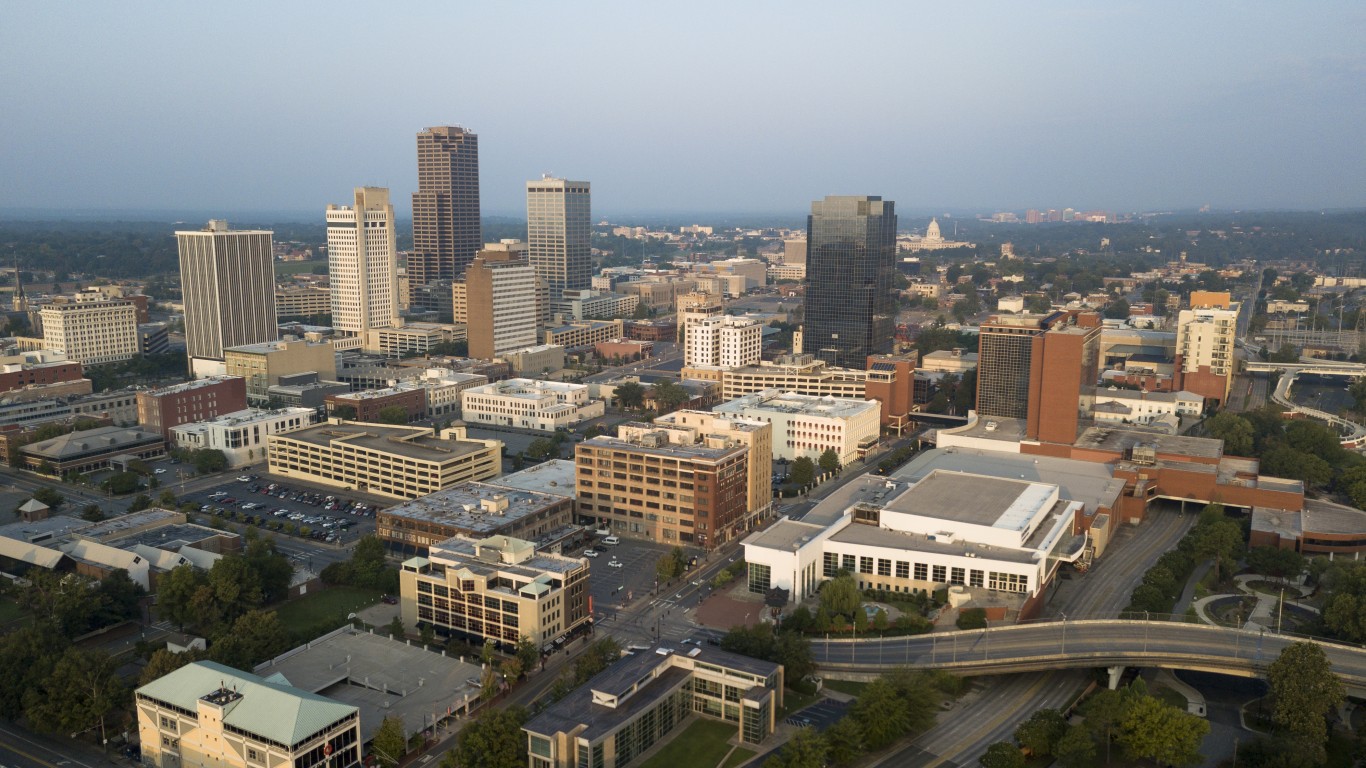
44. Arkansas
>Rate per 10,000: 7.8
>Total 2019 population: 3,017,804 — 18th lowest
[recirclink id=947757]
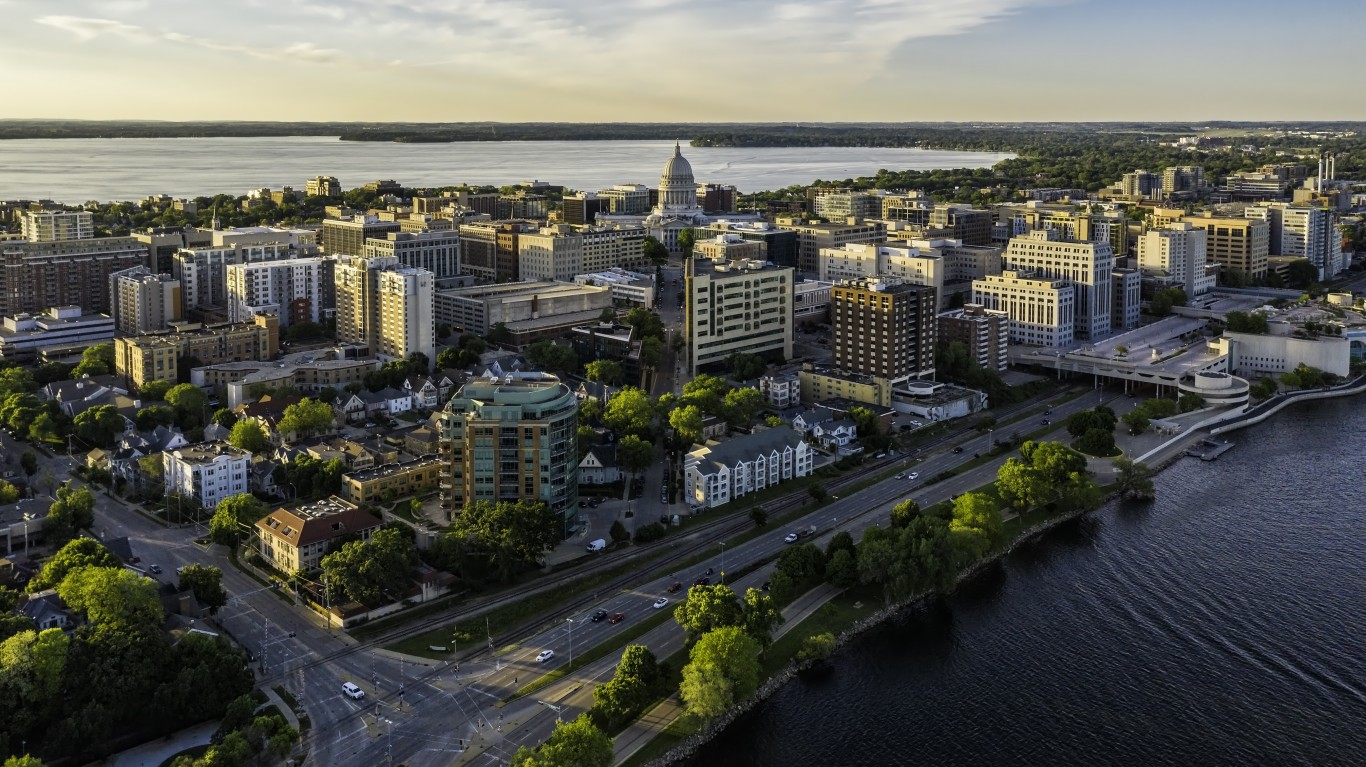
43. Wisconsin
>Rate per 10,000: 7.8
>Total 2019 population: 5,822,434 — 20th highest

42. Connecticut
>Rate per 10,000: 8.1
>Total 2019 population: 3,565,287 — 22nd lowest
[in-text-ad-2]

41. Illinois
>Rate per 10,000: 8.2
>Total 2019 population: 12,671,821 — 6th highest

40. South Carolina
>Rate per 10,000: 8.3
>Total 2019 population: 5,148,714 — 23rd highest
[in-text-ad]

39. Kansas
>Rate per 10,000: 8.4
>Total 2019 population: 2,913,314 — 16th lowest
[recirclink id=980634]

38. Iowa
>Rate per 10,000: 8.4
>Total 2019 population: 3,155,070 — 20th lowest

37. Indiana
>Rate per 10,000: 8.4
>Total 2019 population: 6,732,219 — 17th highest
[in-text-ad-2]

36. Michigan
>Rate per 10,000: 8.6
>Total 2019 population: 9,986,857 — 10th highest

35. North Carolina
>Rate per 10,000: 8.8
>Total 2019 population: 10,488,084 — 9th highest
[in-text-ad]

34. Kentucky
>Rate per 10,000: 9.0
>Total 2019 population: 4,467,673 — 25th lowest
[recirclink id=948347]
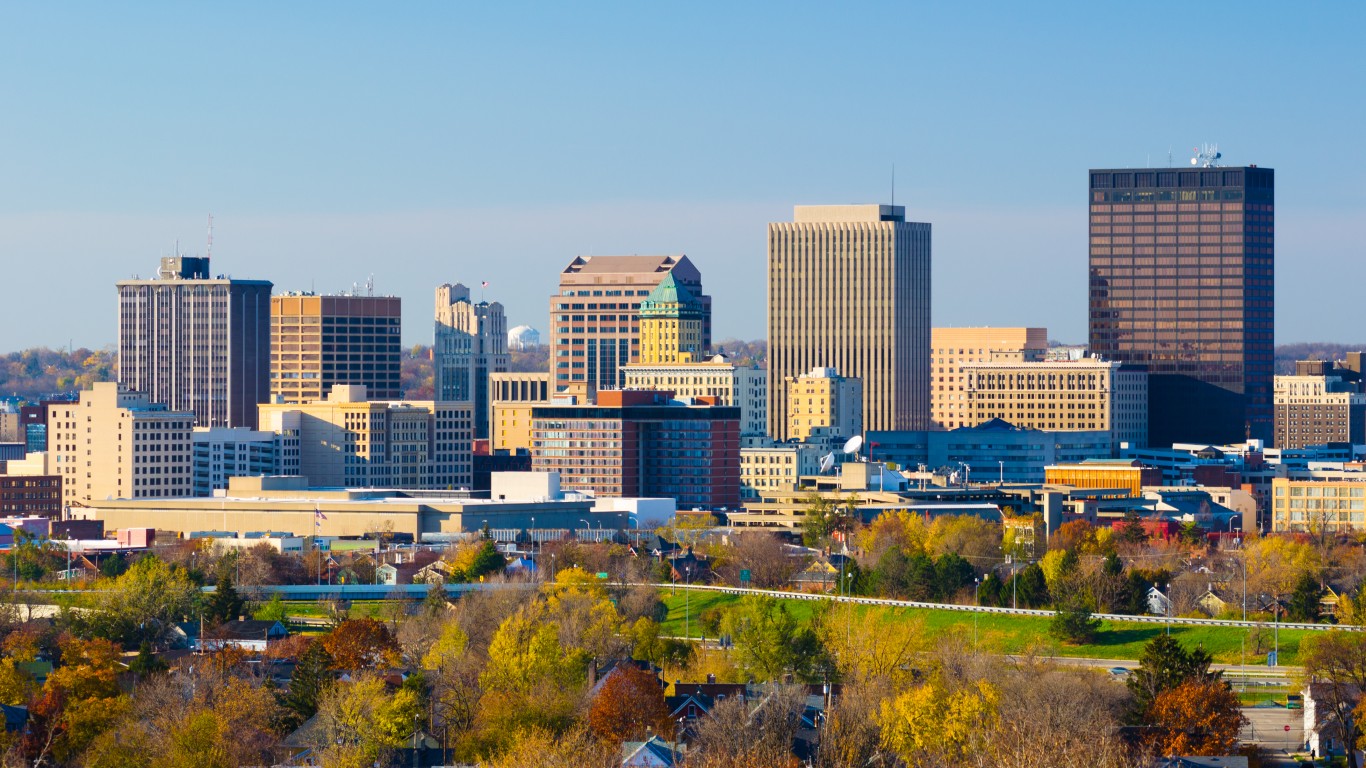
33. Ohio
>Rate per 10,000: 9.1
>Total 2019 population: 11,689,100 — 7th highest

32. Texas
>Rate per 10,000: 9.4
>Total 2019 population: 28,995,881 — 2nd highest
[in-text-ad-2]

31. Georgia
>Rate per 10,000: 9.6
>Total 2019 population: 10,617,423 — 8th highest

30. Utah
>Rate per 10,000: 9.8
>Total 2019 population: 3,205,958 — 21st lowest
[in-text-ad]

29. Oklahoma
>Rate per 10,000: 9.9
>Total 2019 population: 3,956,971 — 23rd lowest
[recirclink id=946051]

28. Rhode Island
>Rate per 10,000: 10.4
>Total 2019 population: 1,059,361 — 7th lowest

27. Pennsylvania
>Rate per 10,000: 10.4
>Total 2019 population: 12,801,989 — 5th highest
[in-text-ad-2]

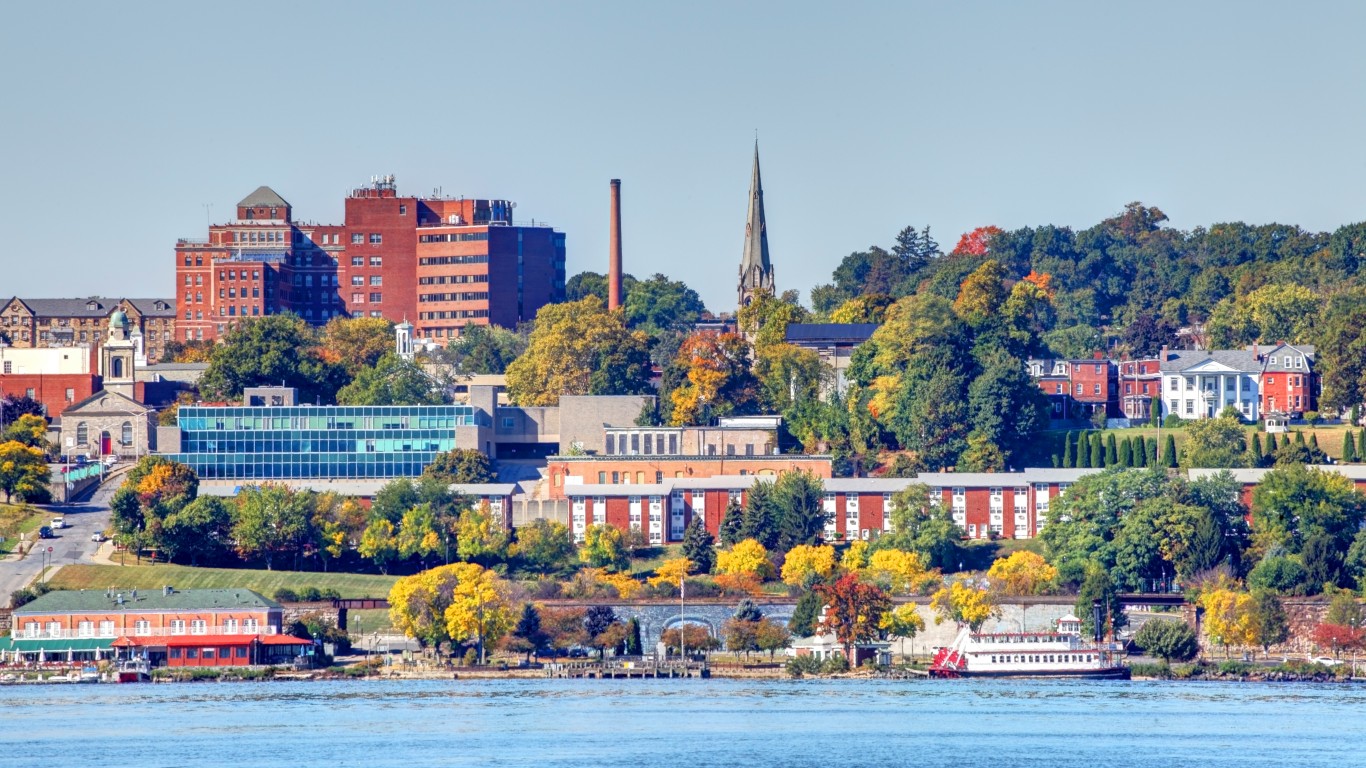
26. Maryland
>Rate per 10,000: 10.5
>Total 2019 population: 6,045,680 — 19th highest
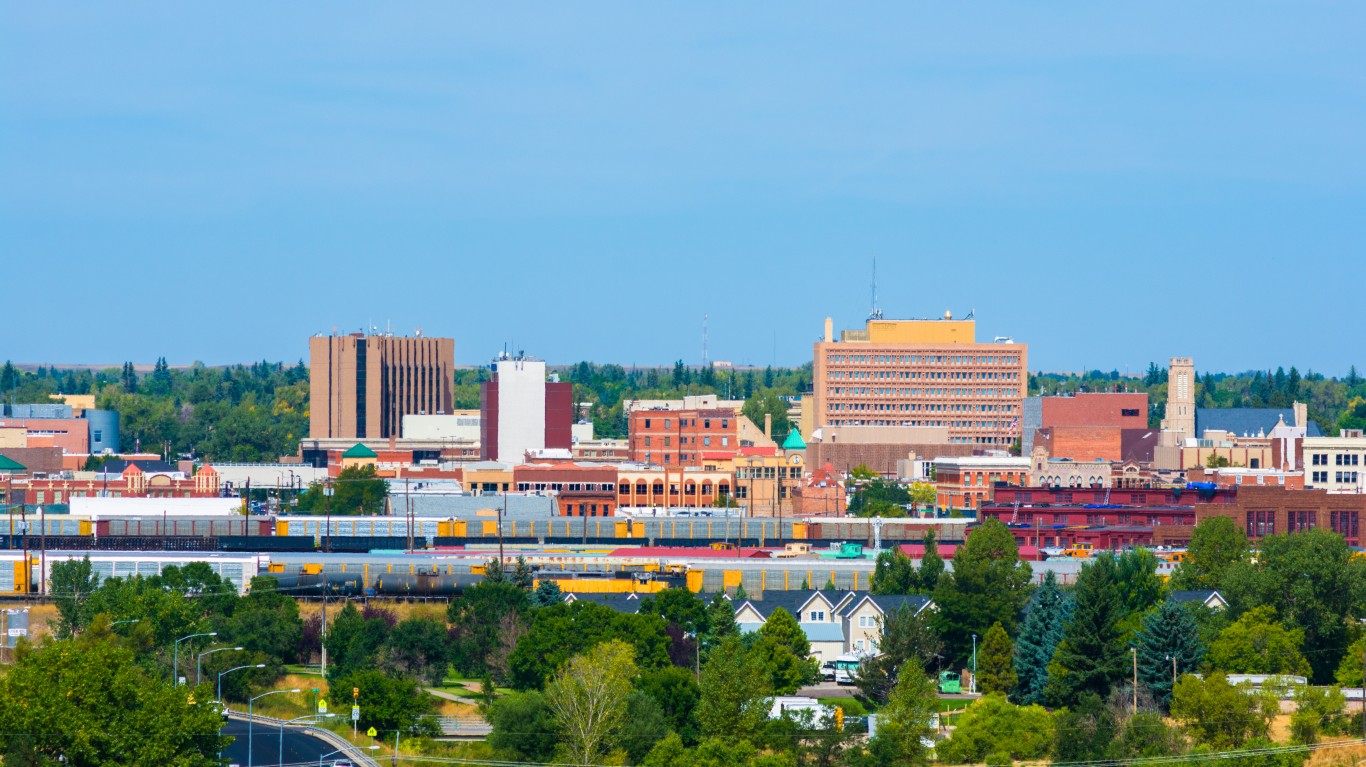
25. Wyoming
>Rate per 10,000: 10.6
>Total 2019 population: 578,759 — the lowest
[in-text-ad]

24. Missouri
>Rate per 10,000: 10.6
>Total 2019 population: 6,137,428 — 18th highest
[recirclink id=877651]
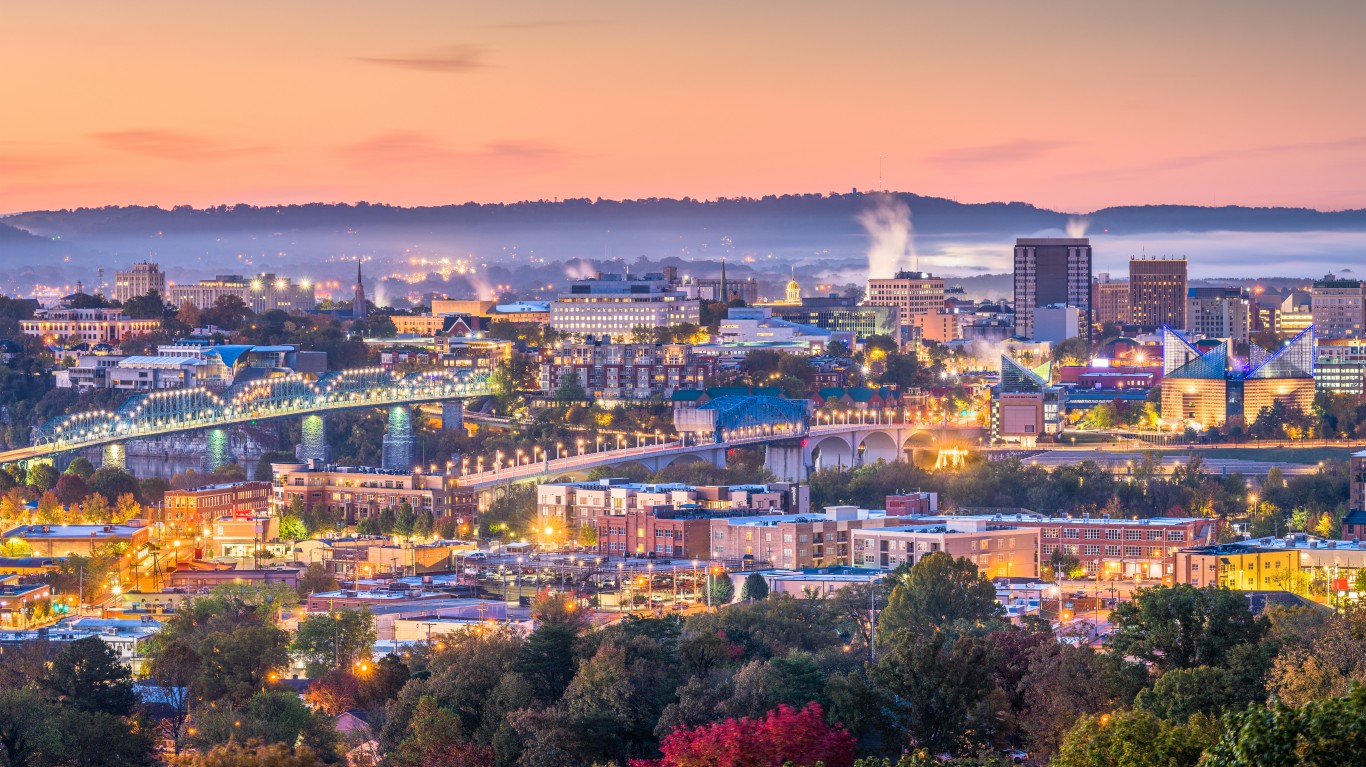
23. Tennessee
>Rate per 10,000: 10.6
>Total 2019 population: 6,829,174 — 16th highest

22. New Jersey
>Rate per 10,000: 10.9
>Total 2019 population: 8,882,190 — 11th highest
[in-text-ad-2]

21. South Dakota
>Rate per 10,000: 12.0
>Total 2019 population: 884,659 — 5th lowest

20. Delaware
>Rate per 10,000: 12.0
>Total 2019 population: 973,764 — 6th lowest
[in-text-ad]

19. New Hampshire
>Rate per 10,000: 12.3
>Total 2019 population: 1,359,711 — 10th lowest
[recirclink id=947757]

18. Nebraska
>Rate per 10,000: 12.4
>Total 2019 population: 1,934,408 — 14th lowest

17. Florida
>Rate per 10,000: 12.8
>Total 2019 population: 21,477,737 — 3rd highest
[in-text-ad-2]
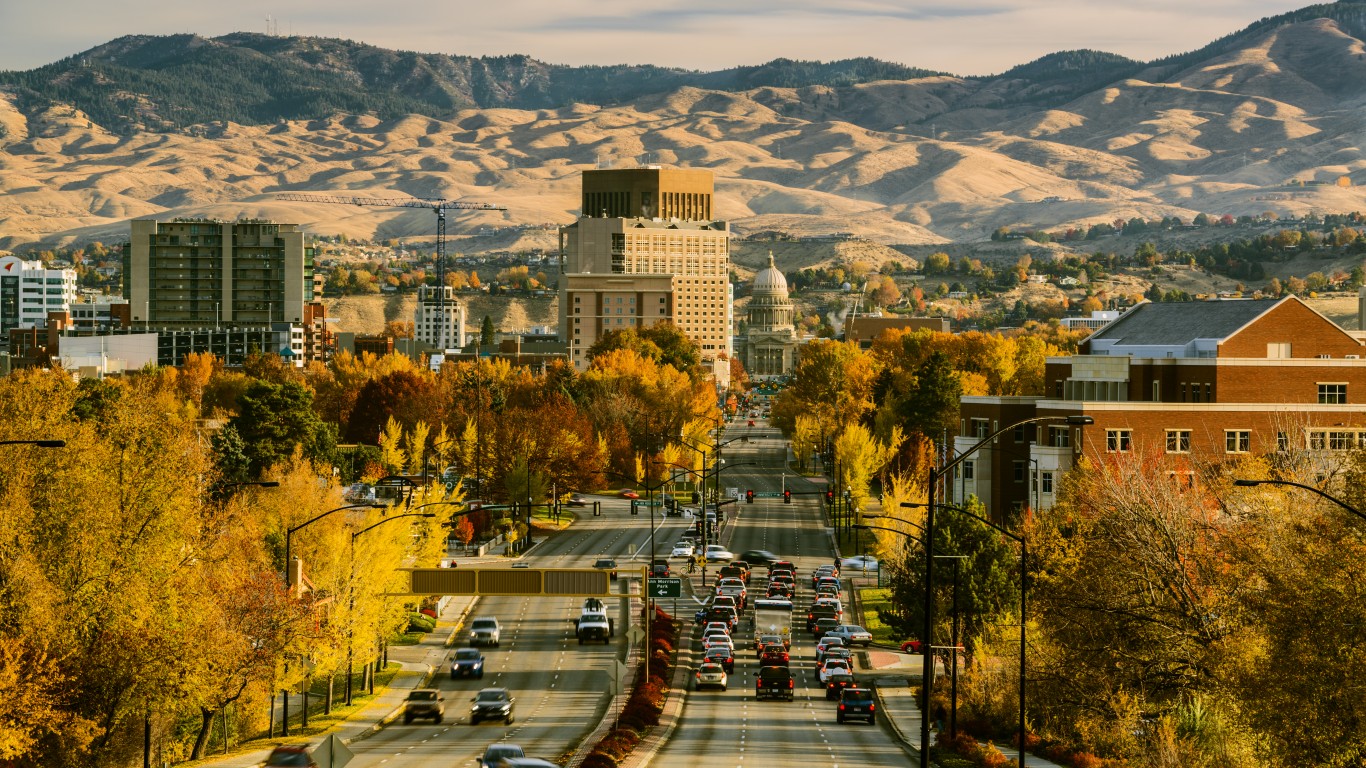
16. Idaho
>Rate per 10,000: 13.0
>Total 2019 population: 1,787,065 — 12th lowest

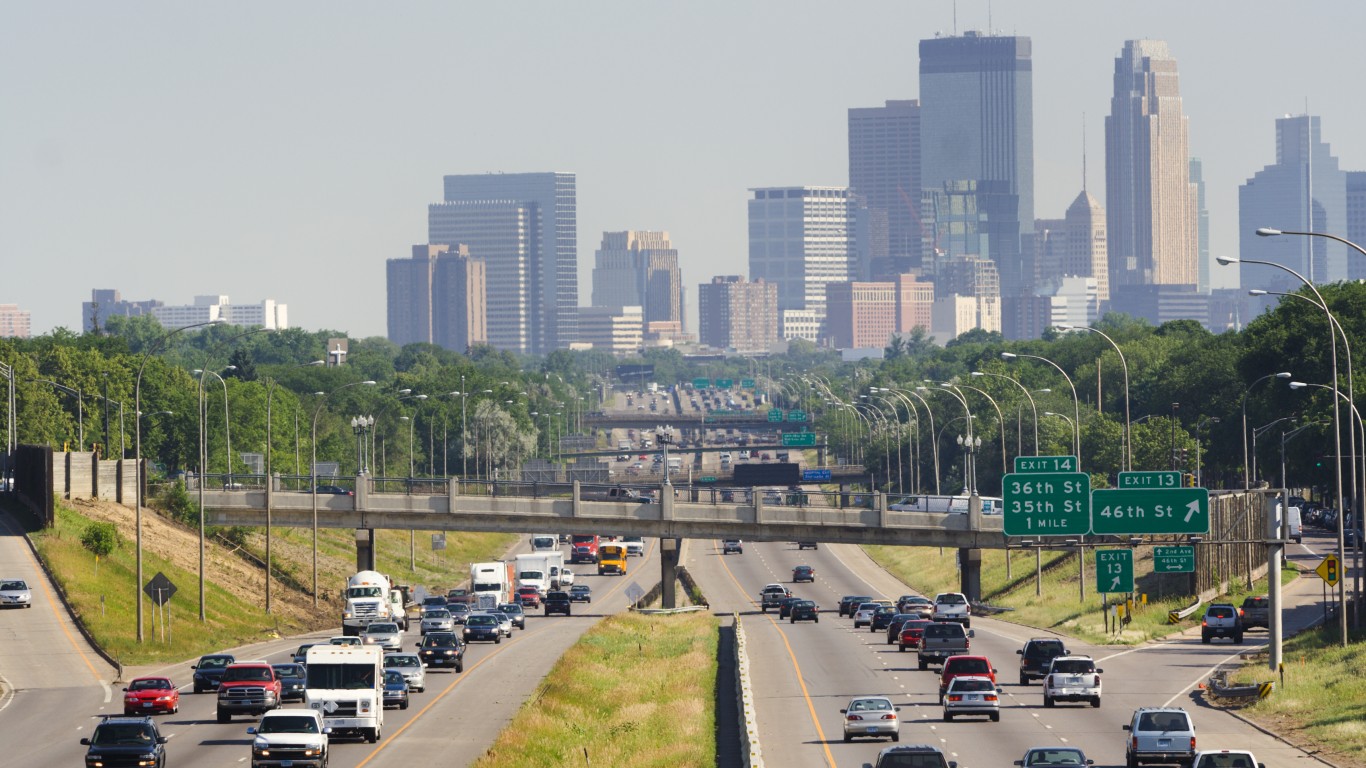
15. Minnesota
>Rate per 10,000: 14.1
>Total 2019 population: 5,639,632 — 22nd highest
[in-text-ad]
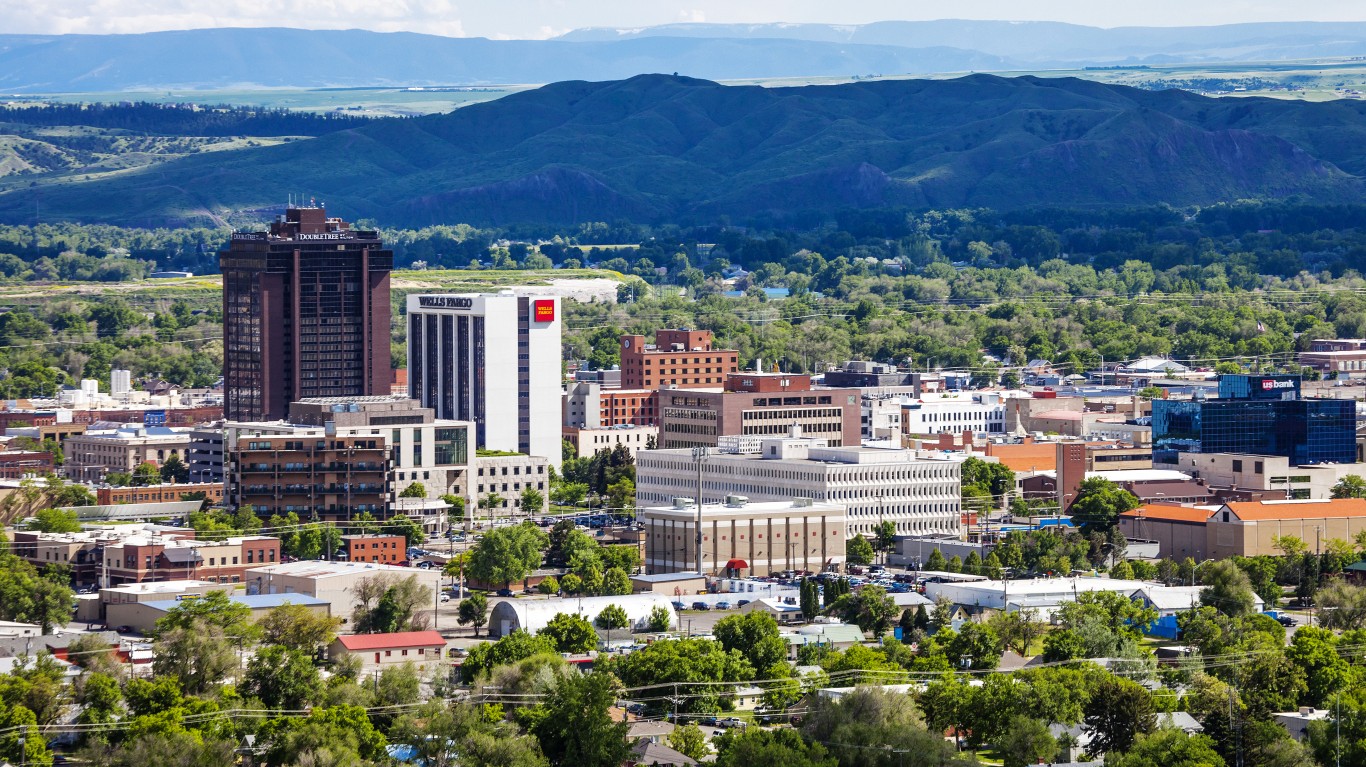
14. Montana
>Rate per 10,000: 14.5
>Total 2019 population: 1,068,778 — 8th lowest
[recirclink id=980634]

13. Arizona
>Rate per 10,000: 15.1
>Total 2019 population: 7,278,717 — 14th highest

12. Maine
>Rate per 10,000: 15.6
>Total 2019 population: 1,344,212 — 9th lowest
[in-text-ad-2]
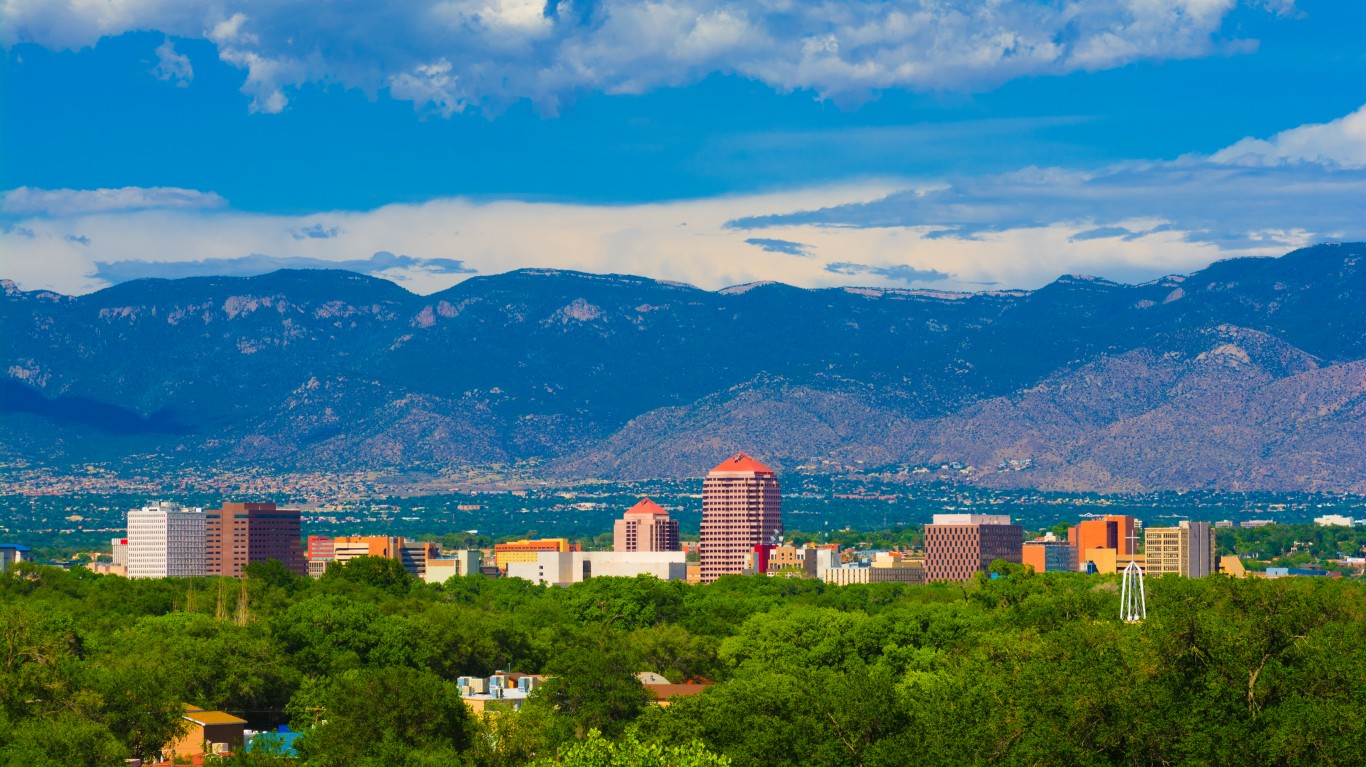
11. New Mexico
>Rate per 10,000: 15.9
>Total 2019 population: 2,096,829 — 15th lowest
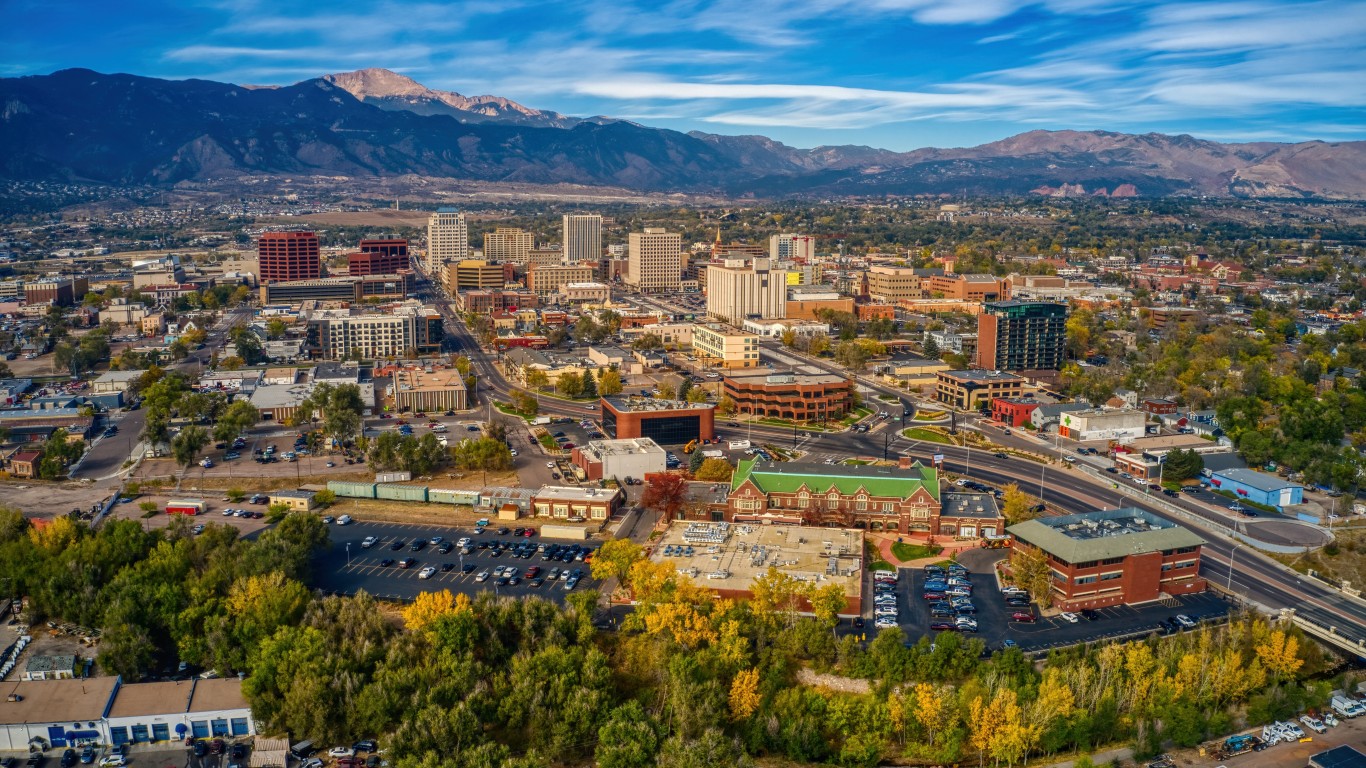
10. Colorado
>Rate per 10,000: 17.1
>Total 2019 population: 5,758,736 — 21st highest
[in-text-ad]

9. Vermont
>Rate per 10,000: 17.8
>Total 2019 population: 623,989 — 2nd lowest
[recirclink id=948347]

8. Nevada
>Rate per 10,000: 22.4
>Total 2019 population: 3,080,156 — 19th lowest

7. Massachusetts
>Rate per 10,000: 26.1
>Total 2019 population: 6,892,503 — 15th highest
[in-text-ad-2]
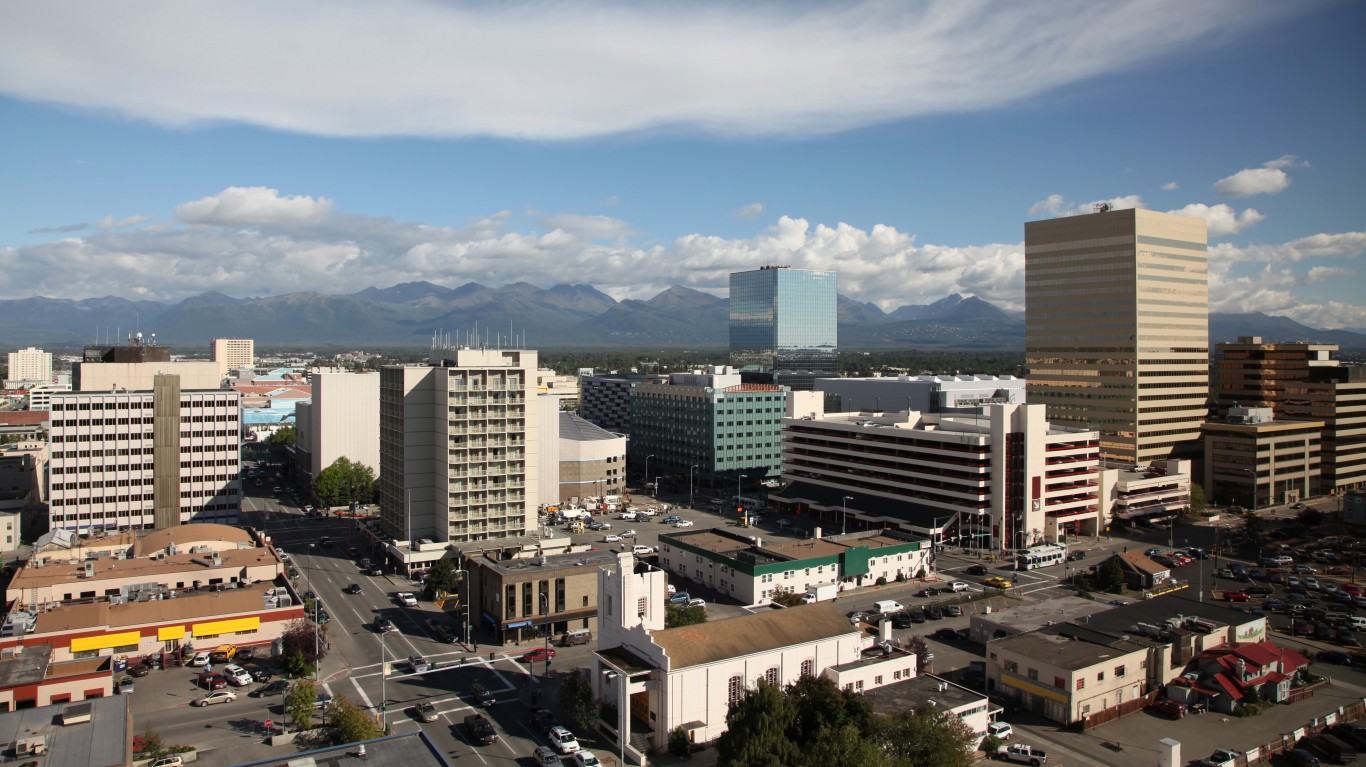
6. Alaska
>Rate per 10,000: 26.6
>Total 2019 population: 731,545 — 3rd lowest

5. Washington
>Rate per 10,000: 30.1
>Total 2019 population: 7,614,893 — 13th highest
[in-text-ad]

4. Oregon
>Rate per 10,000: 34.7
>Total 2019 population: 4,217,737 — 24th lowest
[recirclink id=946051]

3. California
>Rate per 10,000: 40.9
>Total 2019 population: 39,512,223 — the highest

2. Hawaii
>Rate per 10,000: 45.6
>Total 2019 population: 1,415,872 — 11th lowest
[in-text-ad-2]
1. New York
>Rate per 10,000: 46.9
>Total 2019 population: 19,453,561 — 4th highest