
The United States is an incredibly diverse country. For centuries it has attracted immigrants from all over the world, particularly since the Immigration and Nationality Act of 1965, which ended an admissions policy based on race and ethnicity. (Here is the number of legal immigrants to the U.S. every year since 1990.)
Of course the population doesn’t just consist of immigrants and their descendants: There are also 6.79 million Native Americans in the country, accounting for about 2.09% of the total population. Some 15 states have Native American populations of over 100,000. (Learn how many Native Americans live in every state.)
Among those Americans whose ancestors did come from someplace else – whether hundreds of years ago or last week – many different nationalities and ethnicities are represented. To identify 24/7 Tempo has identified the most distinctive ancestry in every state using data from the American Community Survey (ACS) for the years 2015 to 2019.
Ancestries were considered distinctive if they exist in a state in numbers disproportionate to the national average. Some of our findings won’t surprise anybody. For example, the most distinctive ancestry in Louisiana is Cajun, claimed by a 1.24% share of the population, versus 0.03% for the country as a whole. On the other hand, by our methodology, the most disproportionate ancestry in New York, unexpectedly, is Vincent-Grenadine Islander, since a 0.05% share of the population claims it – 11.1 times greater than the 0.01% share of the nation’s population as a whole.
Ancestries are self-reported, and in some cases may seem disingenuous. Alabama’s entry on the list, “American,” seems to sidestep the intentions of the Census Bureau survey (unless the respondents were Native American, which is not indicated). Likewise, one state chose a self-referential ancestry – Texas, claiming “Texan.” (Note, too, that the Census Bureau uses the outmoded and potentially offensive term “Eskimo” as a possible ancestral group, rather than “Inuit,” generally considered preferable.)
Click here to see the most distinctive ancestry in every state
Click here to read our detailed methodology
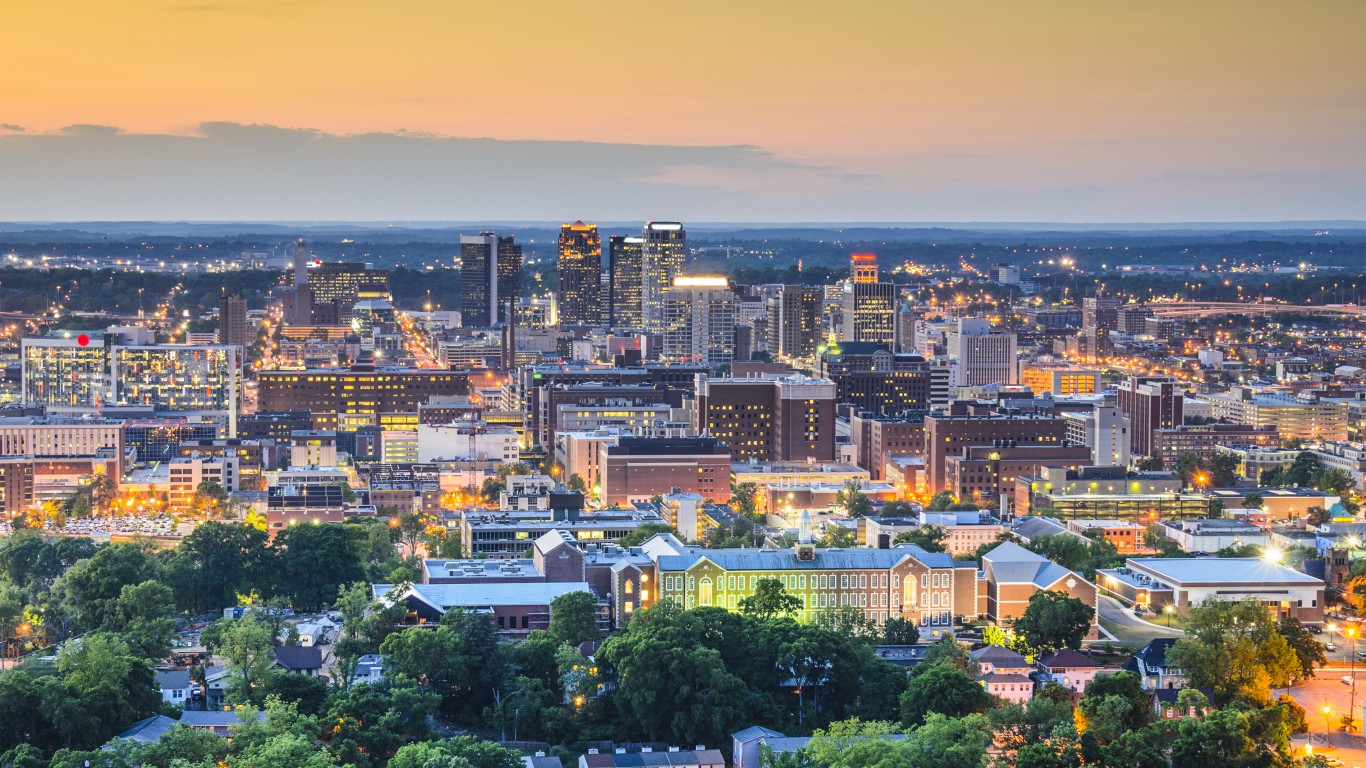
Alabama
> Most unusual ancestry: American
> Share of Alabama residents who report “American” ancestry: 19.87% (3.0 times greater than share of US population)
> Alabama residents with “American” ancestry: 733,897
> Share of US pop. with American ancestry: 6.52%
[in-text-ad]
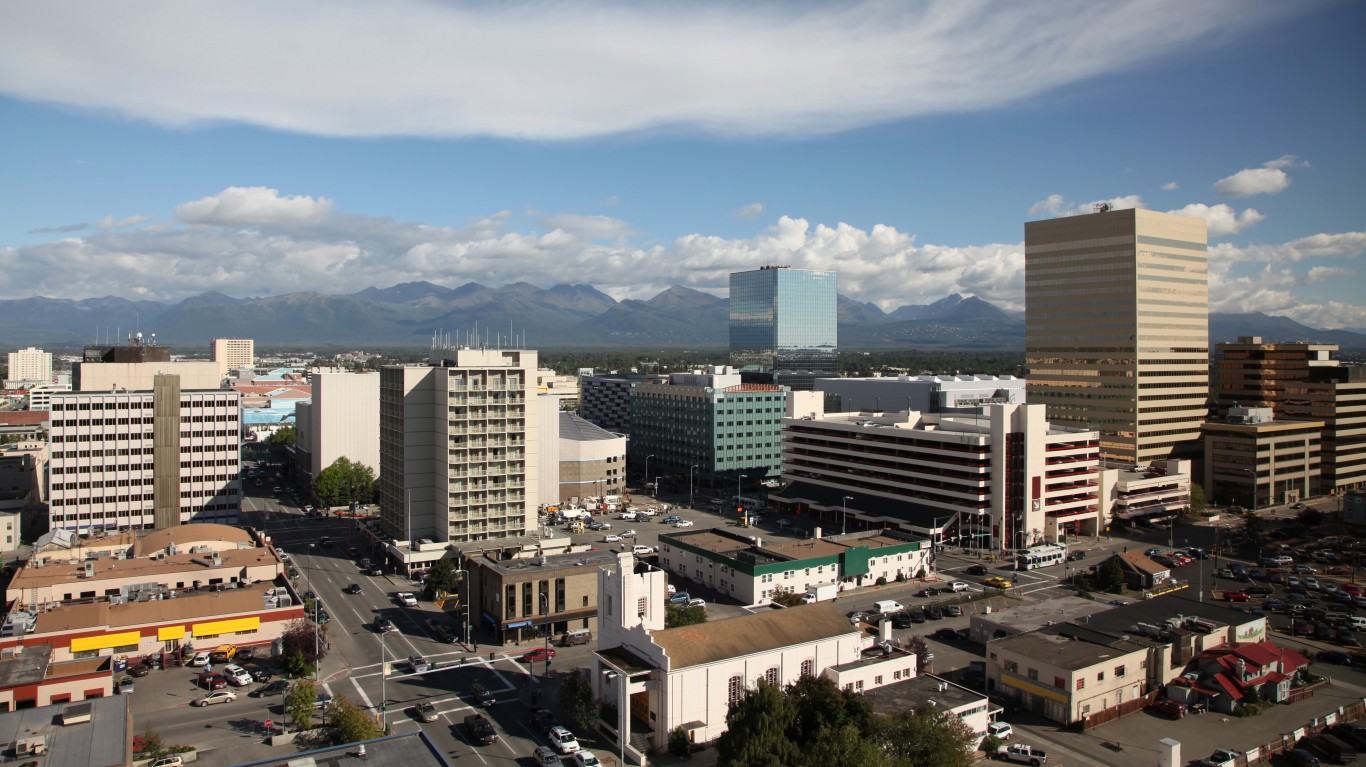
Alaska
> Most unusual ancestry: “Eskimo” [Inuit]
> Share of Alaska residents who report “Eskimo” [Inuit] ancestry: 7.66% (379.7 times greater than share of US population)
> Alaska residents with “Eskimo” [Inuit] ancestry: 46,011
> Share of US pop. with “Eskimo” [Inuit] ancestry: 0.02%

Arizona
> Most unusual ancestry: Kuwaiti
> Share of Arizona residents who report Kuwaiti ancestry: 0.01% (5.4 times greater than share of US population)
> Arizona residents with Kuwaiti ancestry: 498
> Share of US pop. with Kuwaiti ancestry: <0.01%
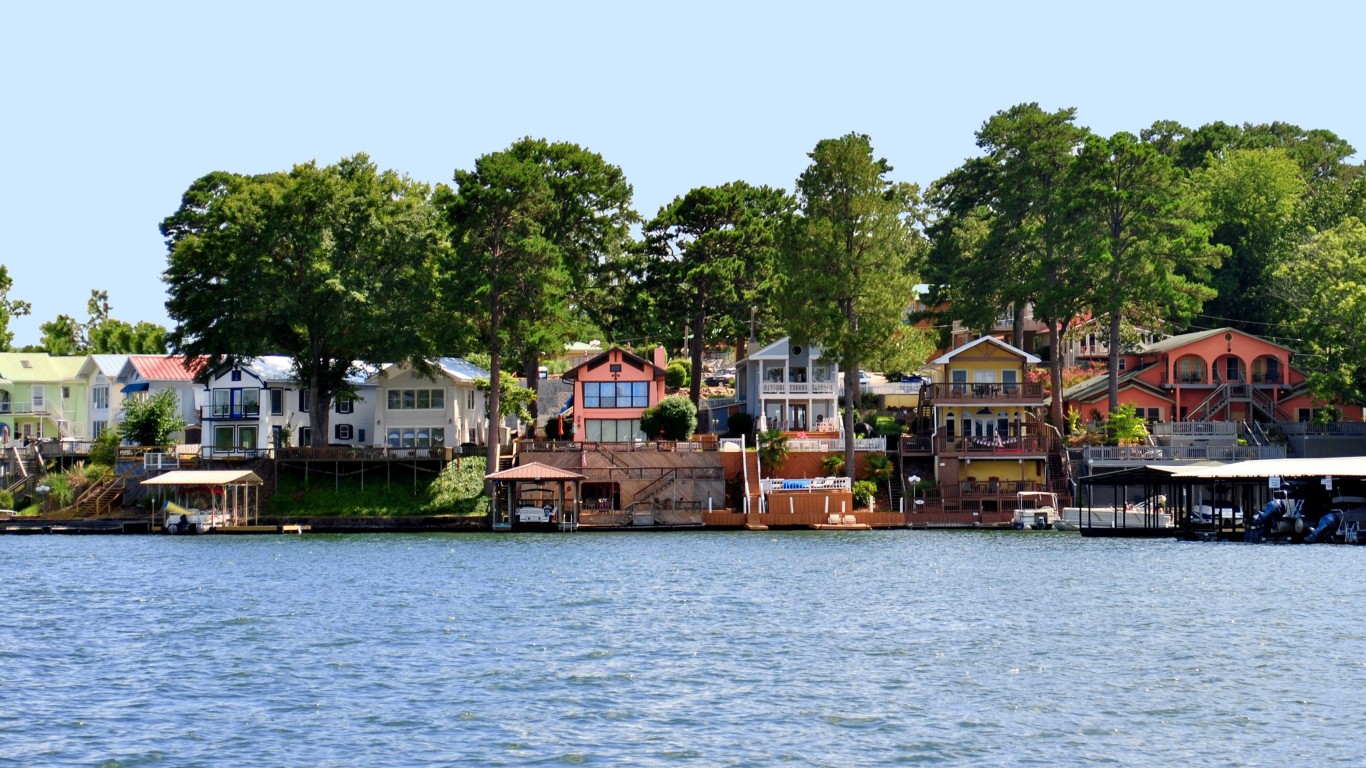
Arkansas
> Most unusual ancestry: Marshallese
> Share of Arkansas residents who report Marshallese ancestry: 0.37% (31.8 times greater than share of US population)
> Arkansas residents with Marshallese ancestry: 7,934
> Share of US pop. with Marshallese ancestry: 0.01%
[in-text-ad-2]
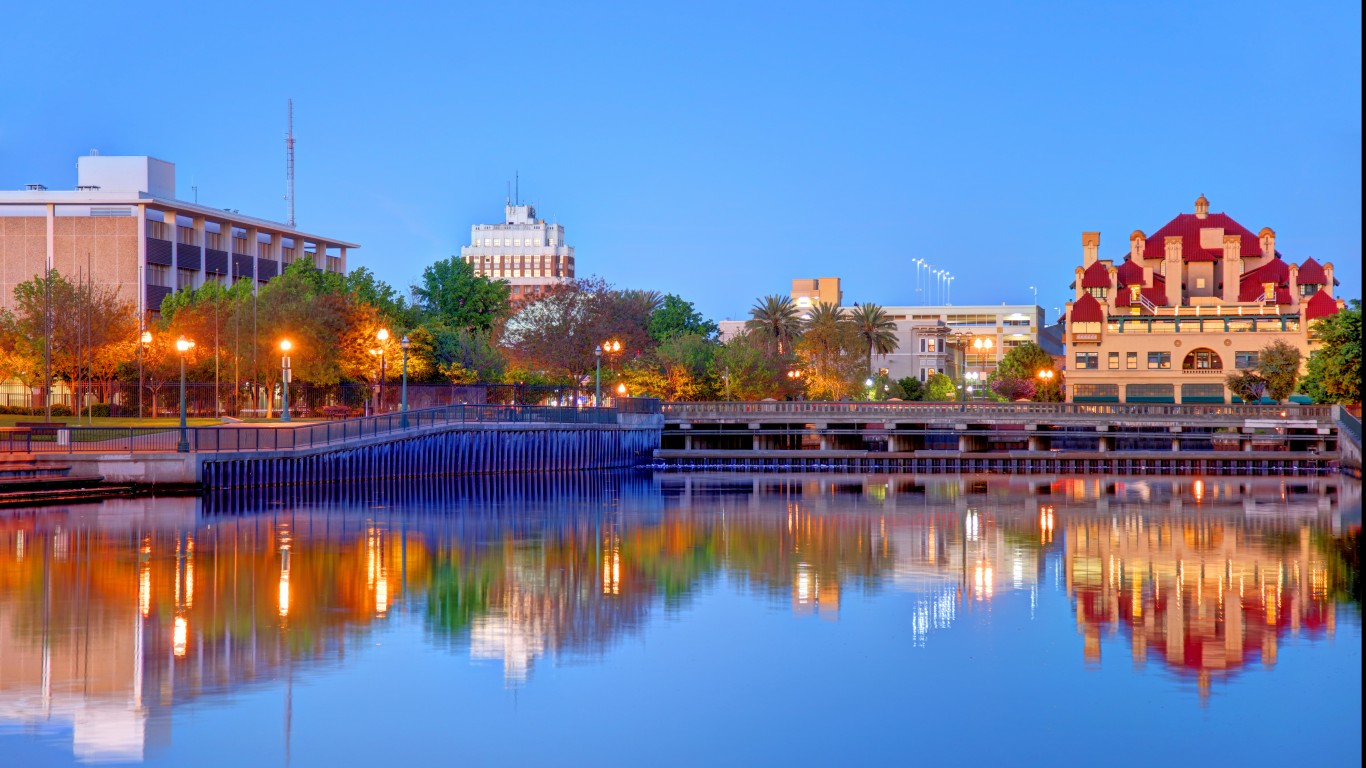
California
> Most unusual ancestry: Fijian
> Share of California residents who report Fijian ancestry: 0.07% (5.9 times greater than share of US population)
> California residents with Fijian ancestry: 22,094
> Share of US pop. with Fijian ancestry: 0.01%
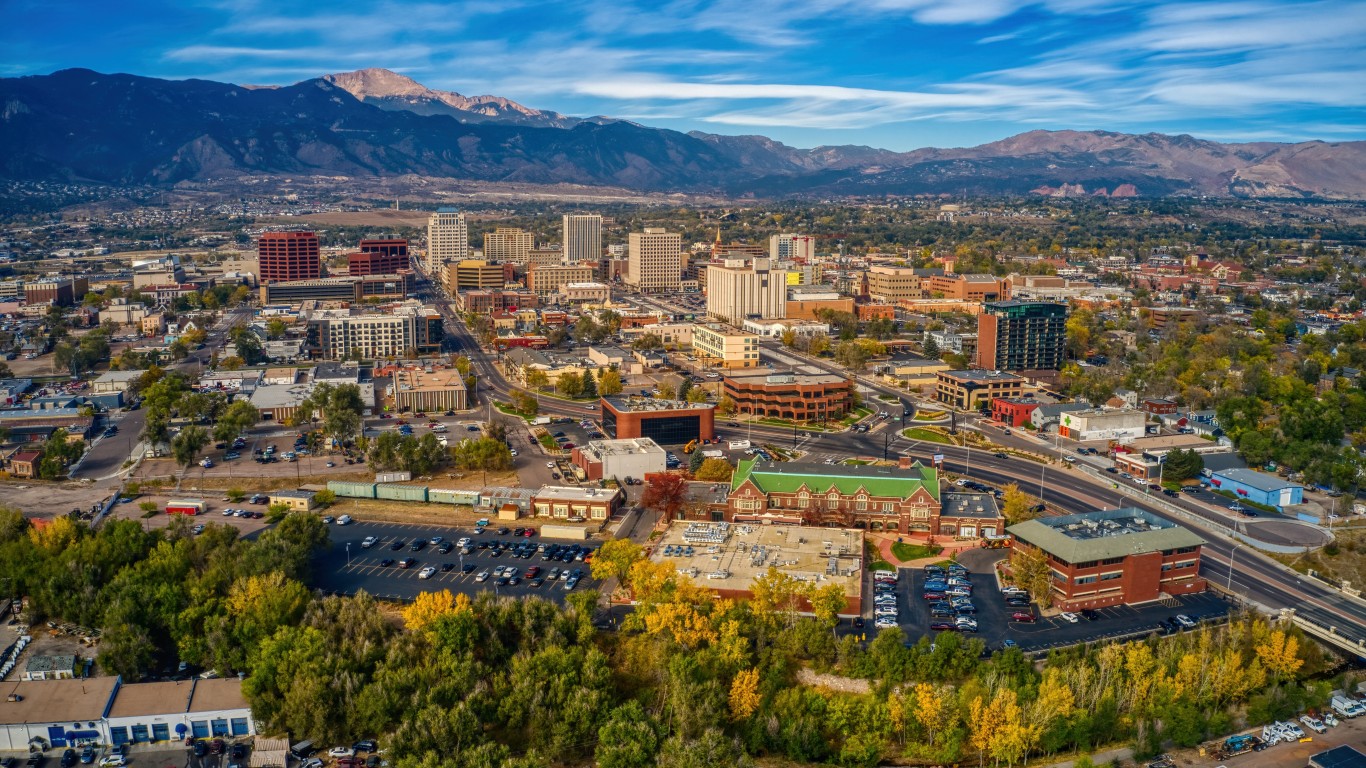
Colorado
> Most unusual ancestry: Chicano
> Share of Colorado residents who report Chicano ancestry: 0.14% (6.7 times greater than share of US population)
> Colorado residents with Chicano ancestry: 6,053
> Share of US pop. with Chicano ancestry: 0.02%
[in-text-ad]

Connecticut
> Most unusual ancestry: Libyan
> Share of Connecticut residents who report Libyan ancestry: 0.01% (5.7 times greater than share of US population)
> Connecticut residents with Libyan ancestry: 310
> Share of US pop. with Libyan ancestry: <0.01%
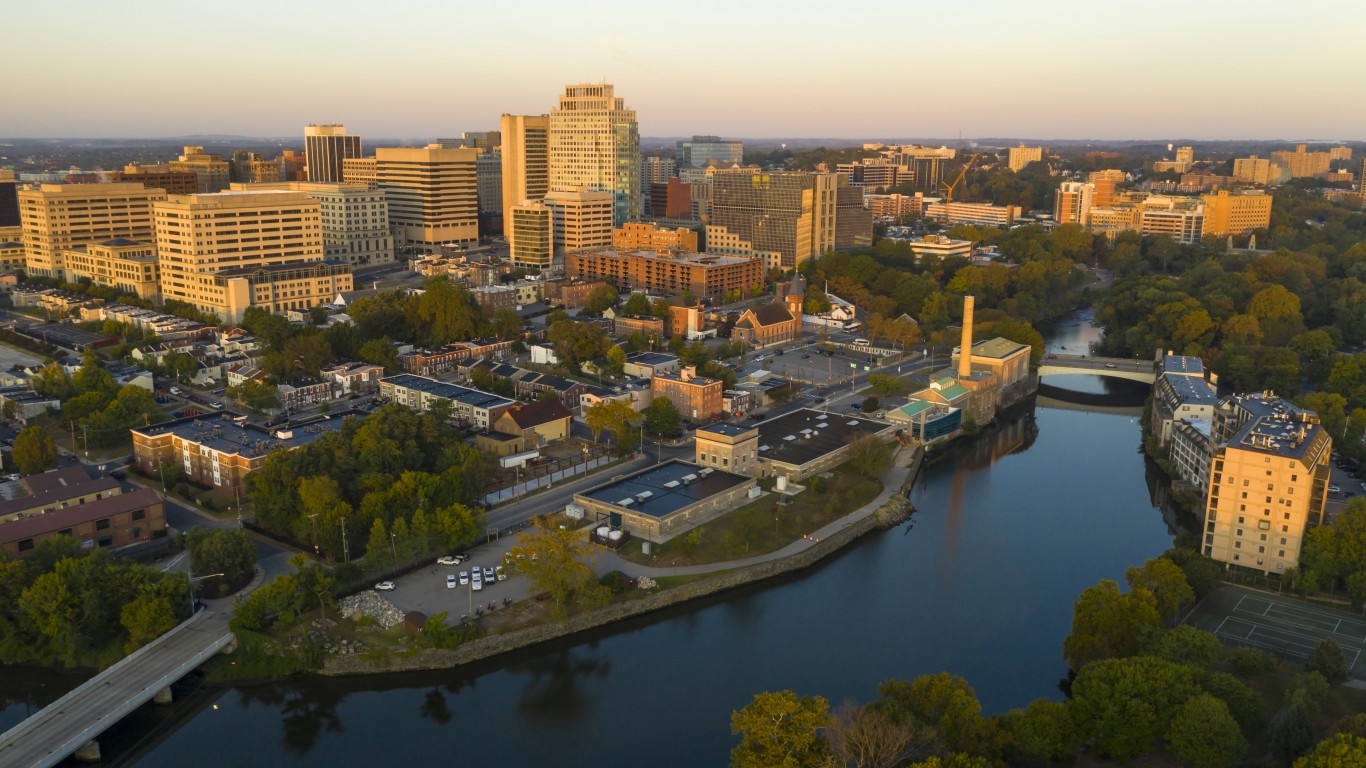
Delaware
> Most unusual ancestry: Kenyan
> Share of Delaware residents who report Kenyan ancestry: 0.17% (5.7 times greater than share of US population)
> Delaware residents with Kenyan ancestry: 1,186
> Share of US pop. with Kenyan ancestry: 0.03%
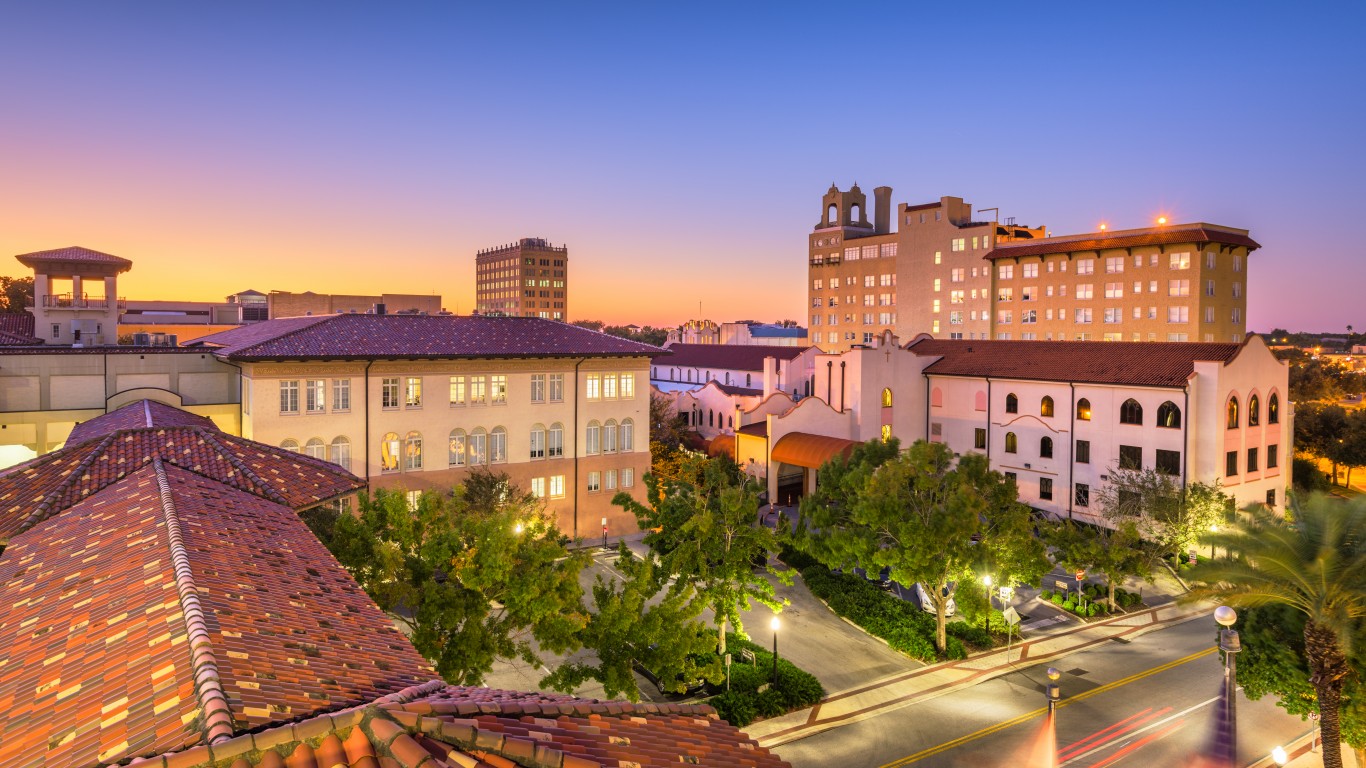
Florida
> Most unusual ancestry: Cuban
> Share of Florida residents who report Cuban ancestry: 7.16% (10.7 times greater than share of US population)
> Florida residents with Cuban ancestry: 1,231,058
> Share of US pop. with Cuban ancestry: 0.67%
[in-text-ad-2]

Georgia
> Most unusual ancestry: Cherokee
> Share of Georgia residents who report Cherokee ancestry: 0.72% (2.9 times greater than share of US population)
> Georgia residents with Cherokee ancestry: 60,020
> Share of US pop. with Cherokee ancestry: 0.25%

Hawaii
> Most unusual ancestry: Hawaiian
> Share of Hawaii residents who report Hawaiian ancestry: 16.30% (122.8 times greater than share of US population)
> Hawaii residents with Hawaiian ancestry: 201,784
> Share of US pop. with Hawaiian ancestry: 0.13%
[in-text-ad]
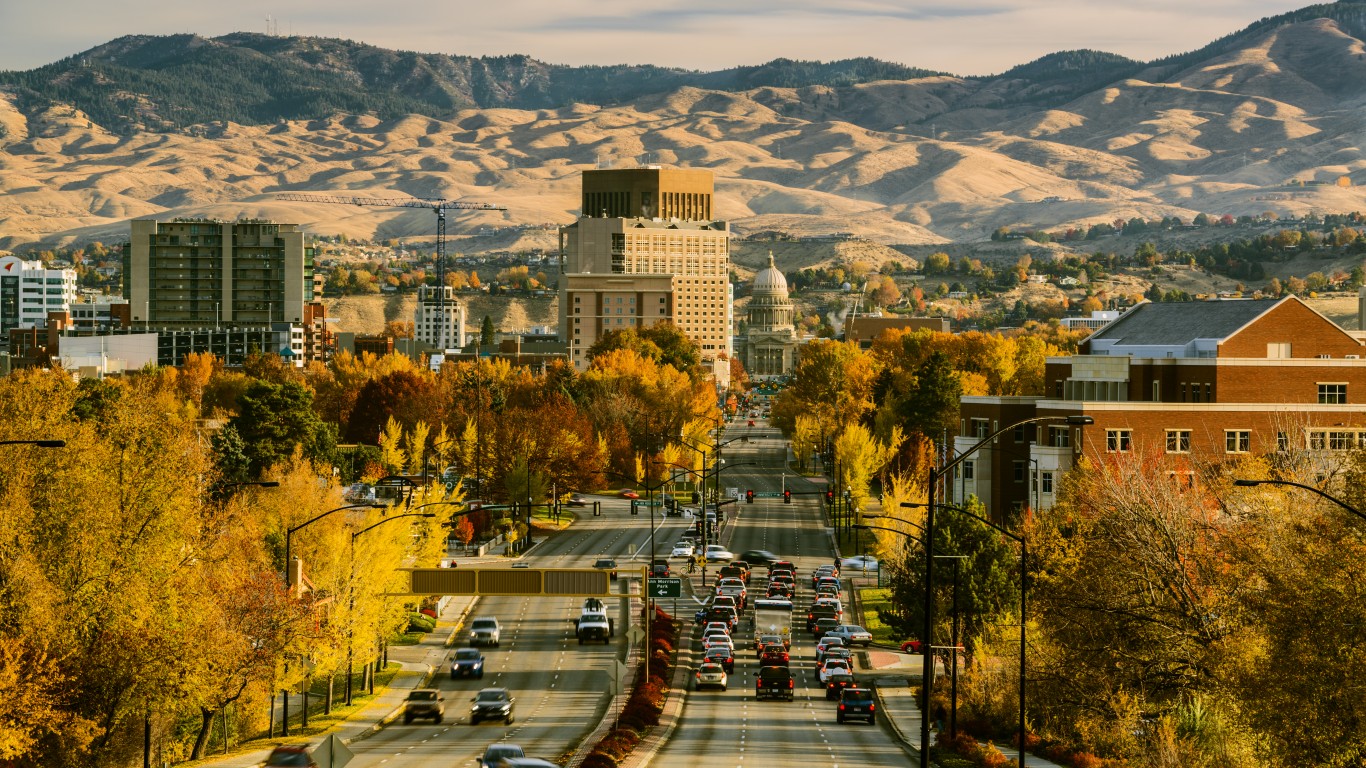
Idaho
> Most unusual ancestry: Basque
> Share of Idaho residents who report Basque ancestry: 0.43% (26.3 times greater than share of US population)
> Idaho residents with Basque ancestry: 5,802
> Share of US pop. with Basque ancestry: 0.02%
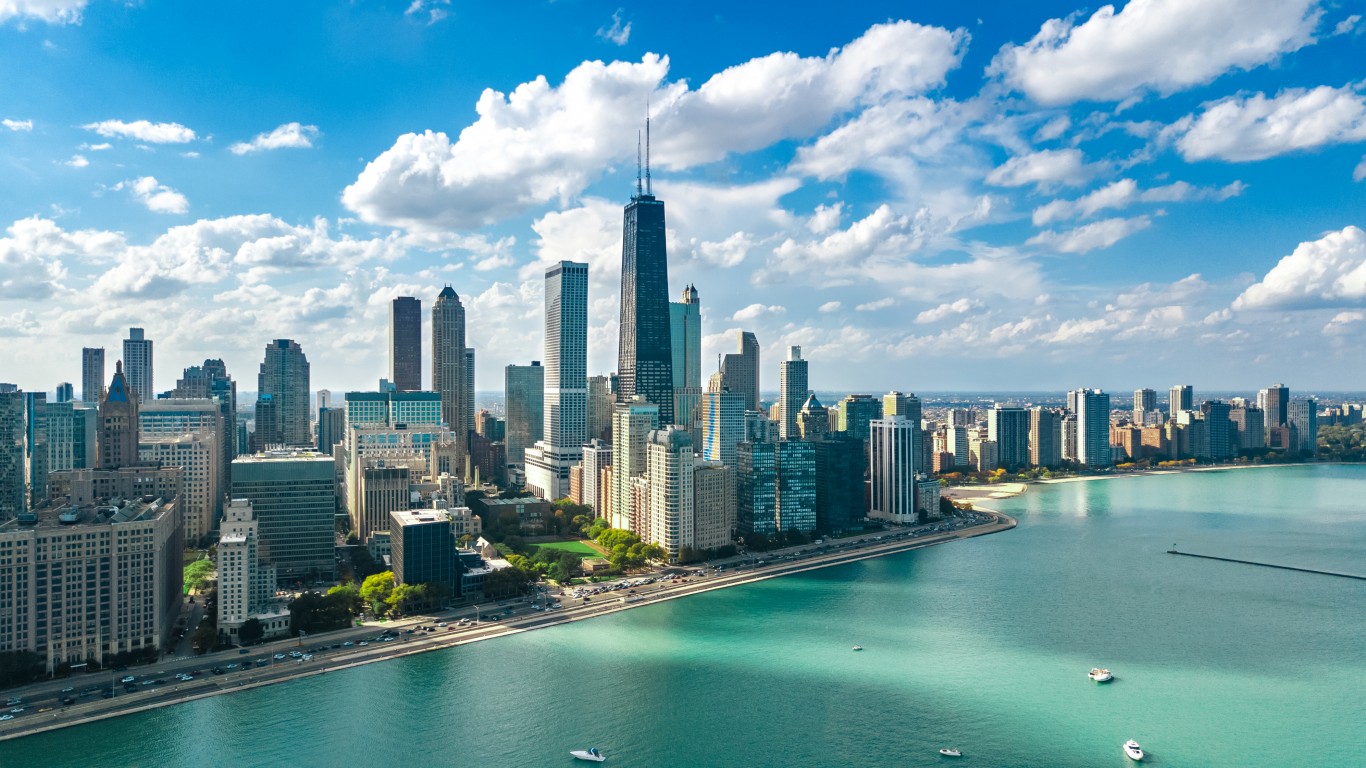
Illinois
> Most unusual ancestry: Assyrian
> Share of Illinois residents who report Assyrian ancestry: 0.10% (7.1 times greater than share of US population)
> Illinois residents with Assyrian ancestry: 10,606
> Share of US pop. with Assyrian ancestry: 0.01%
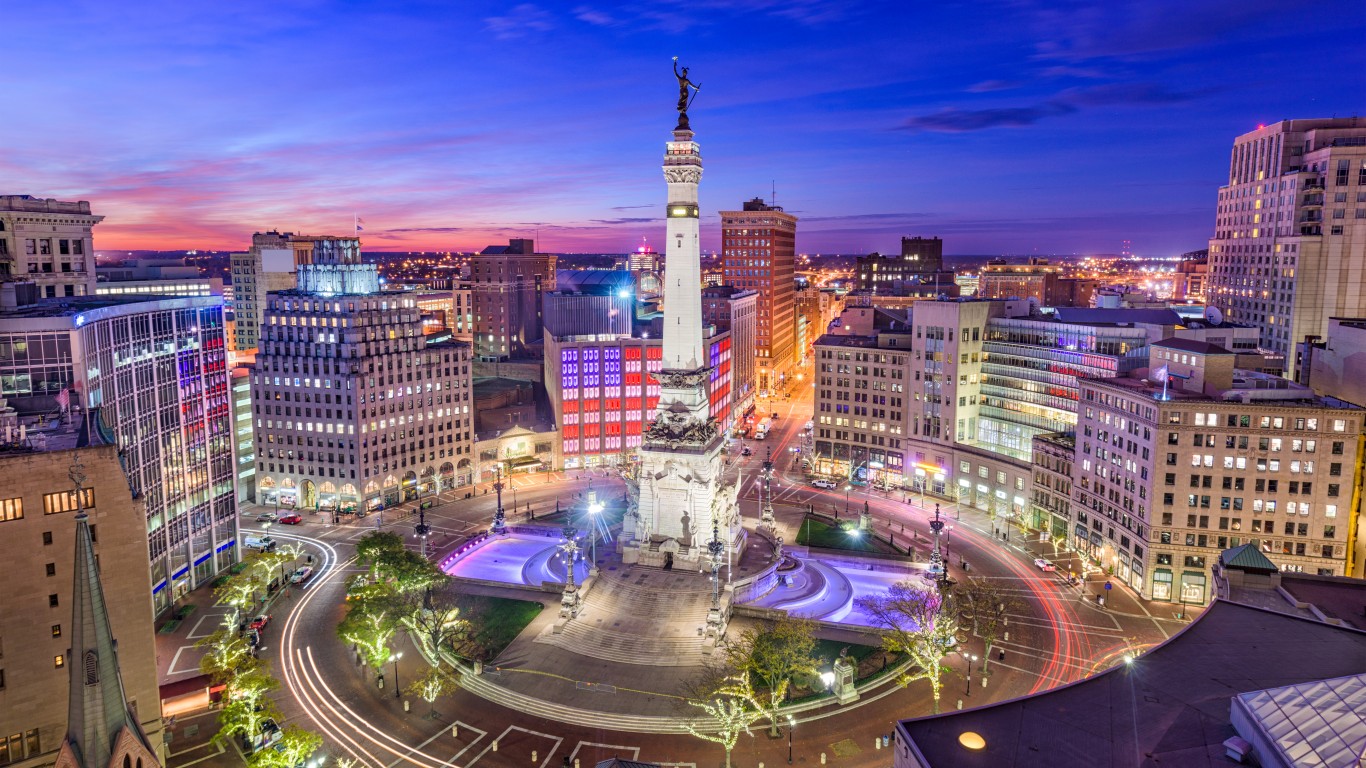
Indiana
> Most unusual ancestry: Burmese
> Share of Indiana residents who report Burmese ancestry: 0.42% (6.8 times greater than share of US population)
> Indiana residents with Burmese ancestry: 20,331
> Share of US pop. with Burmese ancestry: 0.06%
[in-text-ad-2]

Iowa
> Most unusual ancestry: Luxembourger
> Share of Iowa residents who report Luxembourger ancestry: 0.12% (15.3 times greater than share of US population)
> Iowa residents with Luxembourger ancestry: 2,847
> Share of US pop. with Luxembourger ancestry: 0.01%

Kansas
> Most unusual ancestry: German Russian
> Share of Kansas residents who report German Russian ancestry: 0.07% (7.9 times greater than share of US population)
> Kansas residents with German Russian ancestry: 1,484
> Share of US pop. with German Russian ancestry: 0.01%
[in-text-ad]

Kentucky
> Most unusual ancestry: Appalachian
> Share of Kentucky residents who report Appalachian ancestry: 0.05% (7.2 times greater than share of US population)
> Kentucky residents with Appalachian ancestry: 1,545
> Share of US pop. with Appalachian ancestry: 0.01%

Louisiana
> Most unusual ancestry: Cajun
> Share of Louisiana residents who report Cajun ancestry: 1.24% (39.4 times greater than share of US population)
> Louisiana residents with Cajun ancestry: 47,150
> Share of US pop. with Cajun ancestry: 0.03%

Maine
> Most unusual ancestry: Acadian
> Share of Maine residents who report Acadian ancestry: 0.05% (29.7 times greater than share of US population)
> Maine residents with Acadian ancestry: 541
> Share of US pop. with Acadian ancestry: <0.01%
[in-text-ad-2]

Maryland
> Most unusual ancestry: Sierra Leonean
> Share of Maryland residents who report Sierra Leonean ancestry: 0.13% (16.4 times greater than share of US population)
> Maryland residents with Sierra Leonean ancestry: 6,531
> Share of US pop. with Sierra Leonean ancestry: 0.01%
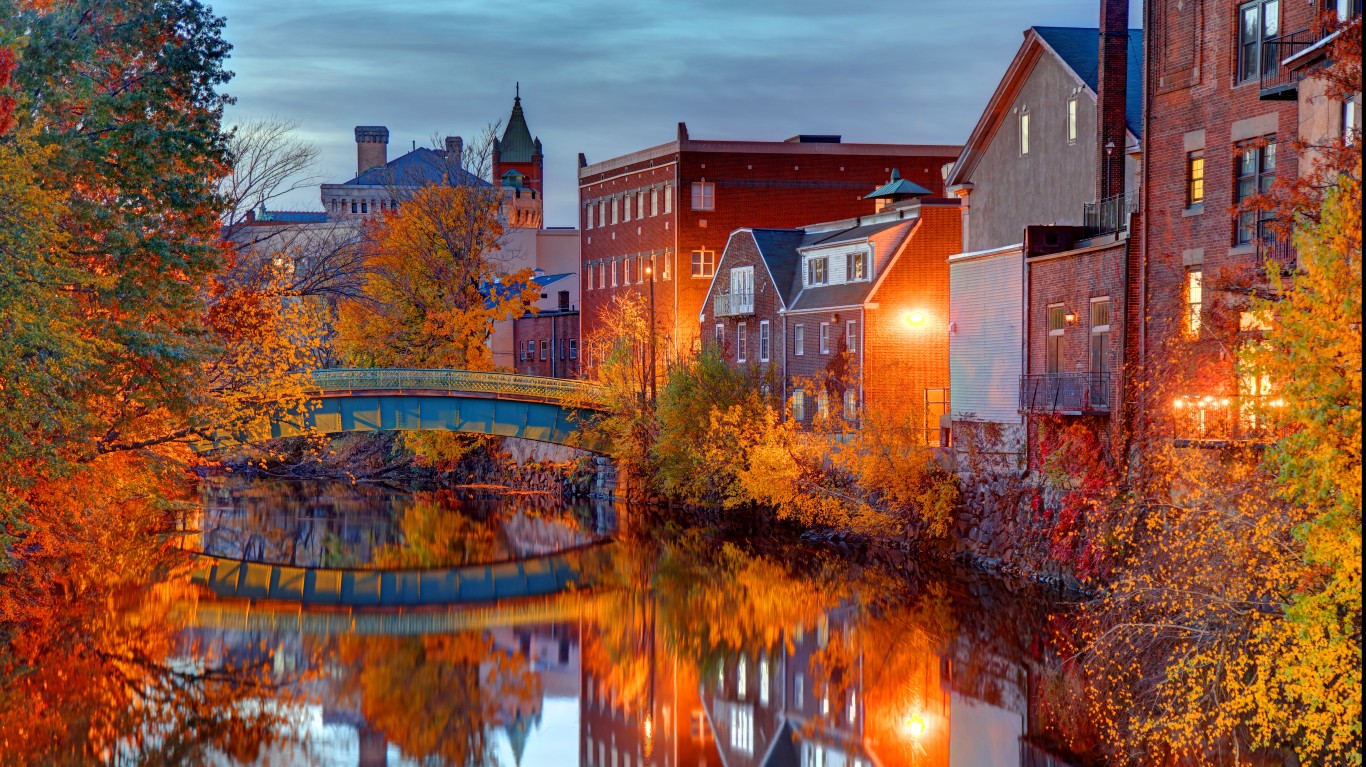
Massachusetts
> Most unusual ancestry: Cape Verdean
> Share of Massachusetts residents who report Cape Verdean ancestry: 1.14% (30.6 times greater than share of US population)
> Massachusetts residents with Cape Verdean ancestry: 65,669
> Share of US pop. with Cape Verdean ancestry: 0.04%
[in-text-ad]

Michigan
> Most unusual ancestry: Chaldean
> Share of Michigan residents who report Chaldean ancestry: 0.48% (24.4 times greater than share of US population)
> Michigan residents with Chaldean ancestry: 39,028
> Share of US pop. with Chaldean ancestry: 0.02%

Minnesota
> Most unusual ancestry: Somali
> Share of Minnesota residents who report Somali ancestry: 1.34% (22.4 times greater than share of US population)
> Minnesota residents with Somali ancestry: 62,470
> Share of US pop. with Somali ancestry: 0.06%
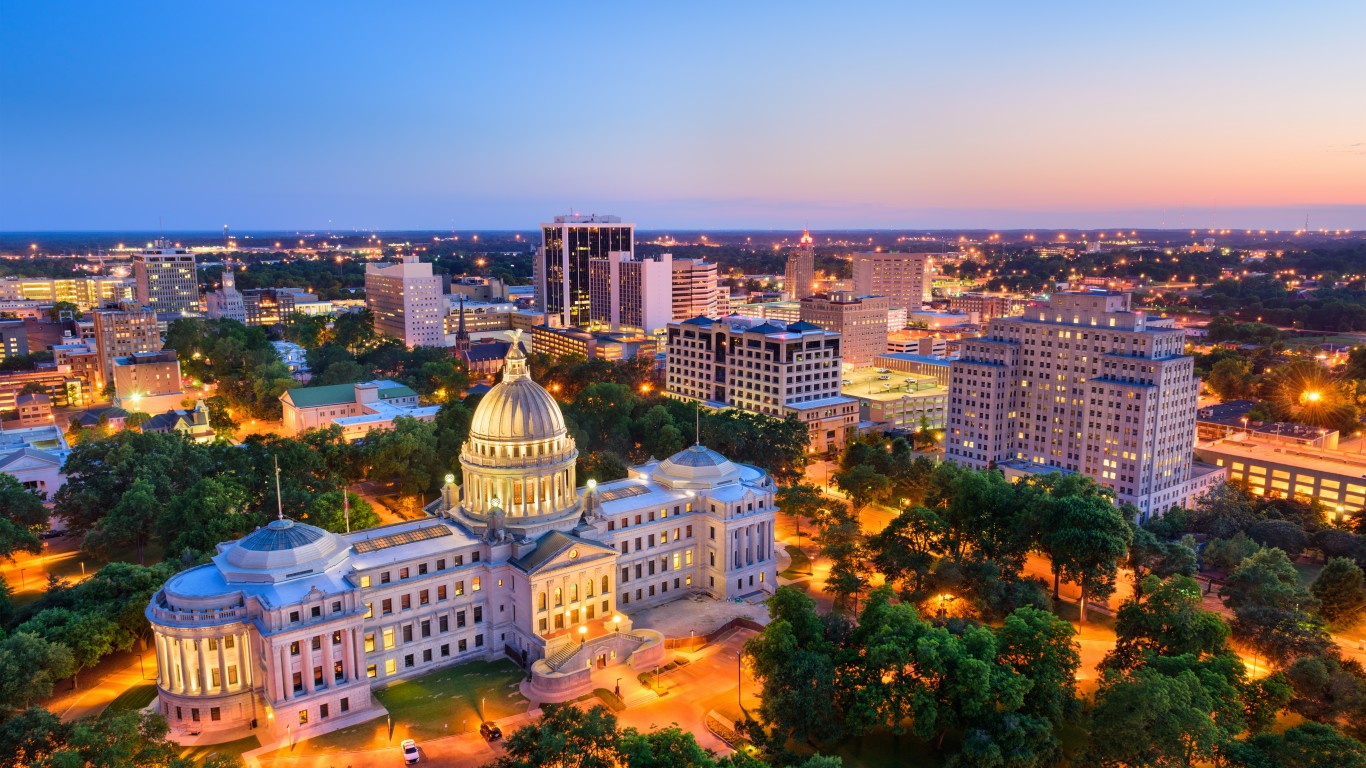
Mississippi
> Most unusual ancestry: African-American
> Share of Mississippi residents who report African-American ancestry: 37.99% (4.0 times greater than share of US population)
> Mississippi residents with African American ancestry: 894,738
> Share of US pop. with African American ancestry: 9.42%
[in-text-ad-2]

Missouri
> Most unusual ancestry: Bosnian and Herzegovinian
> Share of Missouri residents who report Bosnian and Herzegovinian ancestry: 0.27% (6.1 times greater than share of US population)
> Missouri residents with Bosnian and Herzegovinian ancestry: 12,510
> Share of US pop. with Bosnian and Herzegovinian ancestry: 0.04%
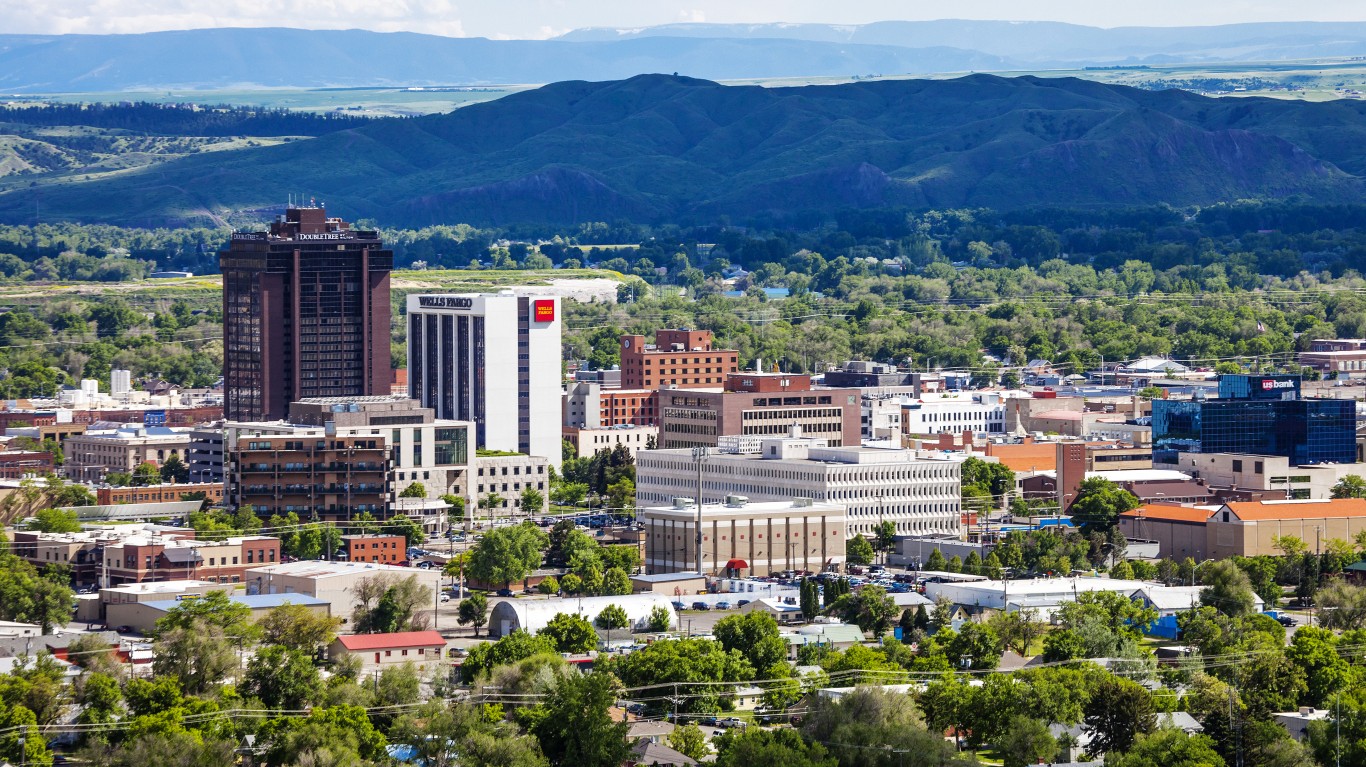
Montana
> Most unusual ancestry: Kuwaiti
> Share of Montana residents who report Kuwaiti ancestry: 0.01% (8.1 times greater than share of US population)
> Montana residents with Kuwaiti ancestry: 110
> Share of US pop. with Kuwaiti ancestry: <0.01%
[in-text-ad]
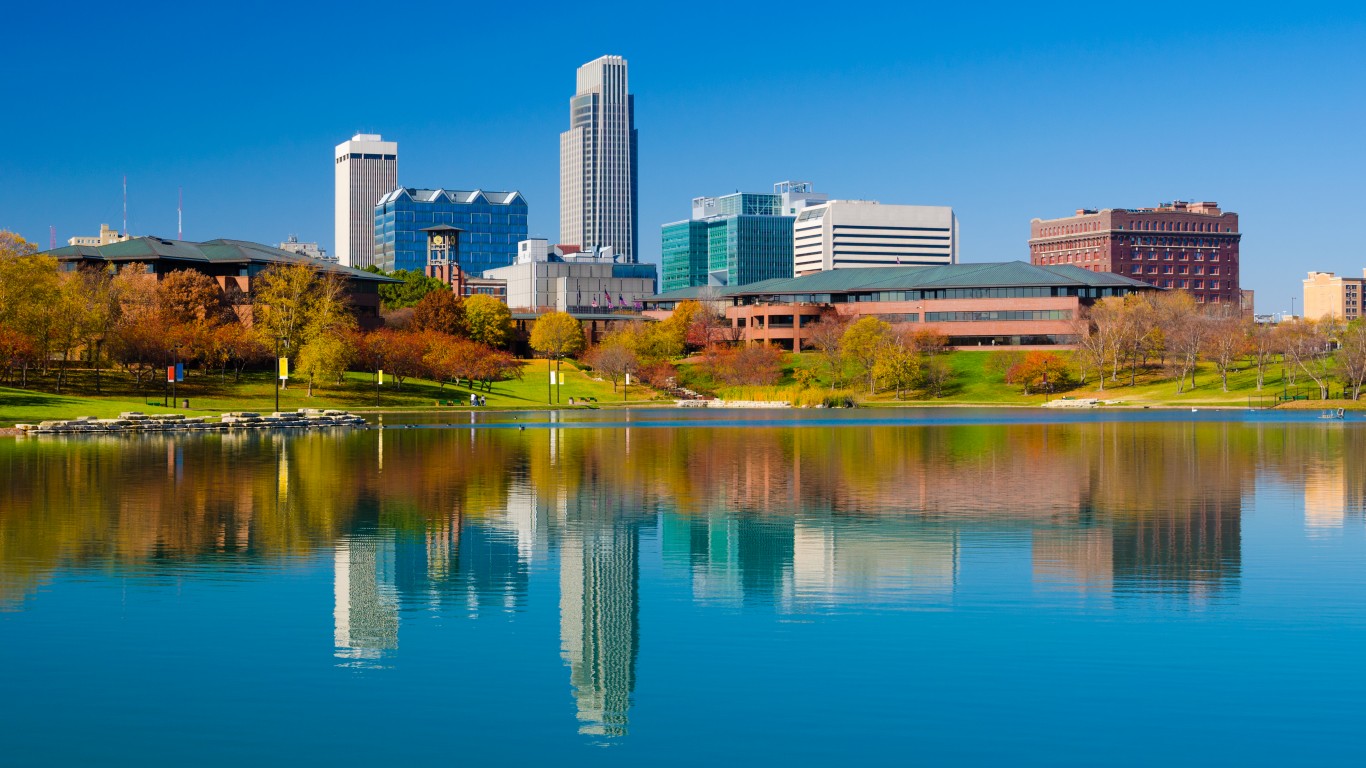
Nebraska
> Most unusual ancestry: Sudanese
> Share of Nebraska residents who report Sudanese ancestry: 0.32% (13.7 times greater than share of US population)
> Nebraska residents with Sudanese ancestry: 4,823
> Share of US pop. with Sudanese ancestry: 0.02%
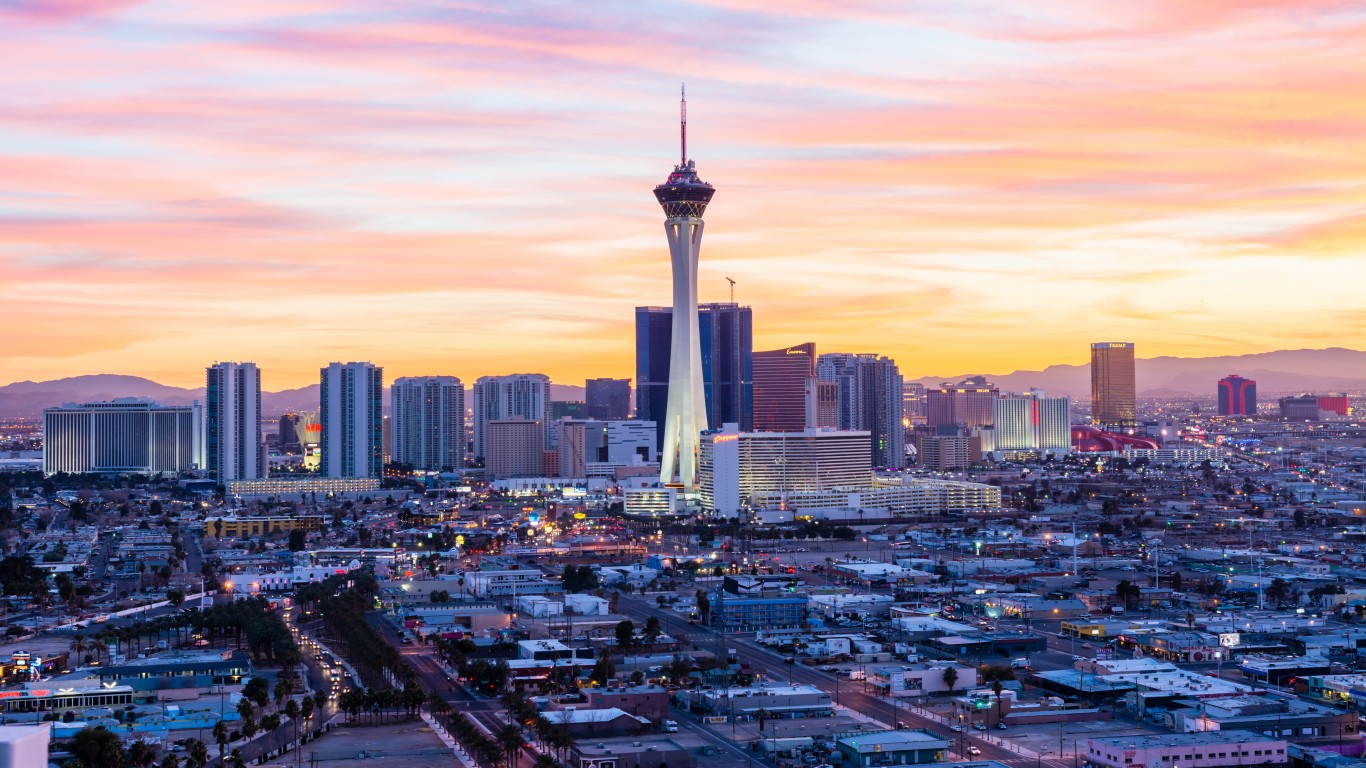
Nevada
> Most unusual ancestry: Basque
> Share of Nevada residents who report Basque ancestry: 0.16% (9.9 times greater than share of US population)
> Nevada residents with Basque ancestry: 4,046
> Share of US pop. with Basque ancestry: 0.02%

New Hampshire
> Most unusual ancestry: French-Canadian
> Share of New Hampshire residents who report French-Canadian ancestry: 8.96% (16.1 times greater than share of US population)
> New Hampshire residents with French Canadian ancestry: 101,134
> Share of US pop. with French Canadian ancestry: 0.56%
[in-text-ad-2]
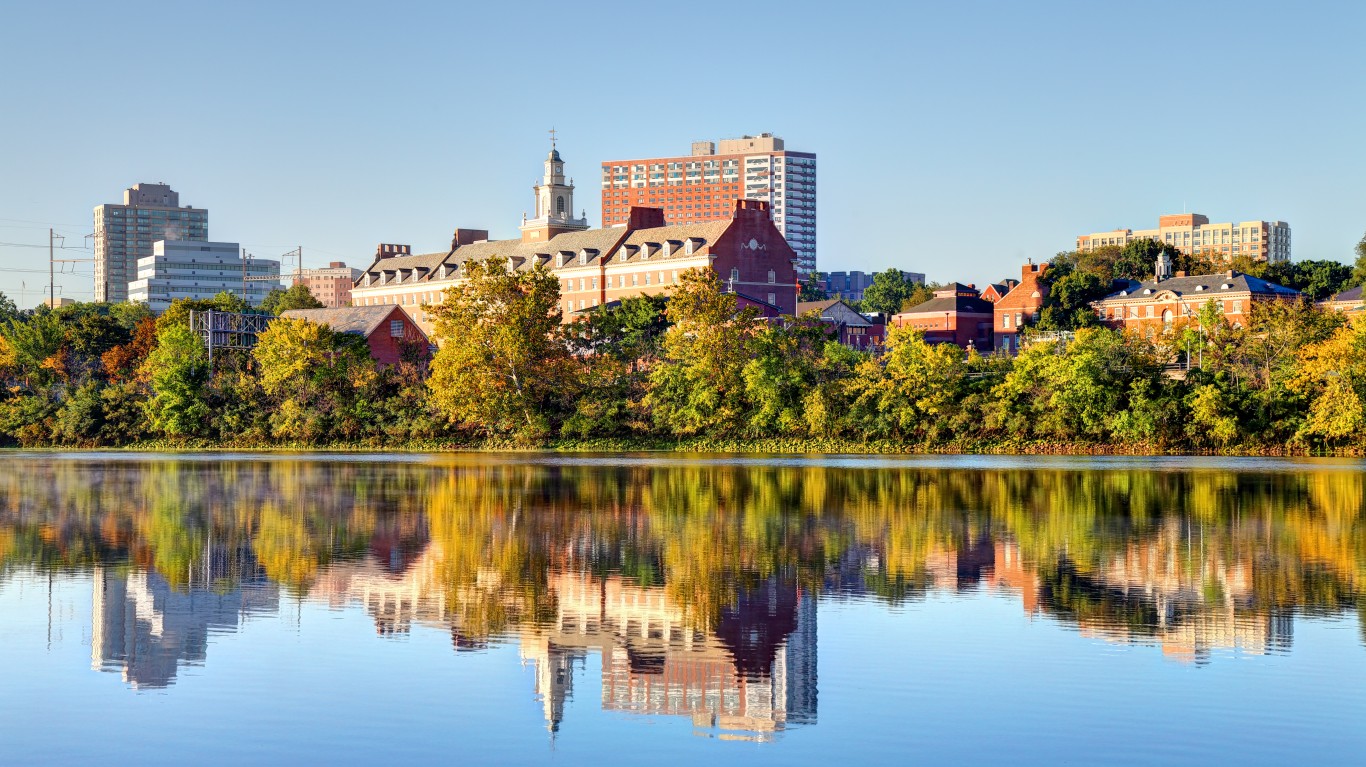
New Jersey
> Most unusual ancestry: Uruguayan
> Share of New Jersey residents who report Uruguayan ancestry: 0.09% (7.3 times greater than share of US population)
> New Jersey residents with Uruguayan ancestry: 7,085
> Share of US pop. with Uruguayan ancestry: 0.01%
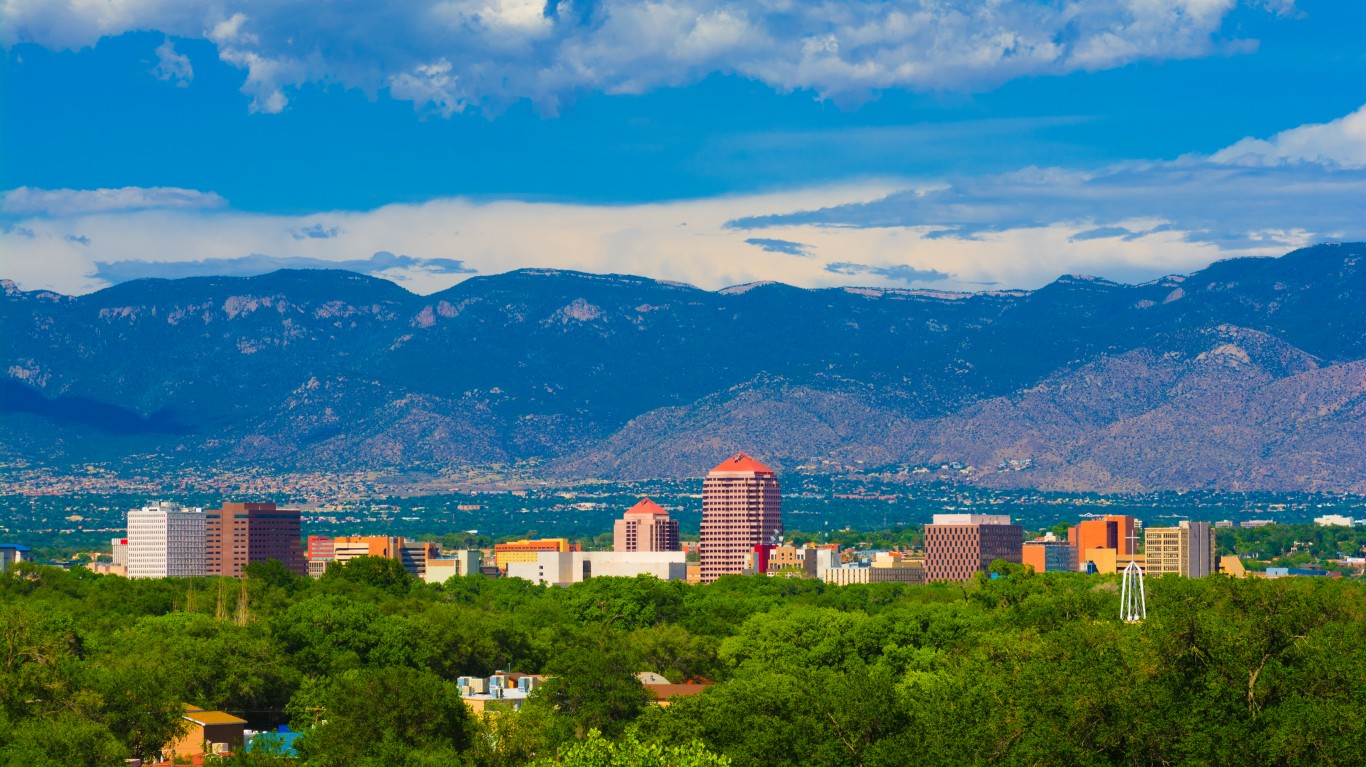
New Mexico
> Most unusual ancestry: New Mexican
> Share of New Mexico residents who report New Mexican ancestry: 0.11% (73.4 times greater than share of US population)
> New Mexico residents with New Mexico ancestry: 1,902
> Share of US pop. with New Mexico ancestry: <0.01%
[in-text-ad]
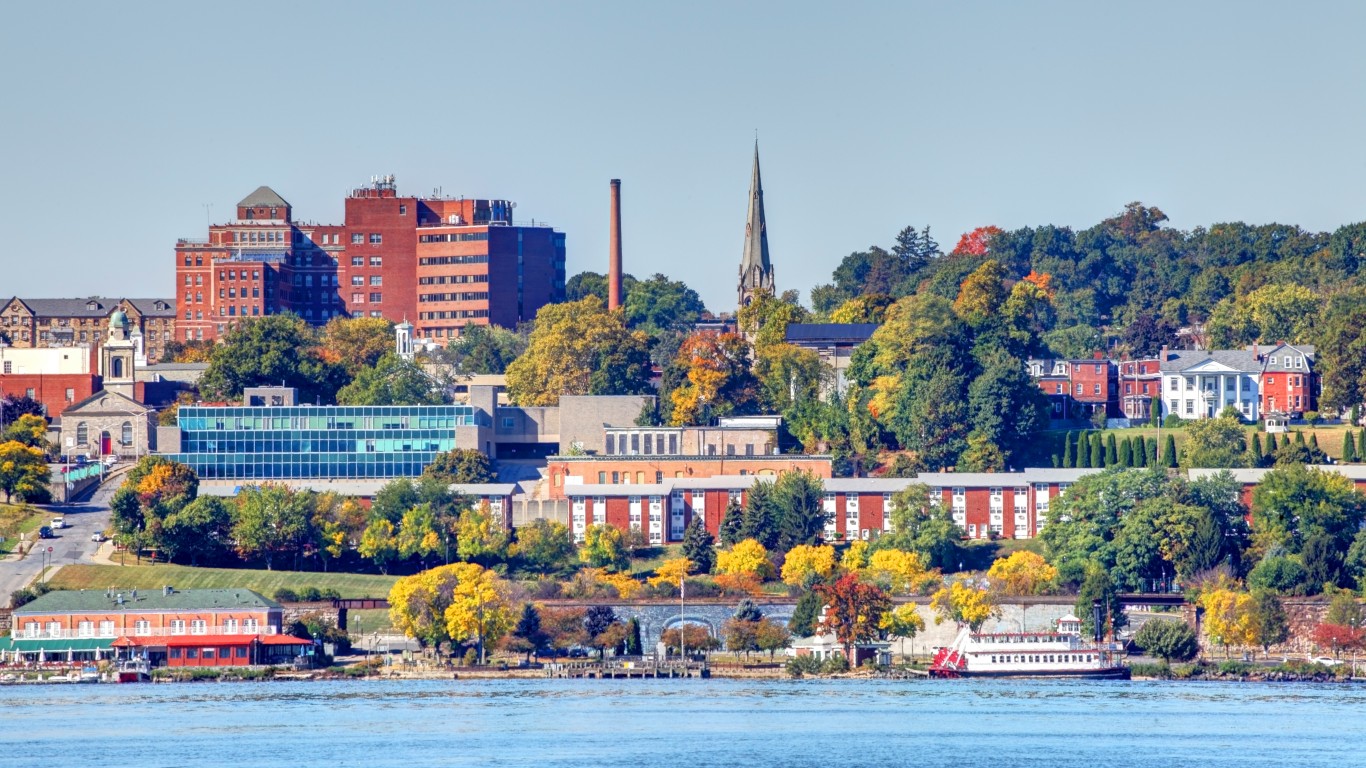
New York
> Most unusual ancestry: Vincent-Grenadine Islander [Vincentian]
> Share of New York residents who report Vincent-Grenadine Islander [Vincentian] ancestry: 0.05% (11.1 times greater than share of US population)
> New York residents with Vincent-Grenadine Islander [Vincentian] ancestry: 8,373
> Share of US pop. with Vincent-Grenadine Islander [Vincentian] ancestry: <0.01%

North Carolina
> Most unusual ancestry: Scotch Irish
> Share of North Carolina residents who report Scotch Irish ancestry: 2.50% (3.0 times greater than share of US population)
> North Carolina residents with Scotch Irish ancestry: 201,915
> Share of US pop. with Scotch Irish ancestry: 0.84%
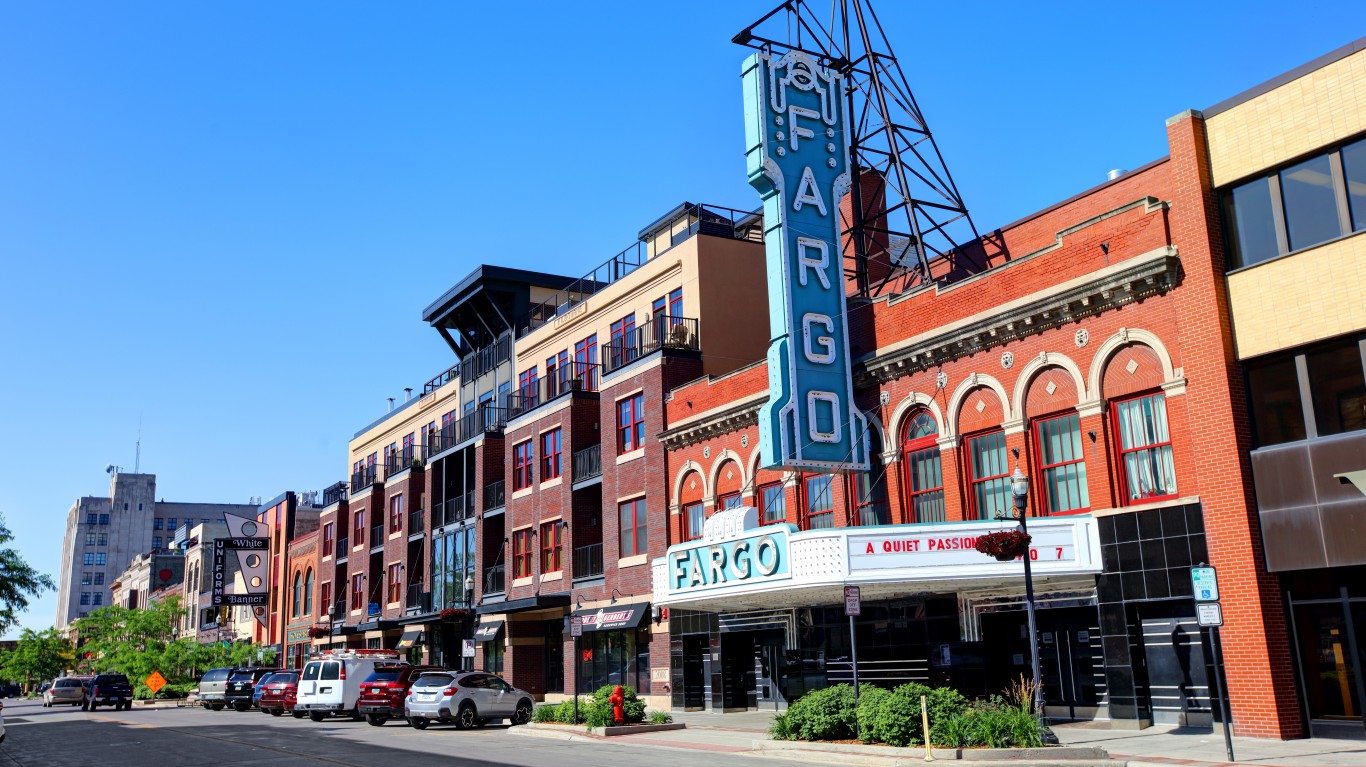
North Dakota
> Most unusual ancestry: German Russian
> Share of North Dakota residents who report German Russian ancestry: 0.33% (40.0 times greater than share of US population)
> North Dakota residents with German Russian ancestry: 2,067
> Share of US pop. with German Russian ancestry: 0.01%
[in-text-ad-2]
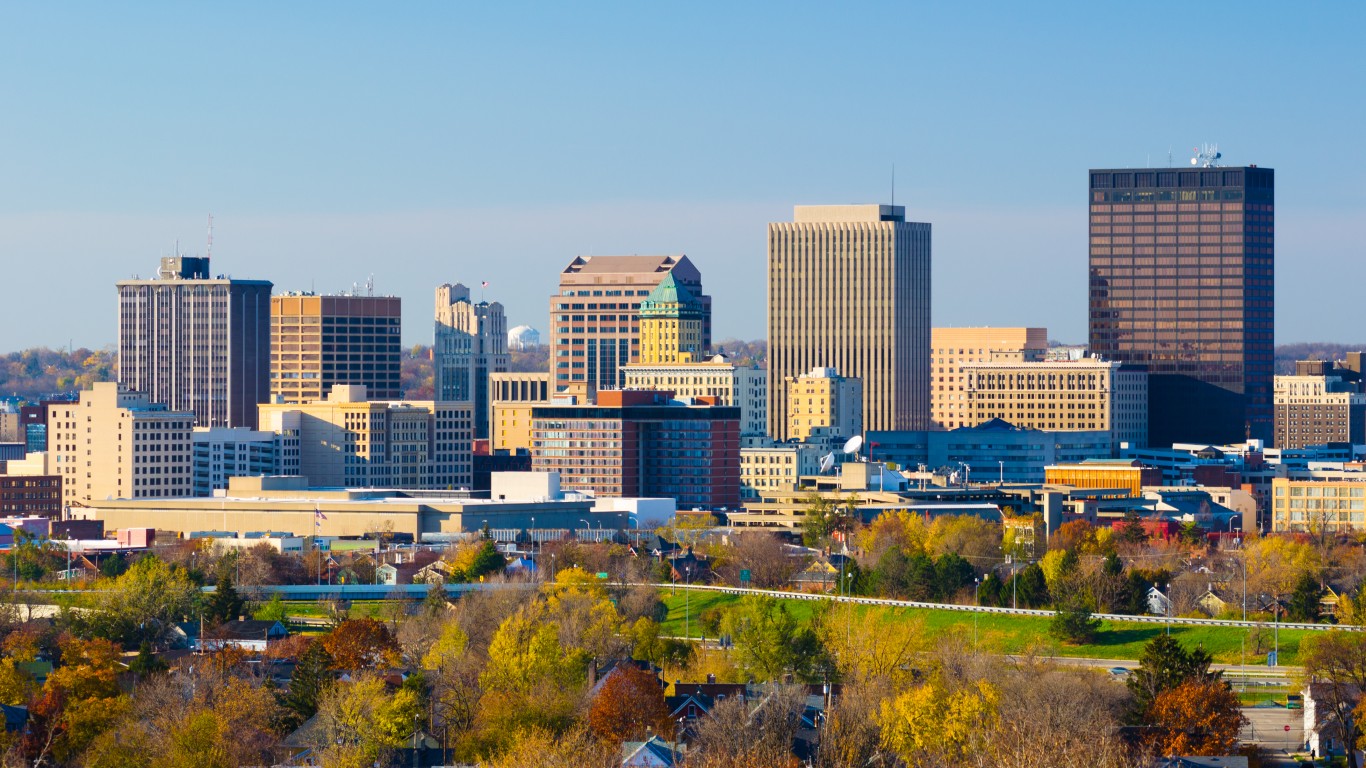
Ohio
> Most unusual ancestry: Slovene
> Share of Ohio residents who report Slovene ancestry: 0.34% (8.5 times greater than share of US population)
> Ohio residents with Slovene ancestry: 31,217
> Share of US pop. with Slovene ancestry: 0.04%

Oklahoma
> Most unusual ancestry: Dutch West Indian
> Share of Oklahoma residents who report Dutch West Indian ancestry: 0.20% (30.1 times greater than share of US population)
> Oklahoma residents with Dutch West Indian ancestry: 6,048
> Share of US pop. with Dutch West Indian ancestry: 0.01%
[in-text-ad]

Oregon
> Most unusual ancestry: Palauan
> Share of Oregon residents who report Palauan ancestry: 0.02% (7.4 times greater than share of US population)
> Oregon residents with Palauan ancestry: 499
> Share of US pop. with Palauan ancestry: <0.01%
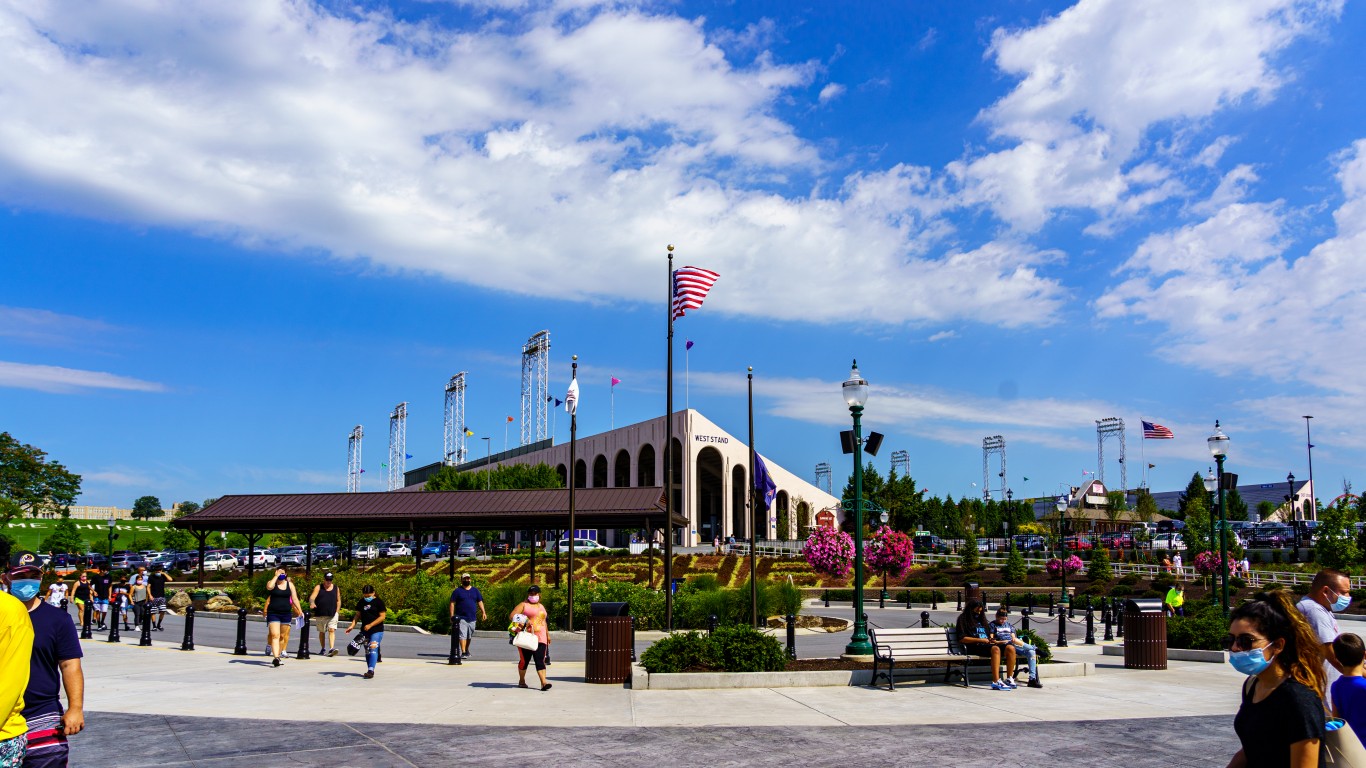
Pennsylvania
> Most unusual ancestry: Pennsylvania German
> Share of Pennsylvania residents who report Pennsylvania German ancestry: 1.20% (12.8 times greater than share of US population)
> Pennsylvania residents with Pennsylvania German ancestry: 123,023
> Share of US pop. with Pennsylvania German ancestry: 0.09%
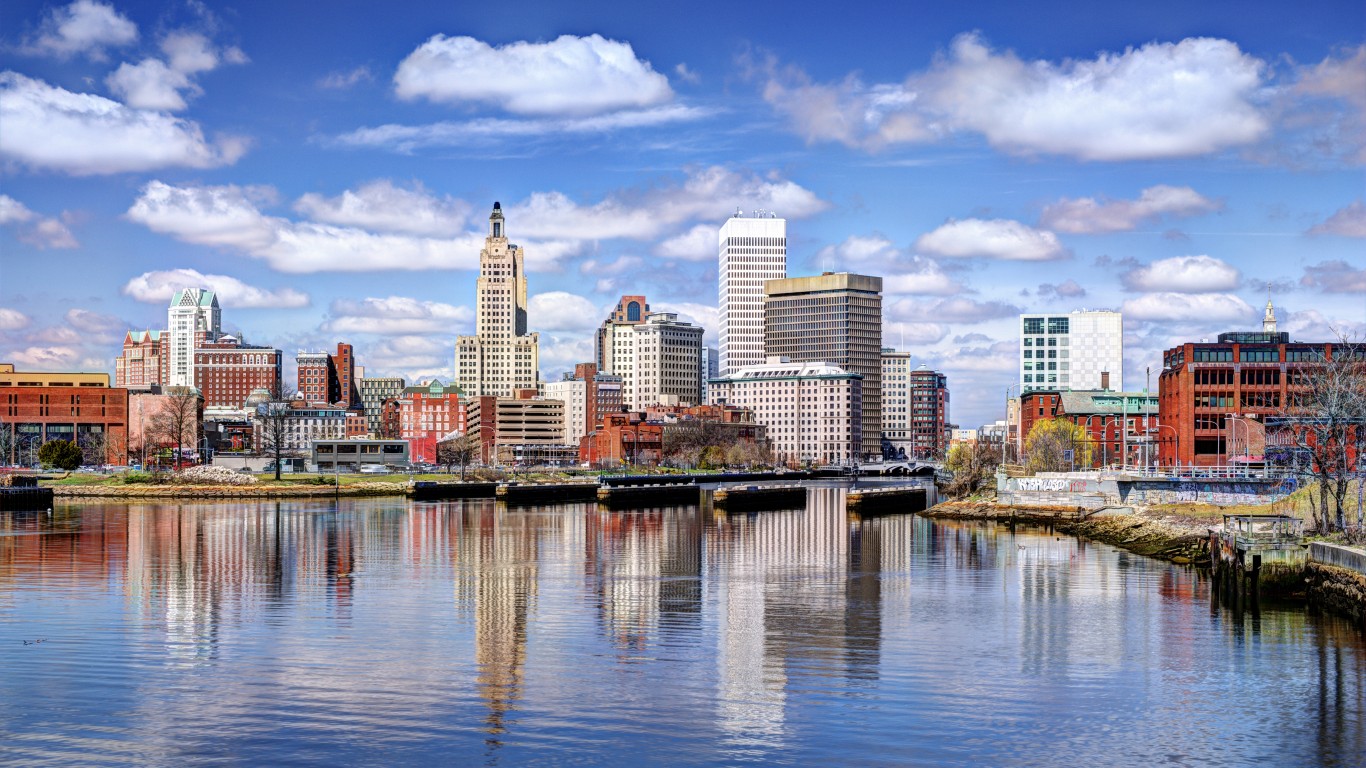
Rhode Island
> Most unusual ancestry: Cape Verdean
> Share of Rhode Island residents who report Cape Verdean ancestry: 1.93% (51.7 times greater than share of US population)
> Rhode Island residents with Cape Verdean ancestry: 17,547
> Share of US pop. with Cape Verdean ancestry: 0.04%
[in-text-ad-2]
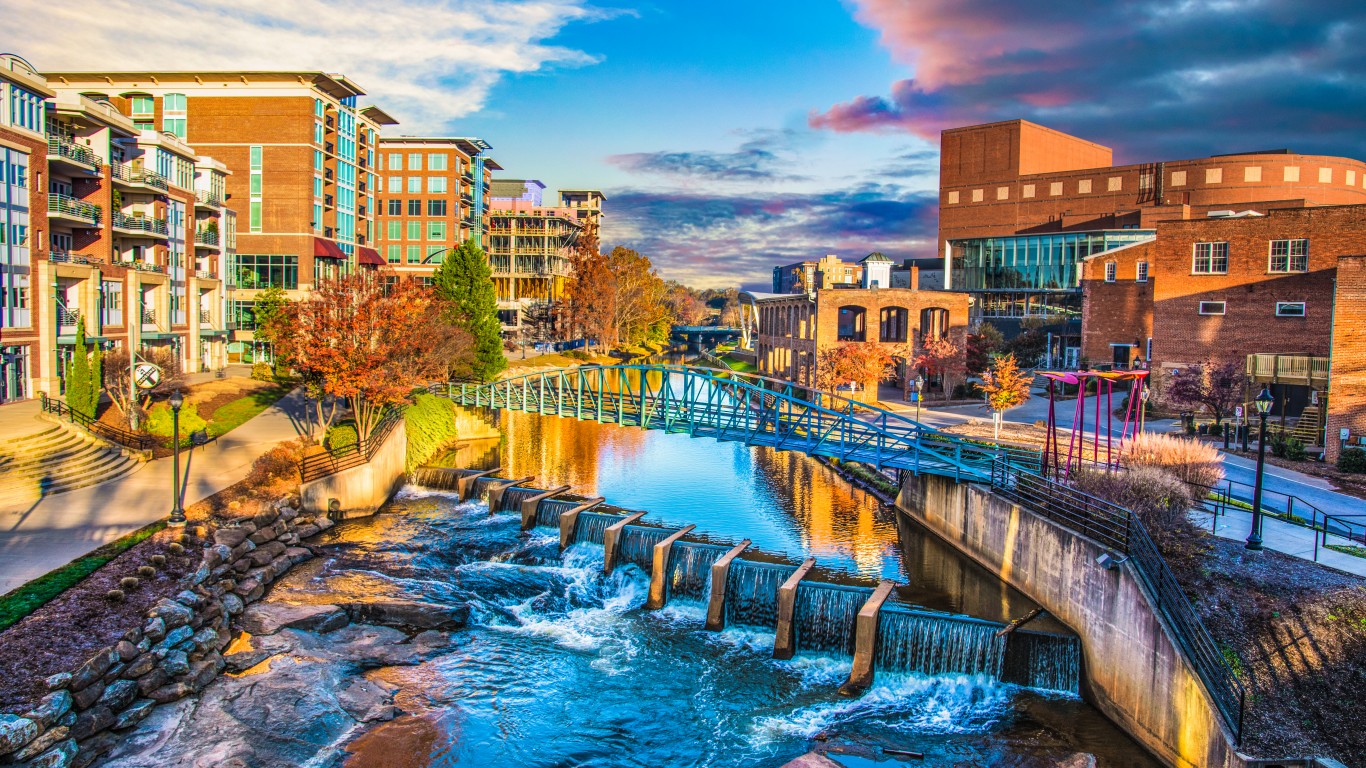
South Carolina
> Most unusual ancestry: Micronesian
> Share of South Carolina residents who report Micronesian ancestry: 0.04% (3.6 times greater than share of US population)
> South Carolina residents with Micronesian ancestry: 1,722
> Share of US pop. with Micronesian ancestry: 0.01%
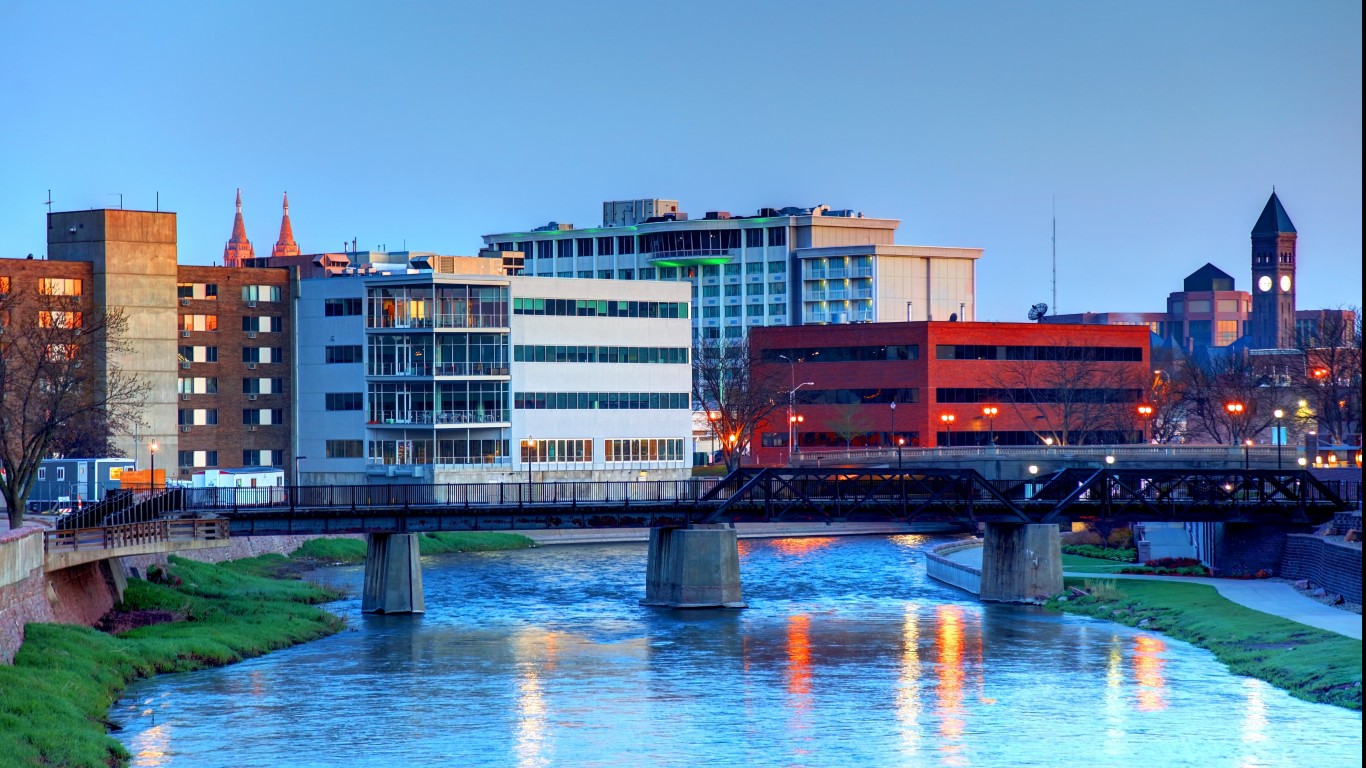
South Dakota
> Most unusual ancestry: Bohemian
> Share of South Dakota residents who report Bohemian ancestry: 0.57% (11.0 times greater than share of US population)
> South Dakota residents with Bohemian ancestry: 4,156
> Share of US pop. with Bohemian ancestry: 0.05%
[in-text-ad]
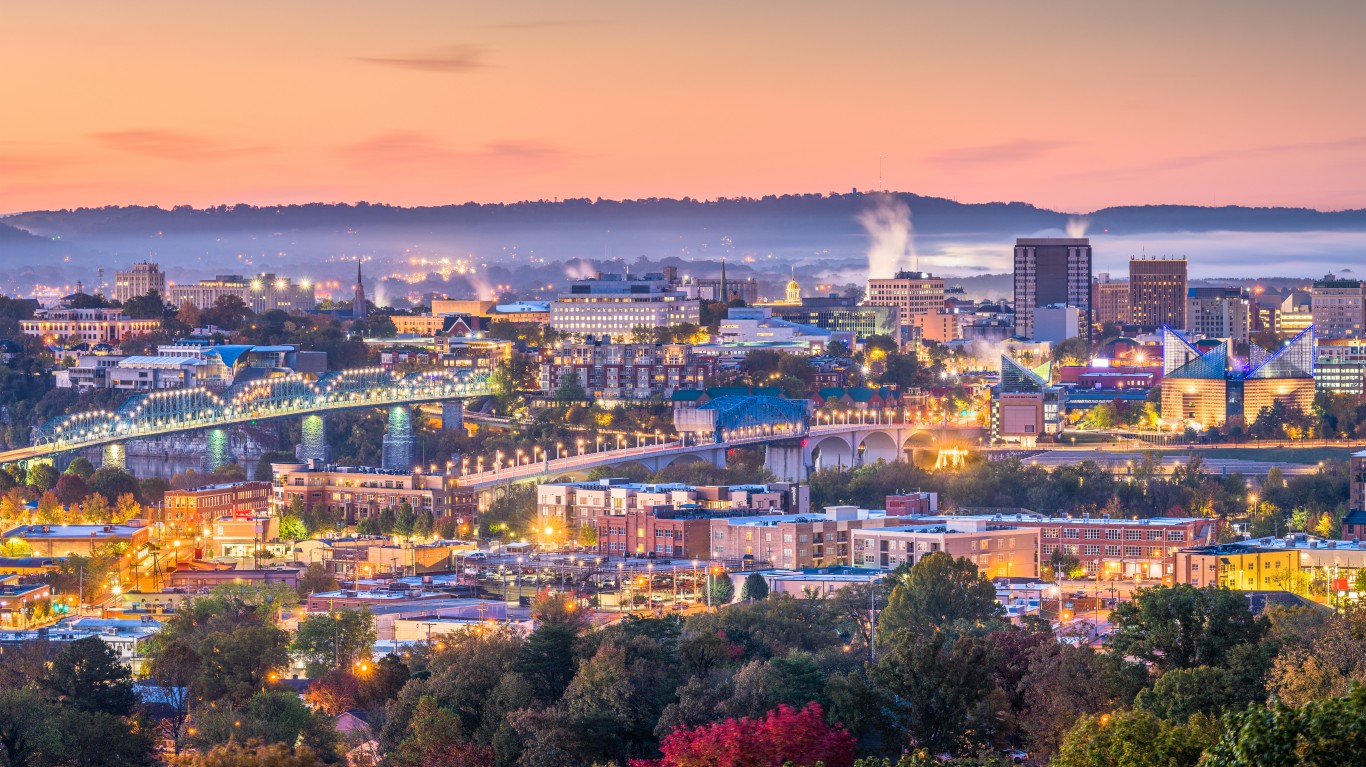
Tennessee
> Most unusual ancestry: Kurdish
> Share of Tennessee residents who report Kurdish ancestry: 0.13% (14.8 times greater than share of US population)
> Tennessee residents with Kurdish ancestry: 6,302
> Share of US pop. with Kurdish ancestry: 0.01%

Texas
> Most unusual ancestry: Texan
> Share of Texas residents who report Texan ancestry: 0.21% (9.4 times greater than share of US population)
> Texas residents with Texan ancestry: 50,538
> Share of US pop. with Texan ancestry: 0.02%
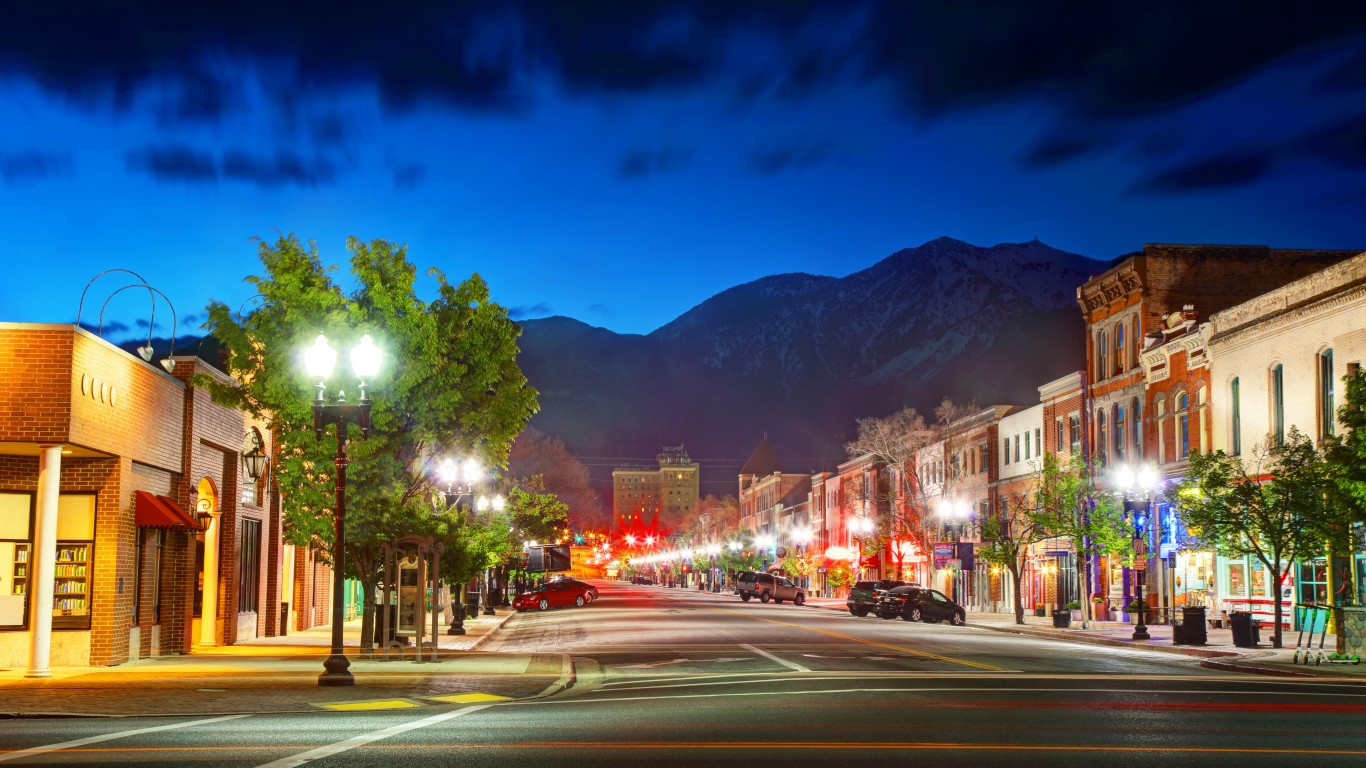
Utah
> Most unusual ancestry: Tongan
> Share of Utah residents who report Tongan ancestry: 0.46% (28.7 times greater than share of US population)
> Utah residents with Tongan ancestry: 11,689
> Share of US pop. with Tongan ancestry: 0.02%
[in-text-ad-2]
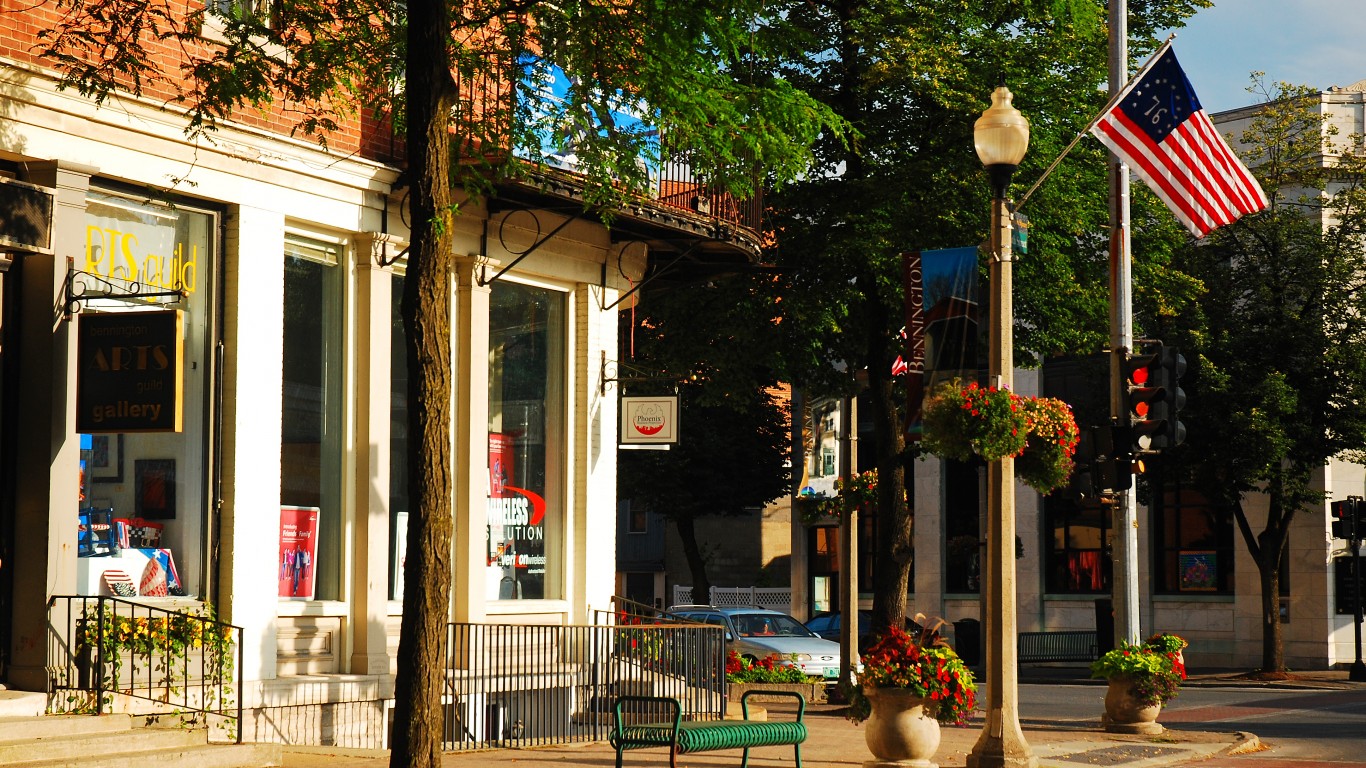
Vermont
> Most unusual ancestry: Bhutanese
> Share of Vermont residents who report Bhutanese ancestry: 0.18% (14.8 times greater than share of US population)
> Vermont residents with Bhutanese ancestry: 926
> Share of US pop. with Bhutanese ancestry: 0.01%

Virginia
> Most unusual ancestry: Bolivian
> Share of Virginia residents who report Bolivian ancestry: 0.41% (12.4 times greater than share of US population)
> Virginia residents with Bolivian ancestry: 28,022
> Share of US pop. with Bolivian ancestry: 0.03%
[in-text-ad]

Washington
> Most unusual ancestry: Gambian
> Share of Washington residents who report Gambian ancestry: 0.03% (11.1 times greater than share of US population)
> Washington residents with Gambian ancestry: 2,054
> Share of US pop. with Gambian ancestry: <0.01%

West Virginia
> Most unusual ancestry: Kuwaiti
> Share of West Virginia residents who report Kuwaiti ancestry: 0.02% (12.8 times greater than share of US population)
> West Virginia residents with Kuwaiti ancestry: 244
> Share of US pop. with Kuwaiti ancestry: <0.01%
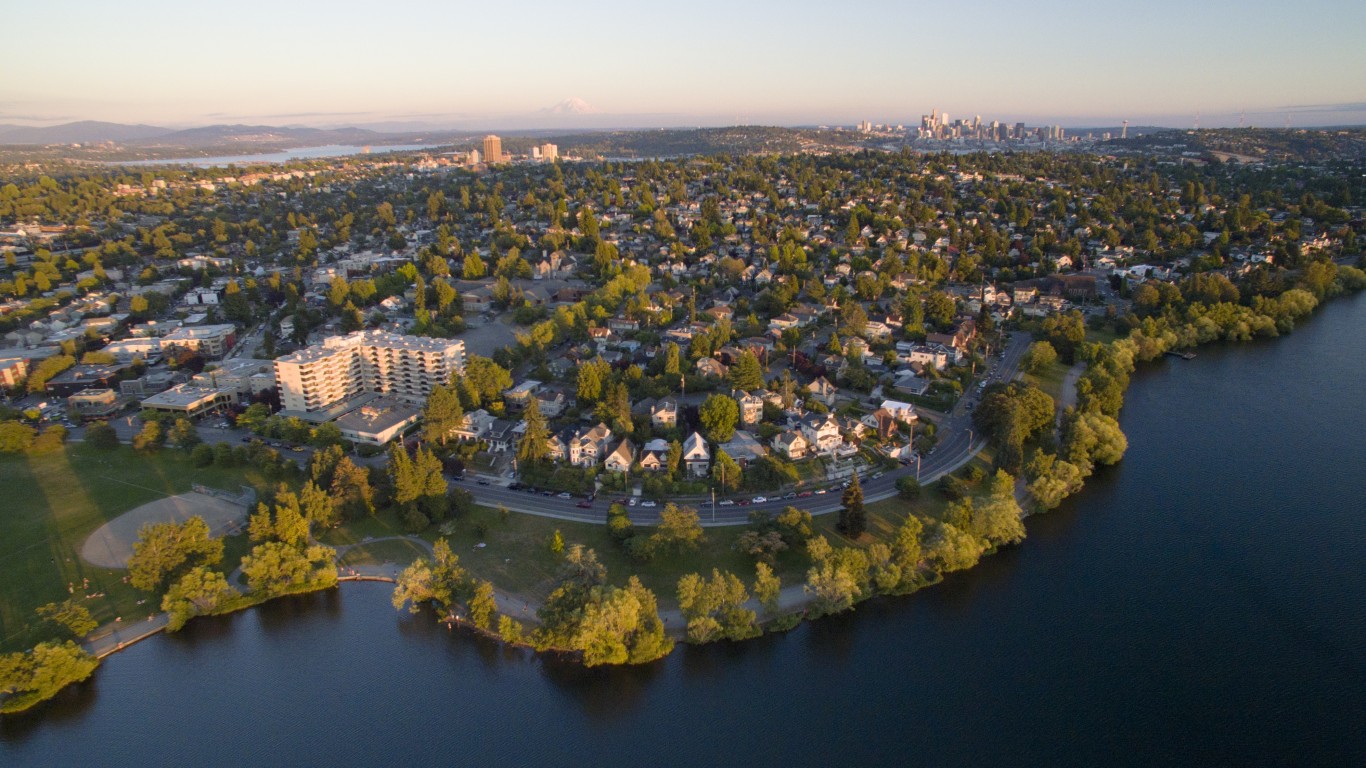
Wisconsin
> Most unusual ancestry: Hmong
> Share of Wisconsin residents who report Hmong ancestry: 0.94% (10.5 times greater than share of US population)
> Wisconsin residents with Hmong ancestry: 45,934
> Share of US pop. with Hmong ancestry: 0.09%
[in-text-ad-2]
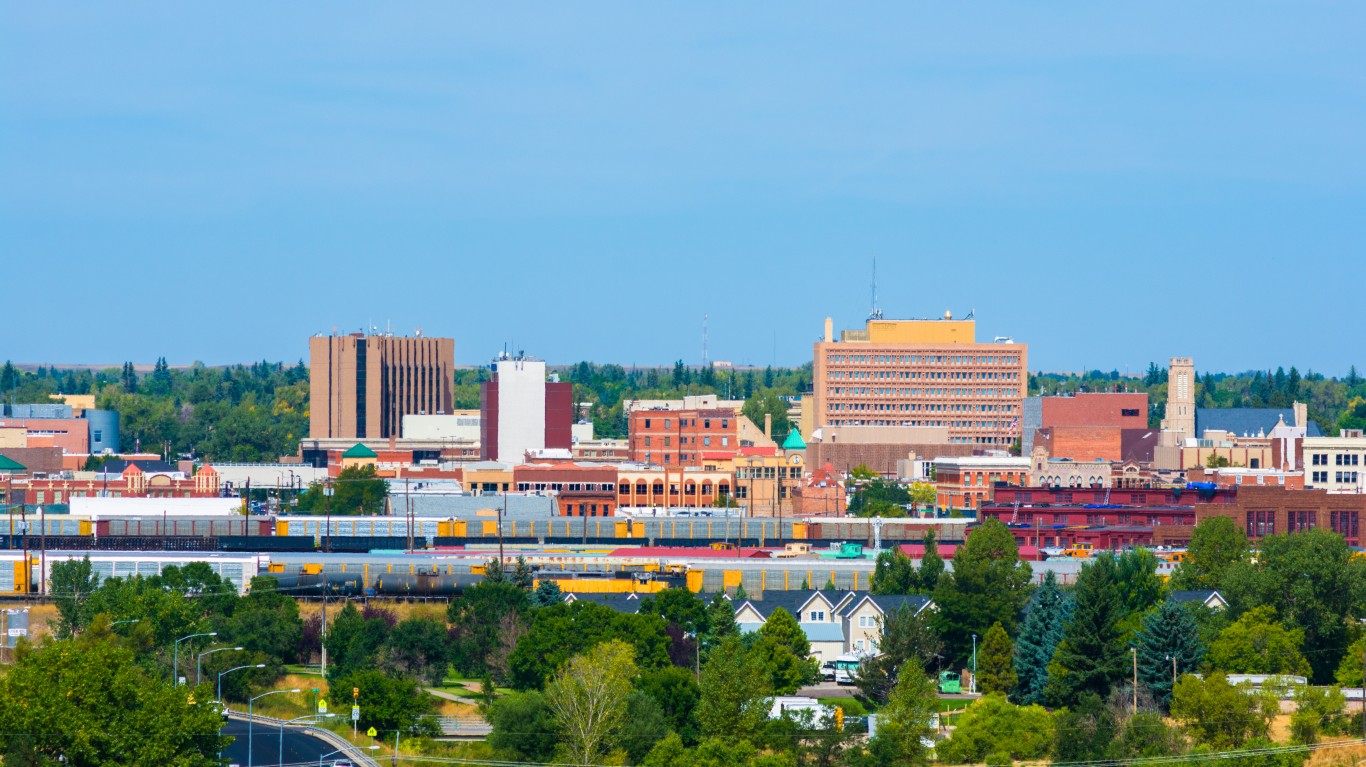
Wyoming
> Most unusual ancestry: Slavonian
> Share of Wyoming residents who report Slavonian ancestry: 0.02% (11.6 times greater than share of US population)
> Wyoming residents with Slavonian ancestry: 68
> Share of US pop. with Slavonian ancestry: <0.01%
Methodology
To find the most distinctive ancestry in each state, 24/7 Tempo reviewed the ancestry question in the American Community Survey (ACS) five-year averages for the years 2015 to 2019. The question is based on self-identification and answers represent ancestry groups with which people most closely identify. The 100 single-origin ancestries (excluding combinations of two or more races) represented in the data are based on a combination of the most common responses to the survey as well as classifications by the Census Bureau.
The most distinctive ancestry in each state was determined by calculating the location quotient for each ancestry and taking the largest ratio relative to the U.S average. For example, if 20% of a state population is Scotch-Irish, and the Scotch-Irish comprise 10% of the U.S. population, then the location quotient would be 2.0. If that location quotient is the highest of any ancestry in the state, then that is the most distinctive ancestry in the state.
Want to Retire Early? Start Here (Sponsor)
Want retirement to come a few years earlier than you’d planned? Or are you ready to retire now, but want an extra set of eyes on your finances?
Now you can speak with up to 3 financial experts in your area for FREE. By simply clicking here you can begin to match with financial professionals who can help you build your plan to retire early. And the best part? The first conversation with them is free.
Click here to match with up to 3 financial pros who would be excited to help you make financial decisions.
Thank you for reading! Have some feedback for us?
Contact the 24/7 Wall St. editorial team.
 24/7 Wall St.
 24/7 Wall St.
 24/7 Wall St.