As children, often nothing seems scarier than thunder and lightning. Where you live, though, makes a difference as to how many lightning storms you’re likely to endure. Some parts of the United States are more prone to them than others, due to climate, elevation, and natural (and unnatural) conductors.
While it might be the thunder that most terrifies people (and their pets, too), lightning is the real danger in a thunderstorm. (Speaking of storms, here are the most devastating natural disasters in America in 2021).
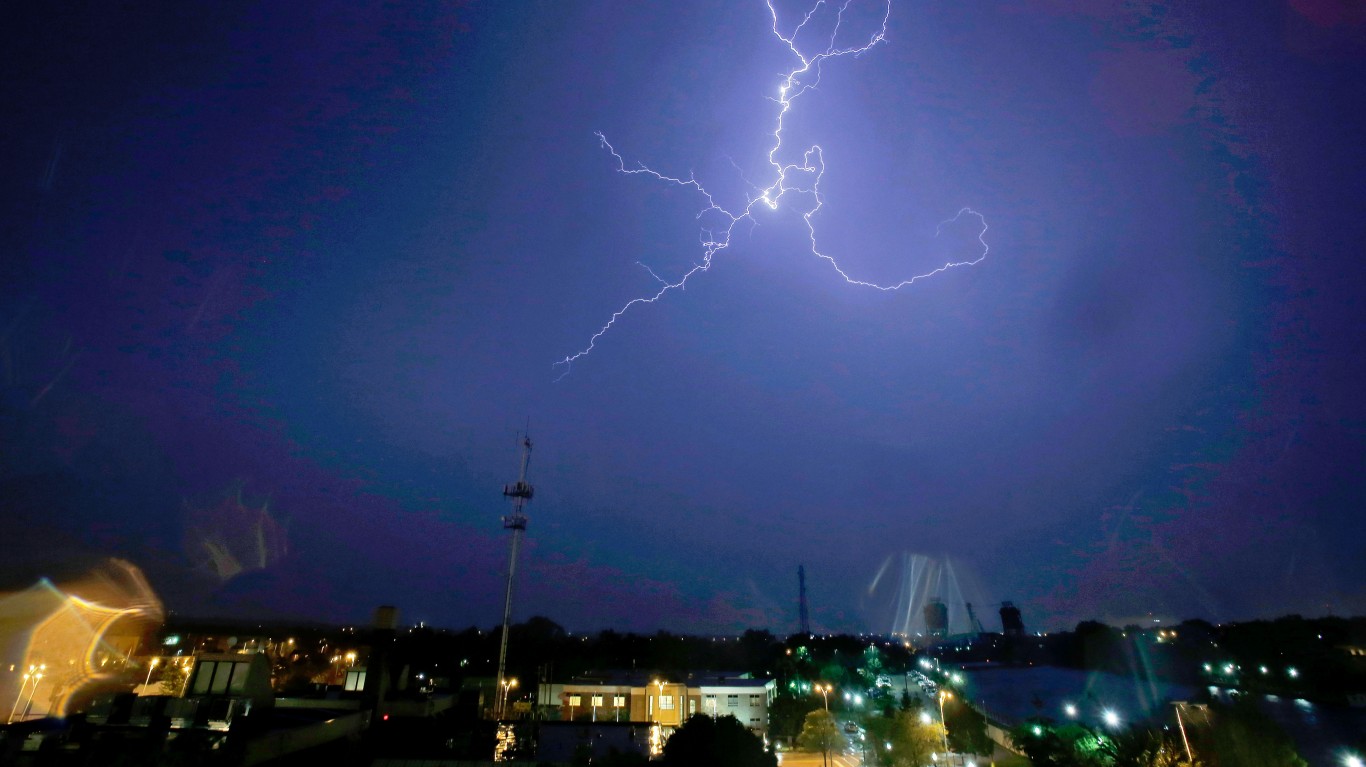
As an electrostatic discharge, a single lightning stroke (the correct meteorological term, though most of us think of them as “strikes”) releases an immense amount of energy, and can be extremely dangerous if it makes contact with a conductor – for instance, a human being. From 1959 to 1994, according to the National Weather Service, there were over 10,000 lightning-related deaths, injuries, and reported damages in this country, and an average of 49 people are killed by lightning every year. (Lightning also sparks forest and brush fires. These have been the 30 most destructive wildfires in the US this century.)
Click here to see the states where lightning strikes the most
Suffice to say, lightning can strike a lot more than once, and a lot more in some places than others. To determine which states are struck with the most lightning, 24/7 Wall St. reviewed the 2021 Annual Lightning Report from the environmental data company Vaisala. States were ranked on the total number of cloud-to-ground strokes plus cloud pulses (lightning flashes that don’t connect with the earth’s surface) in 2021, as well as the number of events per square kilometer. We converted those numbers to events per square mile using data on the total area of each state – both land and water – from the U.S. Census Bureau, which was also the source of population figures.

50. Rhode Island
> Total lightning events in 2021: 8,590
> Lightning density: 5.56 events per square mile (8th lowest)
> Total area: 1,545 square miles
> Population: 1,059,361
[in-text-ad]

49. Hawaii
> Total lightning events in 2021: 17,110
> Lightning density: 1.57 events per square mile (3rd lowest)
> Total area: 10,932 square miles
> Population: 1,415,872

48. Washington
> Total lightning events in 2021: 55,779
> Lightning density: 0.78 events per square mile (2nd lowest)
> Total area: 71,298 square miles
> Population: 7,614,893

47. New Hampshire
> Total lightning events in 2021: 56,754
> Lightning density: 6.07 events per square mile (9th lowest)
> Total area: 9,349 square miles
> Population: 1,359,711
[in-text-ad-2]

46. Vermont
> Total lightning events in 2021: 71,264
> Lightning density: 7.41 events per square mile (11th lowest)
> Total area: 9,616 square miles
> Population: 623,989

45. Massachusetts
> Total lightning events in 2021: 109,277
> Lightning density: 10.35 events per square mile (12th lowest)
> Total area: 10,554 square miles
> Population: 6,892,503
[in-text-ad]

44. Maine
> Total lightning events in 2021: 109,705
> Lightning density: 3.10 events per square mile (6th lowest)
> Total area: 35,380 square miles
> Population: 1,344,212

43. Connecticut
> Total lightning events in 2021: 134,073
> Lightning density: 24.19 events per square mile (17th lowest)
> Total area: 5,543 square miles
> Population: 3,565,287

42. Delaware
> Total lightning events in 2021: 151,534
> Lightning density: 60.88 events per square mile (21st highest)
> Total area: 2,489 square miles
> Population: 973,764
[in-text-ad-2]

41. Oregon
> Total lightning events in 2021: 196,356
> Lightning density: 2.00 events per square mile (4th lowest)
> Total area: 98,379 square miles
> Population: 4,217,737

40. Alaska
> Total lightning events in 2021: 306,298
> Lightning density: 0.46 events per square mile (the lowest)
> Total area: 665,384 square miles
> Population: 731,545
[in-text-ad]

39. California
> Total lightning events in 2021: 438,137
> Lightning density: 2.68 events per square mile (5th lowest)
> Total area: 163,695 square miles
> Population: 39,512,223
38. New Jersey
> Total lightning events in 2021: 452,997
> Lightning density: 51.93 events per square mile (23rd highest)
> Total area: 8,723 square miles
> Population: 8,882,190

37. Idaho
> Total lightning events in 2021: 458,158
> Lightning density: 5.48 events per square mile (7th lowest)
> Total area: 83,569 square miles
> Population: 1,787,065
[in-text-ad-2]

36. Nevada
> Total lightning events in 2021: 730,222
> Lightning density: 6.60 events per square mile (10th lowest)
> Total area: 110,572 square miles
> Population: 3,080,156

35. Maryland
> Total lightning events in 2021: 893,700
> Lightning density: 72.04 events per square mile (16th highest)
> Total area: 12,406 square miles
> Population: 6,045,680
[in-text-ad]

34. New York
> Total lightning events in 2021: 1,037,412
> Lightning density: 19.02 events per square mile (16th lowest)
> Total area: 54,555 square miles
> Population: 19,453,561

33. West Virginia
> Total lightning events in 2021: 1,071,308
> Lightning density: 44.21 events per square mile (24th lowest)
> Total area: 24,230 square miles
> Population: 1,792,147

32. Utah
> Total lightning events in 2021: 1,256,895
> Lightning density: 14.80 events per square mile (14th lowest)
> Total area: 84,897 square miles
> Population: 3,205,958
[in-text-ad-2]

31. Wyoming
> Total lightning events in 2021: 1,563,326
> Lightning density: 15.98 events per square mile (15th lowest)
> Total area: 97,813 square miles
> Population: 578,759
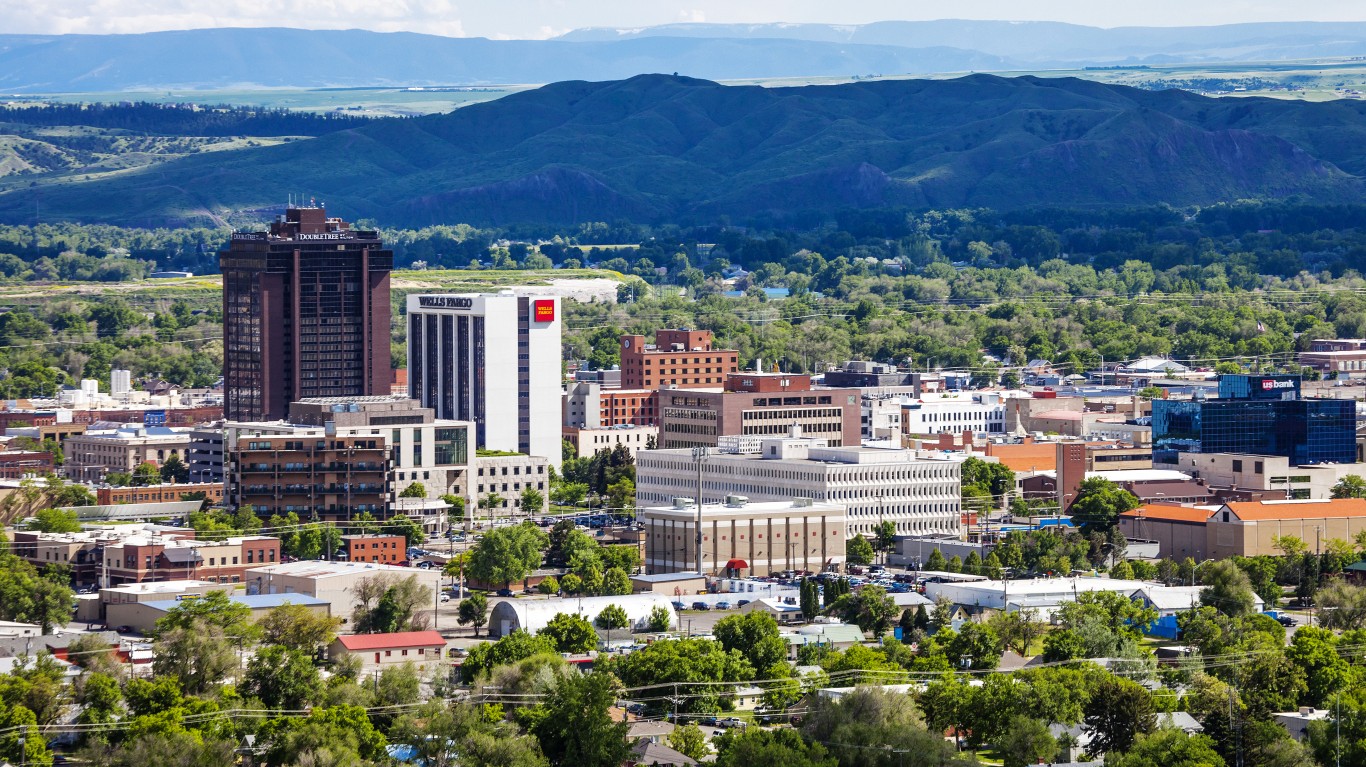
30. Montana
> Total lightning events in 2021: 1,976,333
> Lightning density: 13.44 events per square mile (13th lowest)
> Total area: 147,040 square miles
> Population: 1,068,778
[in-text-ad]

29. South Carolina
> Total lightning events in 2021: 2,117,027
> Lightning density: 66.12 events per square mile (18th highest)
> Total area: 32,020 square miles
> Population: 5,148,714
28. Wisconsin
> Total lightning events in 2021: 2,118,168
> Lightning density: 32.34 events per square mile (21st lowest)
> Total area: 65,496 square miles
> Population: 5,822,434

27. Pennsylvania
> Total lightning events in 2021: 2,255,845
> Lightning density: 48.98 events per square mile (24th highest)
> Total area: 46,054 square miles
> Population: 12,801,989
[in-text-ad-2]

26. Indiana
> Total lightning events in 2021: 2,490,408
> Lightning density: 68.38 events per square mile (17th highest)
> Total area: 36,420 square miles
> Population: 6,732,219

25. North Carolina
> Total lightning events in 2021: 2,545,156
> Lightning density: 47.29 events per square mile (25th highest)
> Total area: 53,819 square miles
> Population: 10,488,084
[in-text-ad]

24. Minnesota
> Total lightning events in 2021: 2,632,119
> Lightning density: 30.28 events per square mile (19th lowest)
> Total area: 86,936 square miles
> Population: 5,639,632

23. Virginia
> Total lightning events in 2021: 2,704,205
> Lightning density: 63.22 events per square mile (19th highest)
> Total area: 42,775 square miles
> Population: 8,535,519

22. Ohio
> Total lightning events in 2021: 2,767,782
> Lightning density: 61.75 events per square mile (20th highest)
> Total area: 44,826 square miles
> Population: 11,689,100
[in-text-ad-2]
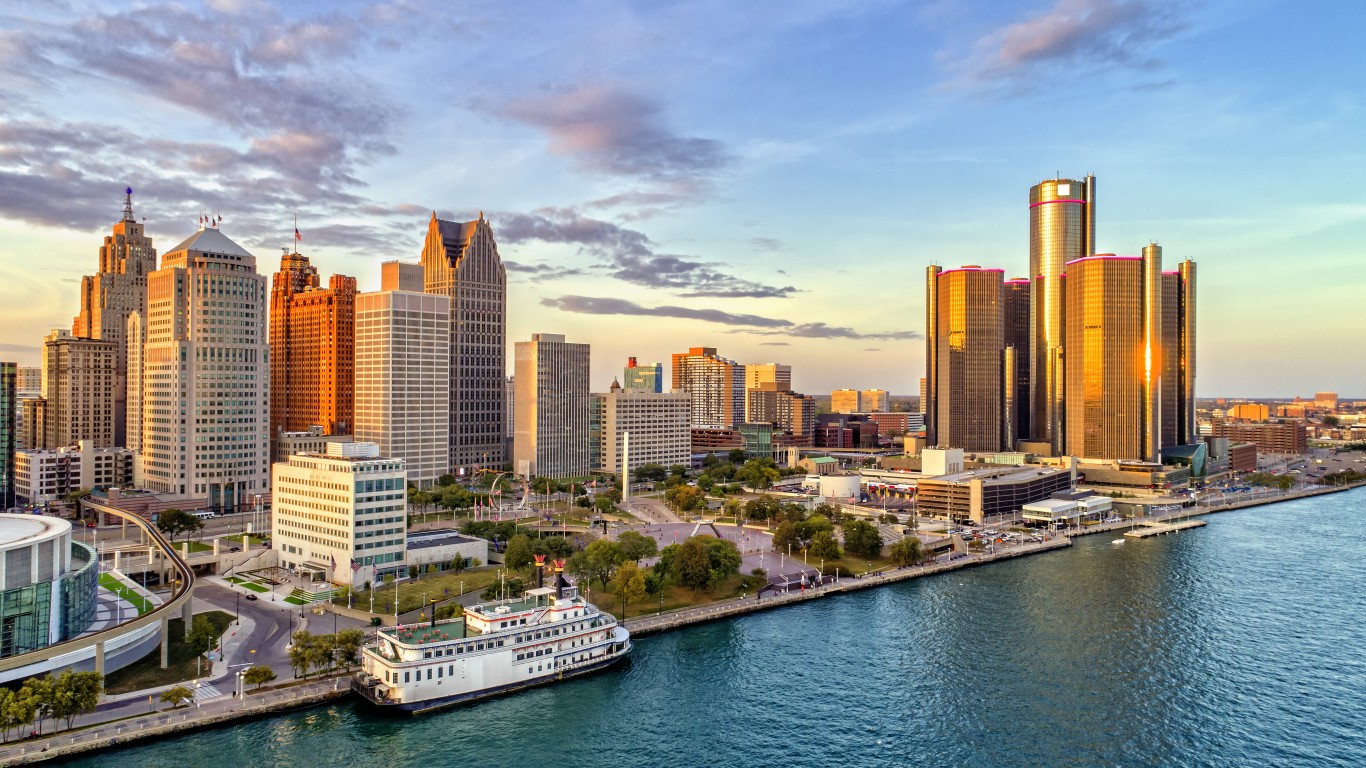
21. Michigan
> Total lightning events in 2021: 2,901,150
> Lightning density: 30.00 events per square mile (18th lowest)
> Total area: 96,714 square miles
> Population: 9,986,857

20. North Dakota
> Total lightning events in 2021: 3,196,746
> Lightning density: 45.22 events per square mile (25th lowest)
> Total area: 70,698 square miles
> Population: 762,062
[in-text-ad]
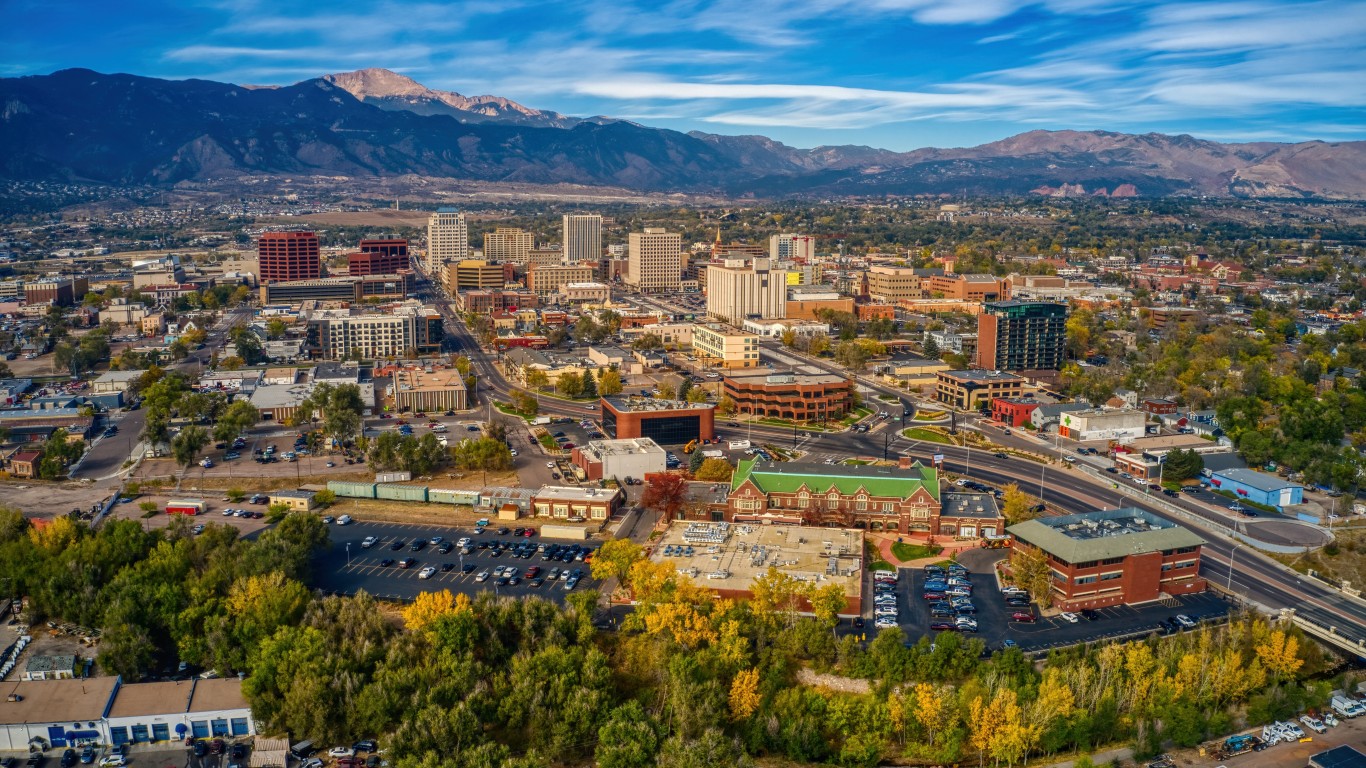
19. Colorado
> Total lightning events in 2021: 3,451,756
> Lightning density: 33.16 events per square mile (22nd lowest)
> Total area: 104,094 square miles
> Population: 5,758,736

18. Arizona
> Total lightning events in 2021: 3,573,539
> Lightning density: 31.35 events per square mile (20th lowest)
> Total area: 113,990 square miles
> Population: 7,278,717

17. Kentucky
> Total lightning events in 2021: 3,703,268
> Lightning density: 91.65 events per square mile (13th highest)
> Total area: 40,408 square miles
> Population: 4,467,673
[in-text-ad-2]

16. Tennessee
> Total lightning events in 2021: 3,914,936
> Lightning density: 92.89 events per square mile (12th highest)
> Total area: 42,144 square miles
> Population: 6,829,174

15. South Dakota
> Total lightning events in 2021: 4,063,473
> Lightning density: 52.69 events per square mile (22nd highest)
> Total area: 77,116 square miles
> Population: 884,659
[in-text-ad]

14. Iowa
> Total lightning events in 2021: 4,134,343
> Lightning density: 73.47 events per square mile (15th highest)
> Total area: 56,273 square miles
> Population: 3,155,070
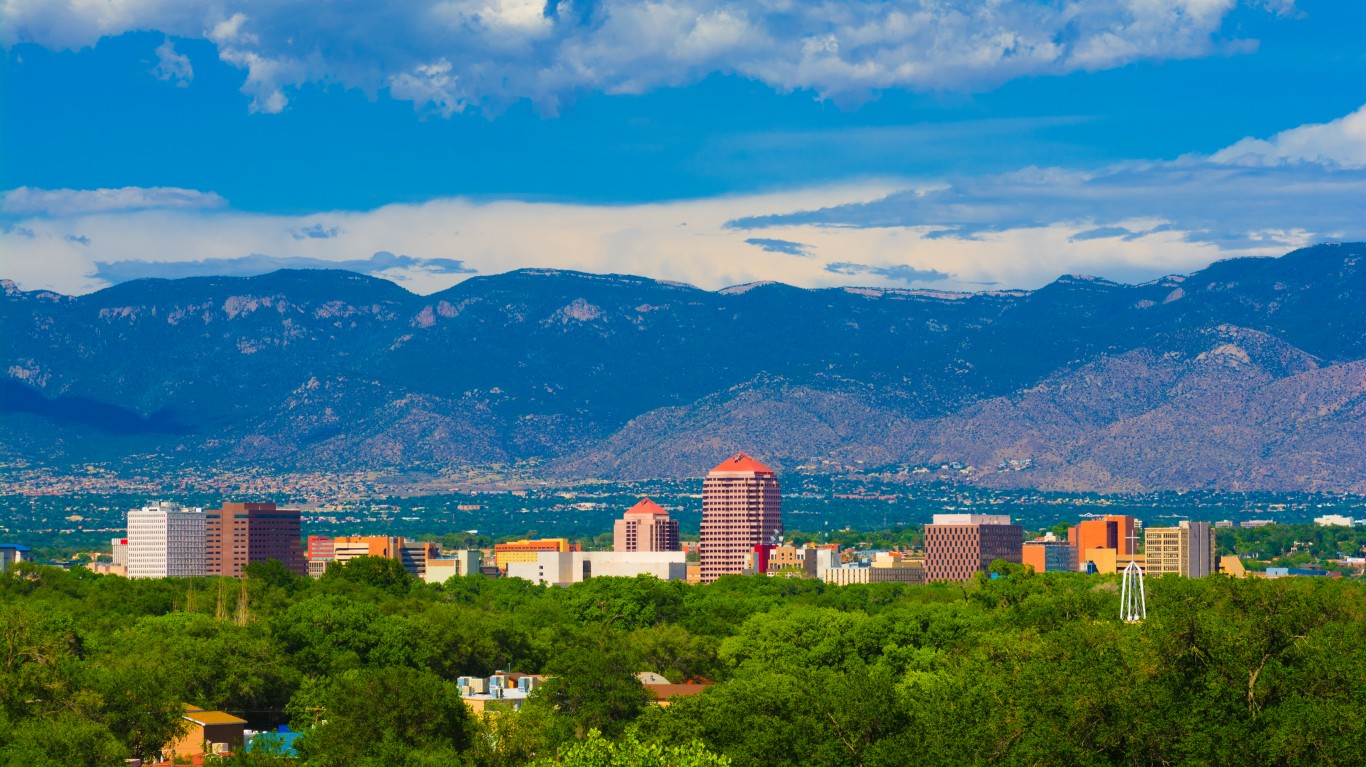
13. New Mexico
> Total lightning events in 2021: 5,114,235
> Lightning density: 42.06 events per square mile (23rd lowest)
> Total area: 121,590 square miles
> Population: 2,096,829

12. Alabama
> Total lightning events in 2021: 5,142,748
> Lightning density: 98.11 events per square mile (10th highest)
> Total area: 52,420 square miles
> Population: 4,903,185
[in-text-ad-2]

11. Georgia
> Total lightning events in 2021: 5,533,354
> Lightning density: 93.11 events per square mile (11th highest)
> Total area: 59,425 square miles
> Population: 10,617,423

10. Arkansas
> Total lightning events in 2021: 5,659,900
> Lightning density: 106.43 events per square mile (9th highest)
> Total area: 53,179 square miles
> Population: 3,017,804
[in-text-ad]

9. Nebraska
> Total lightning events in 2021: 6,143,147
> Lightning density: 79.42 events per square mile (14th highest)
> Total area: 77,348 square miles
> Population: 1,934,408
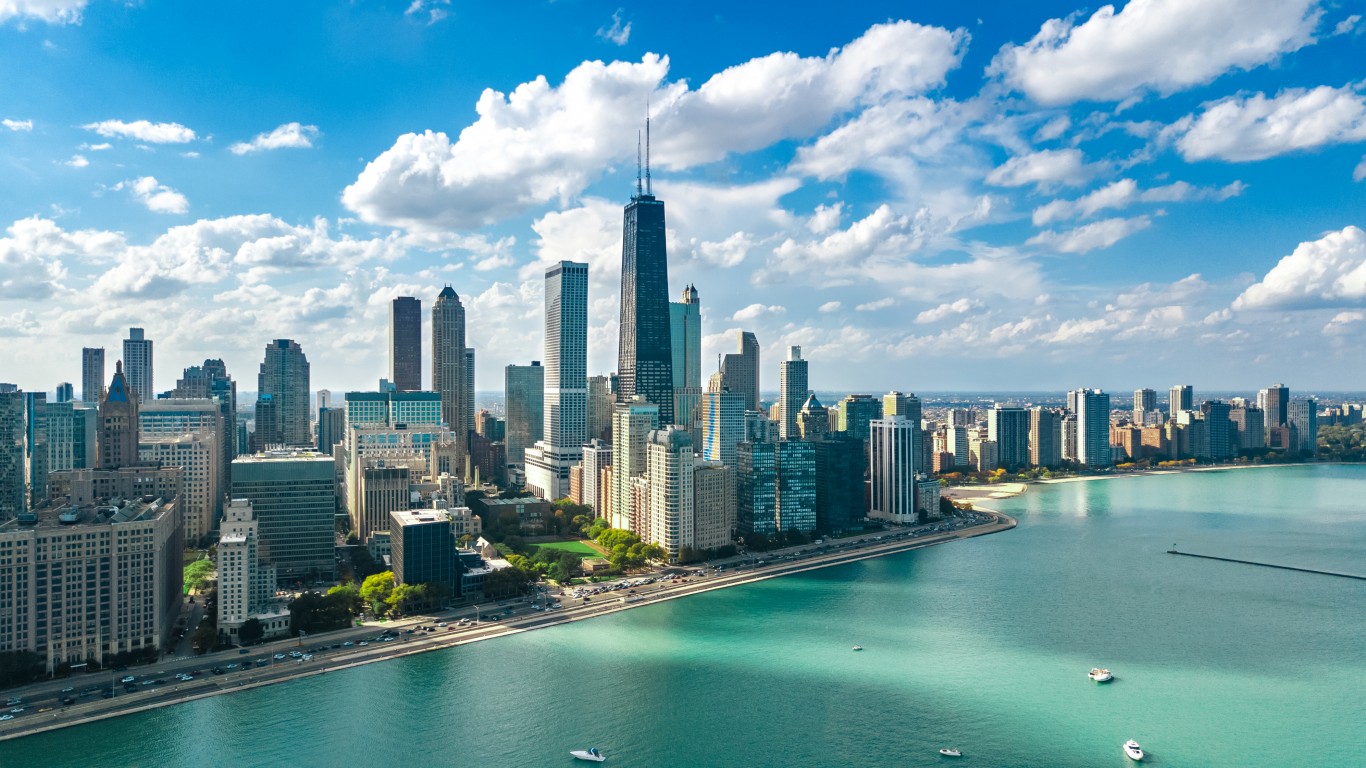
8. Illinois
> Total lightning events in 2021: 6,263,862
> Lightning density: 108.16 events per square mile (7th highest)
> Total area: 57,914 square miles
> Population: 12,671,821

7. Mississippi
> Total lightning events in 2021: 6,999,388
> Lightning density: 144.52 events per square mile (4th highest)
> Total area: 48,432 square miles
> Population: 2,976,149
[in-text-ad-2]

6. Missouri
> Total lightning events in 2021: 7,690,990
> Lightning density: 110.33 events per square mile (6th highest)
> Total area: 69,707 square miles
> Population: 6,137,428

5. Kansas
> Total lightning events in 2021: 8,855,790
> Lightning density: 107.63 events per square mile (8th highest)
> Total area: 82,278 square miles
> Population: 2,913,314
[in-text-ad]

4. Oklahoma
> Total lightning events in 2021: 9,940,752
> Lightning density: 142.22 events per square mile (5th highest)
> Total area: 69,899 square miles
> Population: 3,956,971

3. Louisiana
> Total lightning events in 2021: 11,071,444
> Lightning density: 211.38 events per square mile (2nd highest)
> Total area: 52,378 square miles
> Population: 4,648,794

2. Florida
> Total lightning events in 2021: 14,645,013
> Lightning density: 222.71 events per square mile (the highest)
> Total area: 65,758 square miles
> Population: 21,477,737
[in-text-ad-2]

1. Texas
> Total lightning events in 2021: 41,914,516
> Lightning density: 156.05 events per square mile (3rd highest)
> Total area: 268,596 square miles
> Population: 28,995,881
In 20 Years, I Haven’t Seen A Cash Back Card This Good
After two decades of reviewing financial products I haven’t seen anything like this. Credit card companies are at war, handing out free rewards and benefits to win the best customers.
A good cash back card can be worth thousands of dollars a year in free money, not to mention other perks like travel, insurance, and access to fancy lounges.
Our top pick today pays up to 5% cash back, a $200 bonus on top, and $0 annual fee. Click here to apply before they stop offering rewards this generous.
Flywheel Publishing has partnered with CardRatings for our coverage of credit card products. Flywheel Publishing and CardRatings may receive a commission from card issuers.
Thank you for reading! Have some feedback for us?
Contact the 24/7 Wall St. editorial team.
 24/7 Wall St.
 24/7 Wall St.
 24/7 Wall St.
 24/7 Wall St.