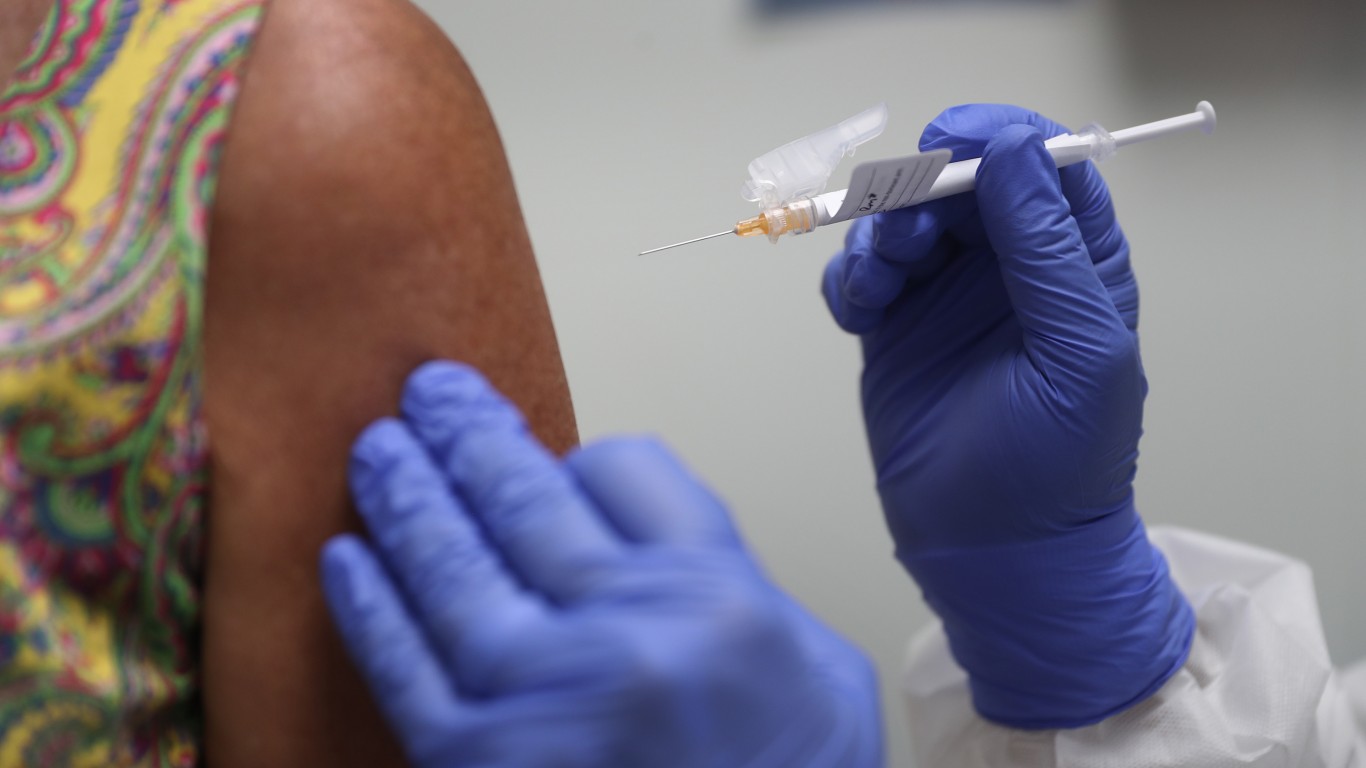
As the omicron variant spreads and new daily cases of COVID-19 hit new highs in the United States, the national vaccination effort is as urgent as it ever has been. So far, an estimated 210,682,471 Americans have been fully vaccinated, or 64.4% of the population.
Some states are proving more effective than others in getting their residents vaccinated. Depending on the state, the share of the population that has been fully vaccinated ranges from as low as 49.4% all the way up to 78.9%.
Due in large part to vaccine hesitancy and resistance, millions of doses are currently sitting idle under the purview of state governments, yet to be administered. As of Jan. 25, only about 81.1% of the 660,939,200 doses of the vaccine that have been distributed to the 50 states and Washington D.C. have been administered. In one state, only 67.1% of delivered doses have gone into the arms of residents.
Meanwhile, the virus continues to spread. In total, there have been 21,443 known infections for every 100,000 people nationwide.

51. Alabama
> Residents who are fully vaccinated as of Jan. 25, 2022: 2,414,385 (49.4% of the pop.)
> Share of vaccine doses administered: 67.1%
> Cumulative COVID-19 cases as of Jan. 25, 2022: 23,592 per 100,000 people (total: 1,153,152)
> Population: 4,887,871

50. Mississippi
> Residents who are fully vaccinated as of Jan. 25, 2022: 1,483,766 (49.7% of the pop.)
> Share of vaccine doses administered: 72.7%
> Cumulative COVID-19 cases as of Jan. 25, 2022: 22,815 per 100,000 people (total: 681,382)
> Population: 2,986,530
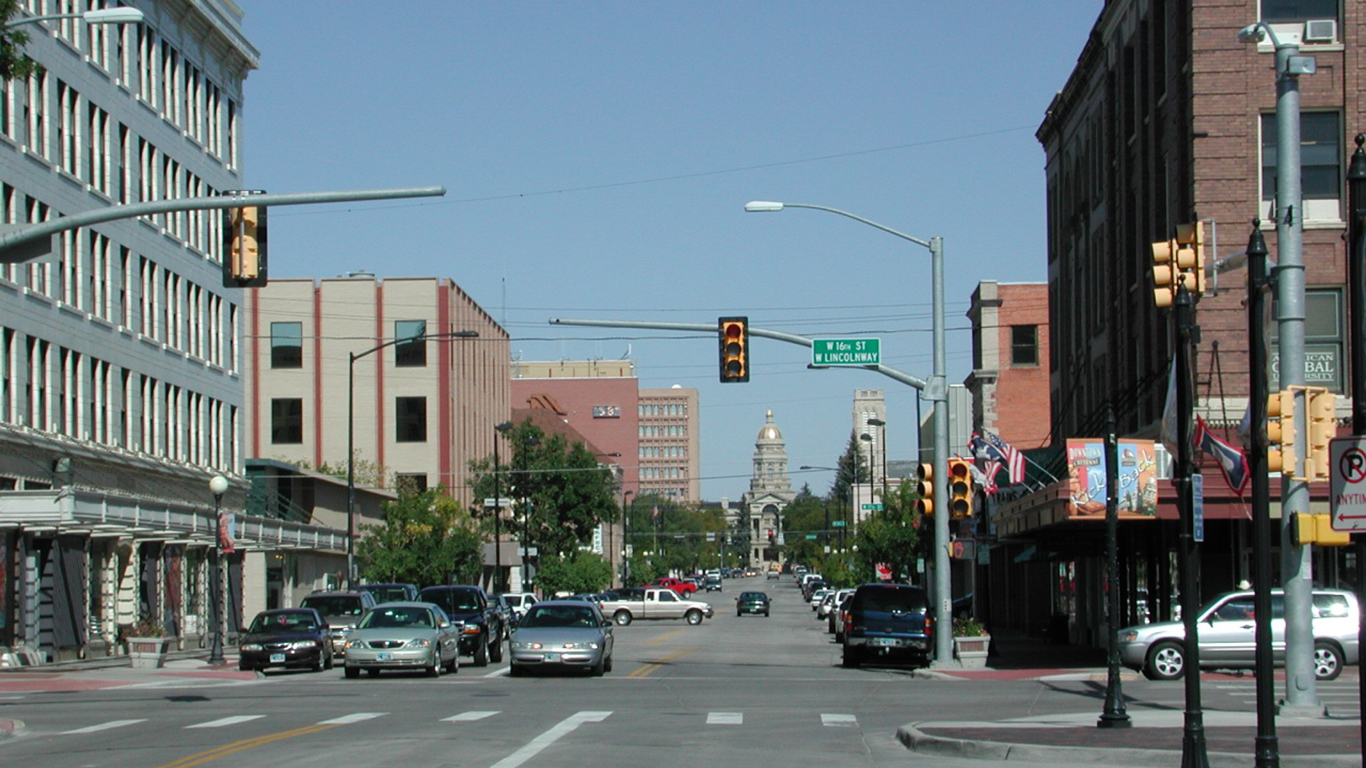
49. Wyoming
> Residents who are fully vaccinated as of Jan. 25, 2022: 287,131 (49.7% of the pop.)
> Share of vaccine doses administered: 78.7%
> Cumulative COVID-19 cases as of Jan. 25, 2022: 23,431 per 100,000 people (total: 135,369)
> Population: 577,737

48. Louisiana
> Residents who are fully vaccinated as of Jan. 25, 2022: 2,396,194 (51.4% of the pop.)
> Share of vaccine doses administered: 78.5%
> Cumulative COVID-19 cases as of Jan. 25, 2022: 22,747 per 100,000 people (total: 1,060,022)
> Population: 4,659,978

47. Arkansas
> Residents who are fully vaccinated as of Jan. 25, 2022: 1,583,447 (52.5% of the pop.)
> Share of vaccine doses administered: 71.6%
> Cumulative COVID-19 cases as of Jan. 25, 2022: 24,508 per 100,000 people (total: 738,638)
> Population: 3,013,825

46. Idaho
> Residents who are fully vaccinated as of Jan. 25, 2022: 928,996 (53.0% of the pop.)
> Share of vaccine doses administered: 74.2%
> Cumulative COVID-19 cases as of Jan. 25, 2022: 20,411 per 100,000 people (total: 358,057)
> Population: 1,754,208
These are all the counties in Idaho where COVID-19 is slowing (and where it’s still getting worse).

45. Tennessee
> Residents who are fully vaccinated as of Jan. 25, 2022: 3,587,026 (53.0% of the pop.)
> Share of vaccine doses administered: 79.1%
> Cumulative COVID-19 cases as of Jan. 25, 2022: 25,646 per 100,000 people (total: 1,736,210)
> Population: 6,770,010

44. Georgia
> Residents who are fully vaccinated as of Jan. 25, 2022: 5,589,109 (53.1% of the pop.)
> Share of vaccine doses administered: 70.7%
> Cumulative COVID-19 cases as of Jan. 25, 2022: 21,196 per 100,000 people (total: 2,229,675)
> Population: 10,519,475

43. Indiana
> Residents who are fully vaccinated as of Jan. 25, 2022: 3,567,525 (53.3% of the pop.)
> Share of vaccine doses administered: 75.0%
> Cumulative COVID-19 cases as of Jan. 25, 2022: 22,782 per 100,000 people (total: 1,524,527)
> Population: 6,691,878
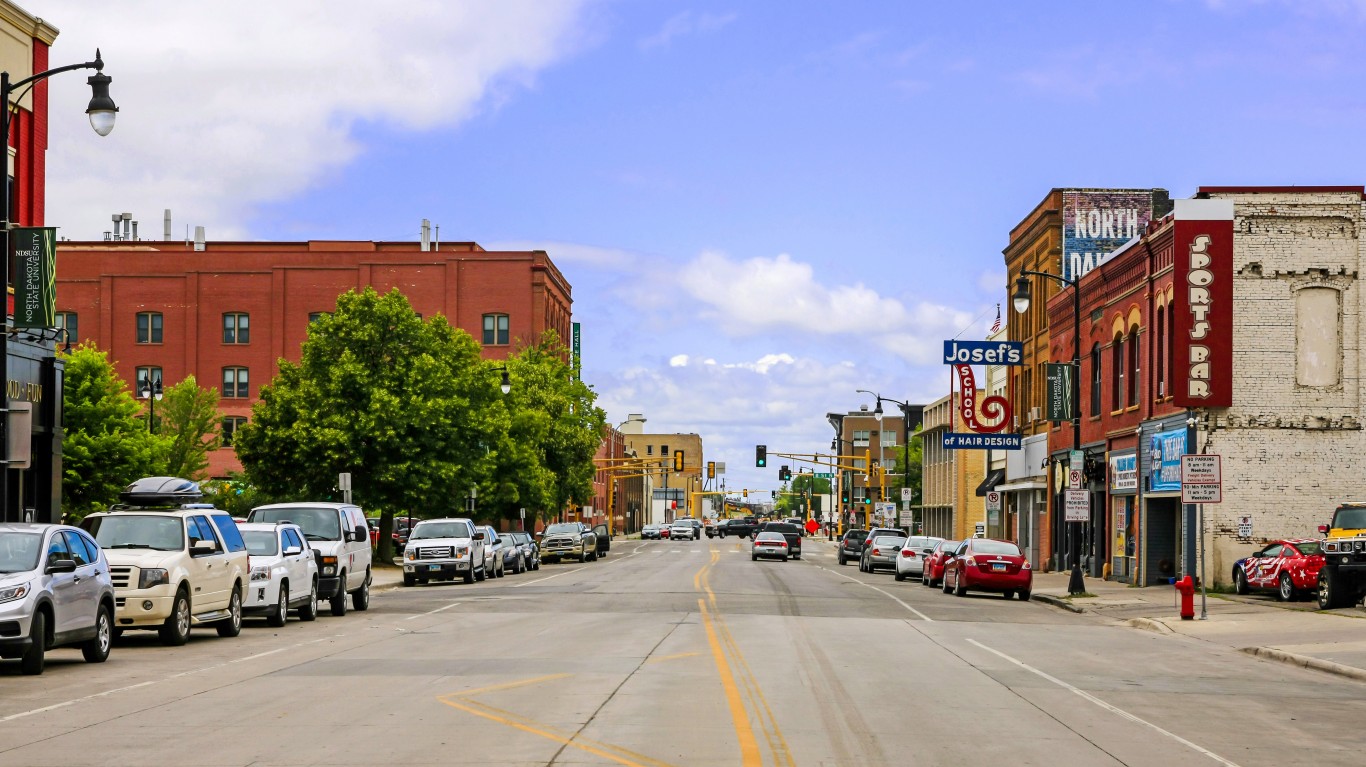
42. North Dakota
> Residents who are fully vaccinated as of Jan. 25, 2022: 409,974 (53.9% of the pop.)
> Share of vaccine doses administered: 82.5%
> Cumulative COVID-19 cases as of Jan. 25, 2022: 27,766 per 100,000 people (total: 211,040)
> Population: 760,077

41. Missouri
> Residents who are fully vaccinated as of Jan. 25, 2022: 3,323,802 (54.3% of the pop.)
> Share of vaccine doses administered: 79.7%
> Cumulative COVID-19 cases as of Jan. 25, 2022: 20,729 per 100,000 people (total: 1,269,953)
> Population: 6,126,452

40. Oklahoma
> Residents who are fully vaccinated as of Jan. 25, 2022: 2,171,002 (55.1% of the pop.)
> Share of vaccine doses administered: 82.8%
> Cumulative COVID-19 cases as of Jan. 25, 2022: 22,670 per 100,000 people (total: 893,913)
> Population: 3,943,079

39. South Carolina
> Residents who are fully vaccinated as of Jan. 25, 2022: 2,815,326 (55.4% of the pop.)
> Share of vaccine doses administered: 73.9%
> Cumulative COVID-19 cases as of Jan. 25, 2022: 24,841 per 100,000 people (total: 1,262,939)
> Population: 5,084,127

38. Kentucky
> Residents who are fully vaccinated as of Jan. 25, 2022: 2,477,675 (55.4% of the pop.)
> Share of vaccine doses administered: 76.8%
> Cumulative COVID-19 cases as of Jan. 25, 2022: 23,639 per 100,000 people (total: 1,056,284)
> Population: 4,468,402

37. Montana
> Residents who are fully vaccinated as of Jan. 25, 2022: 589,060 (55.5% of the pop.)
> Share of vaccine doses administered: 82.3%
> Cumulative COVID-19 cases as of Jan. 25, 2022: 20,907 per 100,000 people (total: 222,093)
> Population: 1,062,305

36. West Virginia
> Residents who are fully vaccinated as of Jan. 25, 2022: 1,003,779 (55.6% of the pop.)
> Share of vaccine doses administered: 69.6%
> Cumulative COVID-19 cases as of Jan. 25, 2022: 23,196 per 100,000 people (total: 418,887)
> Population: 1,805,832

35. Ohio
> Residents who are fully vaccinated as of Jan. 25, 2022: 6,605,725 (56.5% of the pop.)
> Share of vaccine doses administered: 79.4%
> Cumulative COVID-19 cases as of Jan. 25, 2022: 21,440 per 100,000 people (total: 2,506,175)
> Population: 11,689,442
These are all the counties in Ohio where COVID-19 is slowing (and where it’s still getting worse).

34. Alaska
> Residents who are fully vaccinated as of Jan. 25, 2022: 425,713 (57.7% of the pop.)
> Share of vaccine doses administered: 77.1%
> Cumulative COVID-19 cases as of Jan. 25, 2022: 25,577 per 100,000 people (total: 188,612)
> Population: 737,438
These are all the counties in Alaska where COVID-19 is slowing (and where it’s still getting worse).

33. Michigan
> Residents who are fully vaccinated as of Jan. 25, 2022: 5,789,101 (57.9% of the pop.)
> Share of vaccine doses administered: 76.3%
> Cumulative COVID-19 cases as of Jan. 25, 2022: 21,251 per 100,000 people (total: 2,124,225)
> Population: 9,995,915

32. North Carolina
> Residents who are fully vaccinated as of Jan. 25, 2022: 6,099,531 (58.7% of the pop.)
> Share of vaccine doses administered: 78.1%
> Cumulative COVID-19 cases as of Jan. 25, 2022: 21,310 per 100,000 people (total: 2,212,752)
> Population: 10,383,620

31. South Dakota
> Residents who are fully vaccinated as of Jan. 25, 2022: 518,744 (58.8% of the pop.)
> Share of vaccine doses administered: 77.8%
> Cumulative COVID-19 cases as of Jan. 25, 2022: 24,558 per 100,000 people (total: 216,656)
> Population: 882,235

30. Kansas
> Residents who are fully vaccinated as of Jan. 25, 2022: 1,712,610 (58.8% of the pop.)
> Share of vaccine doses administered: 77.9%
> Cumulative COVID-19 cases as of Jan. 25, 2022: 23,404 per 100,000 people (total: 681,405)
> Population: 2,911,505
These are all the counties in Kansas where COVID-19 is slowing (and where it’s still getting worse).

29. Nevada
> Residents who are fully vaccinated as of Jan. 25, 2022: 1,791,552 (59.0% of the pop.)
> Share of vaccine doses administered: 83.8%
> Cumulative COVID-19 cases as of Jan. 25, 2022: 20,251 per 100,000 people (total: 614,505)
> Population: 3,034,392
These are all the counties in Nevada where COVID-19 is slowing (and where it’s still getting worse).

28. Texas
> Residents who are fully vaccinated as of Jan. 25, 2022: 16,958,567 (59.1% of the pop.)
> Share of vaccine doses administered: 75.9%
> Cumulative COVID-19 cases as of Jan. 25, 2022: 20,675 per 100,000 people (total: 5,934,240)
> Population: 28,701,845
These are all the counties in Texas where COVID-19 is slowing (and where it’s still getting worse).

27. Arizona
> Residents who are fully vaccinated as of Jan. 25, 2022: 4,259,553 (59.4% of the pop.)
> Share of vaccine doses administered: 82.4%
> Cumulative COVID-19 cases as of Jan. 25, 2022: 24,437 per 100,000 people (total: 1,752,552)
> Population: 7,171,646

26. Iowa
> Residents who are fully vaccinated as of Jan. 25, 2022: 1,897,851 (60.1% of the pop.)
> Share of vaccine doses administered: 80.0%
> Cumulative COVID-19 cases as of Jan. 25, 2022: 21,620 per 100,000 people (total: 682,363)
> Population: 3,156,145
These are all the counties in Iowa where COVID-19 is slowing (and where it’s still getting worse).

25. Utah
> Residents who are fully vaccinated as of Jan. 25, 2022: 1,938,988 (61.3% of the pop.)
> Share of vaccine doses administered: 82.5%
> Cumulative COVID-19 cases as of Jan. 25, 2022: 26,130 per 100,000 people (total: 825,989)
> Population: 3,161,105
These are all the counties in Utah where COVID-19 is slowing (and where it’s still getting worse).

24. Nebraska
> Residents who are fully vaccinated as of Jan. 25, 2022: 1,186,523 (61.5% of the pop.)
> Share of vaccine doses administered: 82.5%
> Cumulative COVID-19 cases as of Jan. 25, 2022: 21,410 per 100,000 people (total: 413,056)
> Population: 1,929,268

23. Wisconsin
> Residents who are fully vaccinated as of Jan. 25, 2022: 3,685,067 (63.4% of the pop.)
> Share of vaccine doses administered: 89.8%
> Cumulative COVID-19 cases as of Jan. 25, 2022: 24,876 per 100,000 people (total: 1,446,207)
> Population: 5,813,568

22. Florida
> Residents who are fully vaccinated as of Jan. 25, 2022: 13,925,339 (65.4% of the pop.)
> Share of vaccine doses administered: 80.2%
> Cumulative COVID-19 cases as of Jan. 25, 2022: 25,108 per 100,000 people (total: 5,347,828)
> Population: 21,299,325

21. Pennsylvania
> Residents who are fully vaccinated as of Jan. 25, 2022: 8,376,030 (65.4% of the pop.)
> Share of vaccine doses administered: 77.5%
> Cumulative COVID-19 cases as of Jan. 25, 2022: 20,087 per 100,000 people (total: 2,572,500)
> Population: 12,807,060

20. Illinois
> Residents who are fully vaccinated as of Jan. 25, 2022: 8,335,013 (65.4% of the pop.)
> Share of vaccine doses administered: 84.1%
> Cumulative COVID-19 cases as of Jan. 25, 2022: 21,767 per 100,000 people (total: 2,773,362)
> Population: 12,741,080

19. Delaware
> Residents who are fully vaccinated as of Jan. 25, 2022: 642,180 (66.4% of the pop.)
> Share of vaccine doses administered: 79.0%
> Cumulative COVID-19 cases as of Jan. 25, 2022: 24,833 per 100,000 people (total: 240,179)
> Population: 967,171

18. Minnesota
> Residents who are fully vaccinated as of Jan. 25, 2022: 3,766,943 (67.1% of the pop.)
> Share of vaccine doses administered: 83.2%
> Cumulative COVID-19 cases as of Jan. 25, 2022: 21,684 per 100,000 people (total: 1,216,734)
> Population: 5,611,179

17. Oregon
> Residents who are fully vaccinated as of Jan. 25, 2022: 2,851,847 (68.1% of the pop.)
> Share of vaccine doses administered: 78.4%
> Cumulative COVID-19 cases as of Jan. 25, 2022: 13,623 per 100,000 people (total: 570,892)
> Population: 4,190,713
These are all the counties in Oregon where COVID-19 is slowing (and where it’s still getting worse).

16. New Mexico
> Residents who are fully vaccinated as of Jan. 25, 2022: 1,426,831 (68.1% of the pop.)
> Share of vaccine doses administered: 88.9%
> Cumulative COVID-19 cases as of Jan. 25, 2022: 20,900 per 100,000 people (total: 437,934)
> Population: 2,095,428

15. California
> Residents who are fully vaccinated as of Jan. 25, 2022: 27,051,905 (68.4% of the pop.)
> Share of vaccine doses administered: 85.5%
> Cumulative COVID-19 cases as of Jan. 25, 2022: 19,138 per 100,000 people (total: 7,570,538)
> Population: 39,557,045

14. Colorado
> Residents who are fully vaccinated as of Jan. 25, 2022: 3,913,025 (68.7% of the pop.)
> Share of vaccine doses administered: 87.3%
> Cumulative COVID-19 cases as of Jan. 25, 2022: 20,821 per 100,000 people (total: 1,185,867)
> Population: 5,695,564

13. New Hampshire
> Residents who are fully vaccinated as of Jan. 25, 2022: 931,960 (68.7% of the pop.)
> Share of vaccine doses administered: 81.2%
> Cumulative COVID-19 cases as of Jan. 25, 2022: 19,005 per 100,000 people (total: 257,793)
> Population: 1,356,458

12. Washington
> Residents who are fully vaccinated as of Jan. 25, 2022: 5,310,090 (70.5% of the pop.)
> Share of vaccine doses administered: 82.4%
> Cumulative COVID-19 cases as of Jan. 25, 2022: 15,285 per 100,000 people (total: 1,151,835)
> Population: 7,535,591

11. Virginia
> Residents who are fully vaccinated as of Jan. 25, 2022: 6,006,596 (70.5% of the pop.)
> Share of vaccine doses administered: 84.2%
> Cumulative COVID-19 cases as of Jan. 25, 2022: 17,198 per 100,000 people (total: 1,464,850)
> Population: 8,517,685
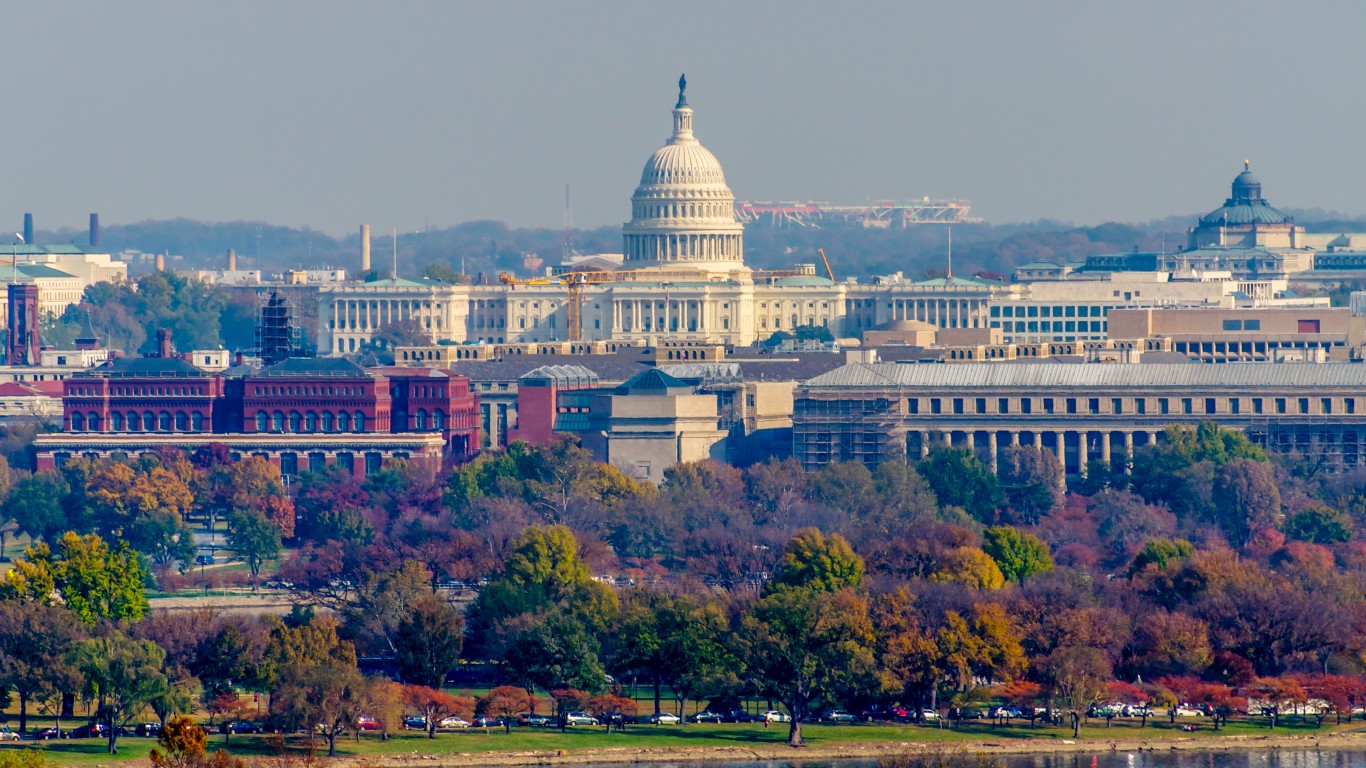
10. District of Columbia
> Residents who are fully vaccinated as of Jan. 25, 2022: 491,687 (71.8% of the pop.)
> Share of vaccine doses administered: 79.8%
> Cumulative COVID-19 cases as of Jan. 25, 2022: 18,583 per 100,000 people (total: 127,200)
> Population: 684,498
Click here to see all current COVID-19 data for Washington D.C.

9. New Jersey
> Residents who are fully vaccinated as of Jan. 25, 2022: 6,416,218 (72.0% of the pop.)
> Share of vaccine doses administered: 79.2%
> Cumulative COVID-19 cases as of Jan. 25, 2022: 23,210 per 100,000 people (total: 2,067,692)
> Population: 8,908,520

8. Maryland
> Residents who are fully vaccinated as of Jan. 25, 2022: 4,368,323 (72.3% of the pop.)
> Share of vaccine doses administered: 77.1%
> Cumulative COVID-19 cases as of Jan. 25, 2022: 15,483 per 100,000 people (total: 935,624)
> Population: 6,042,718

7. New York
> Residents who are fully vaccinated as of Jan. 25, 2022: 14,341,340 (73.4% of the pop.)
> Share of vaccine doses administered: 86.6%
> Cumulative COVID-19 cases as of Jan. 25, 2022: 24,018 per 100,000 people (total: 4,693,583)
> Population: 19,542,209

6. Hawaii
> Residents who are fully vaccinated as of Jan. 25, 2022: 1,070,599 (75.4% of the pop.)
> Share of vaccine doses administered: 84.2%
> Cumulative COVID-19 cases as of Jan. 25, 2022: 13,909 per 100,000 people (total: 197,582)
> Population: 1,420,491
These are all the counties in Hawaii where COVID-19 is slowing (and where it’s still getting worse).

5. Massachusetts
> Residents who are fully vaccinated as of Jan. 25, 2022: 5,246,573 (76.0% of the pop.)
> Share of vaccine doses administered: 88.8%
> Cumulative COVID-19 cases as of Jan. 25, 2022: 22,254 per 100,000 people (total: 1,535,986)
> Population: 6,902,149

4. Connecticut
> Residents who are fully vaccinated as of Jan. 25, 2022: 2,718,968 (76.1% of the pop.)
> Share of vaccine doses administered: 88.5%
> Cumulative COVID-19 cases as of Jan. 25, 2022: 18,800 per 100,000 people (total: 671,674)
> Population: 3,572,665

3. Maine
> Residents who are fully vaccinated as of Jan. 25, 2022: 1,039,373 (77.7% of the pop.)
> Share of vaccine doses administered: 85.9%
> Cumulative COVID-19 cases as of Jan. 25, 2022: 12,470 per 100,000 people (total: 166,899)
> Population: 1,338,404
These are all the counties in Maine where COVID-19 is slowing (and where it’s still getting worse).

2. Rhode Island
> Residents who are fully vaccinated as of Jan. 25, 2022: 831,755 (78.7% of the pop.)
> Share of vaccine doses administered: 85.4%
> Cumulative COVID-19 cases as of Jan. 25, 2022: 30,938 per 100,000 people (total: 327,109)
> Population: 1,057,315

1. Vermont
> Residents who are fully vaccinated as of Jan. 25, 2022: 494,049 (78.9% of the pop.)
> Share of vaccine doses administered: 78.8%
> Cumulative COVID-19 cases as of Jan. 25, 2022: 14,220 per 100,000 people (total: 89,058)
> Population: 626,299
Click here to see all coronavirus data for every state.
Is Your Money Earning the Best Possible Rate? (Sponsor)
Let’s face it: If your money is just sitting in a checking account, you’re losing value every single day. With most checking accounts offering little to no interest, the cash you worked so hard to save is gradually being eroded by inflation.
However, by moving that money into a high-yield savings account, you can put your cash to work, growing steadily with little to no effort on your part. In just a few clicks, you can set up a high-yield savings account and start earning interest immediately.
There are plenty of reputable banks and online platforms that offer competitive rates, and many of them come with zero fees and no minimum balance requirements. Click here to see if you’re earning the best possible rate on your money!
Thank you for reading! Have some feedback for us?
Contact the 24/7 Wall St. editorial team.