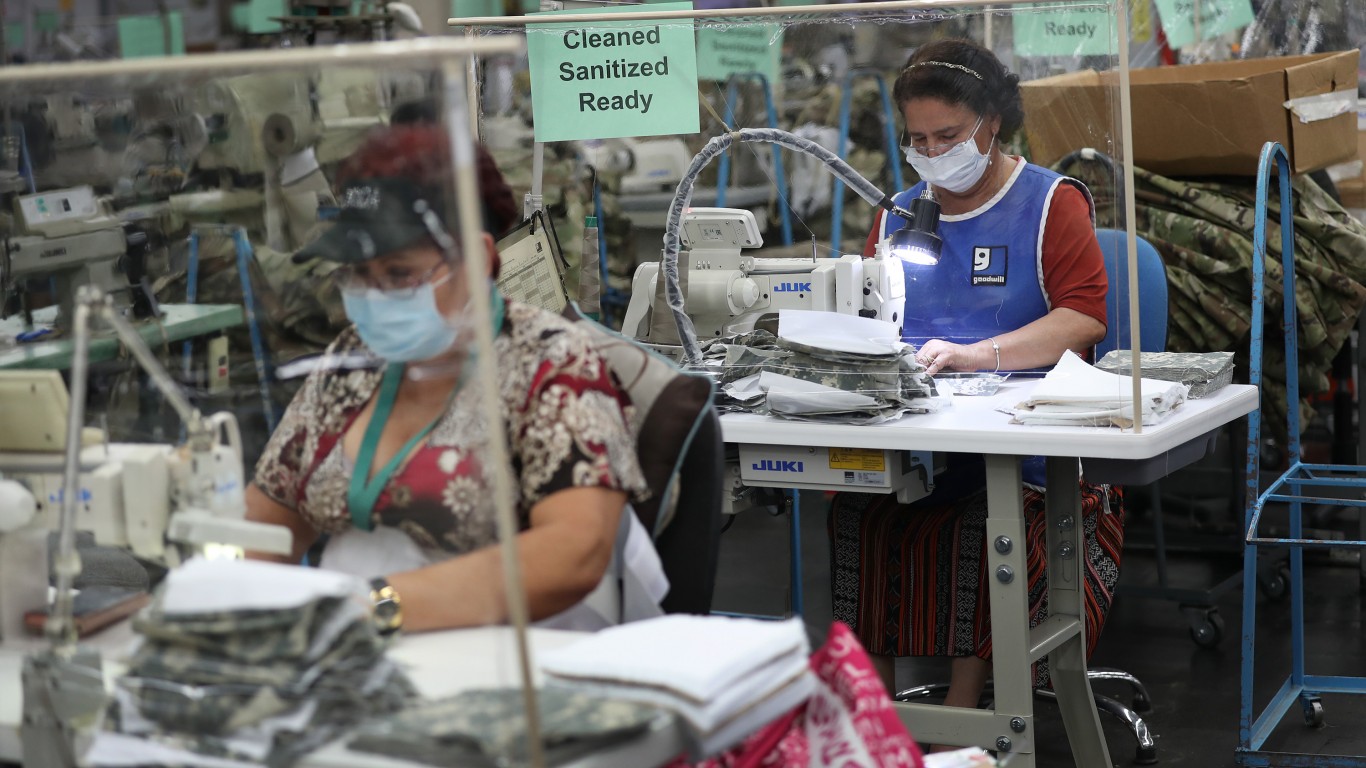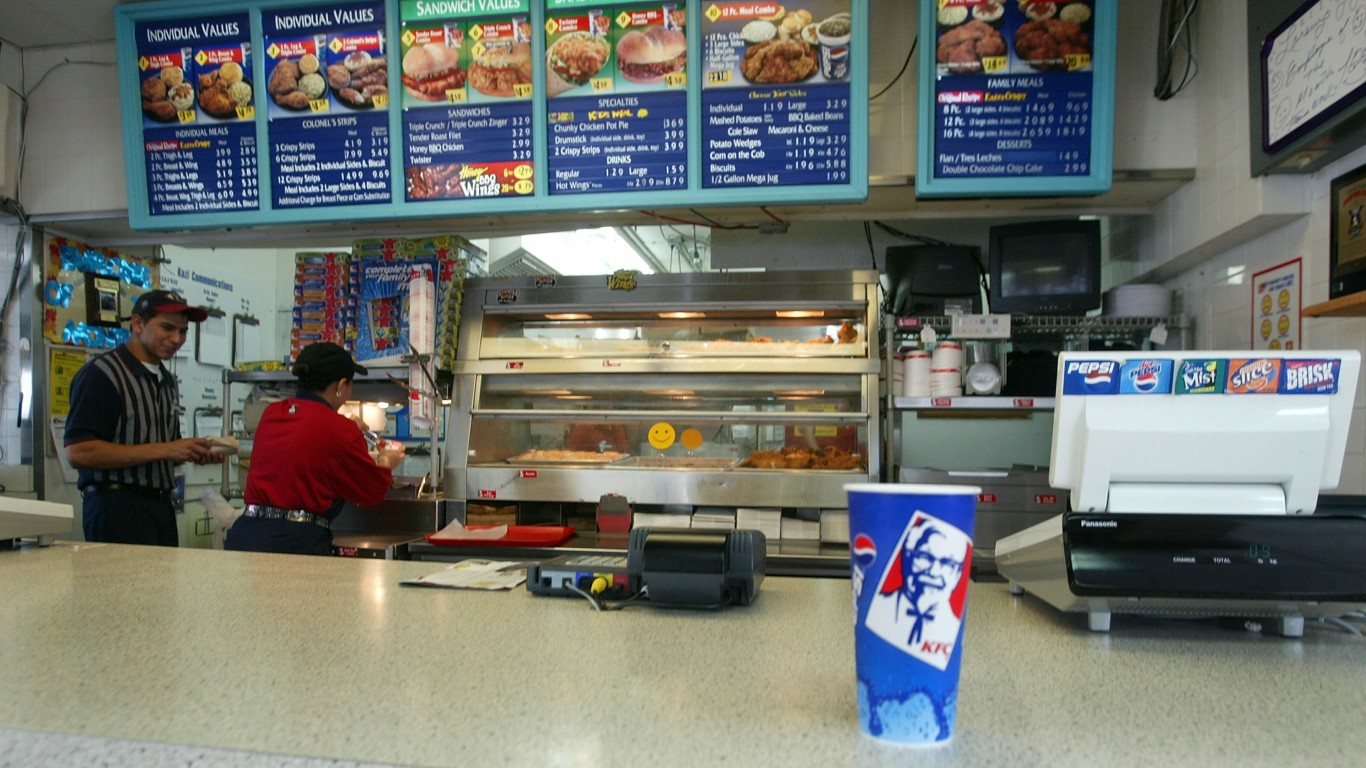
The lowest-paid American workers are so often the people with whom we interact the most in our daily lives. They’re not just the people who prepare and serve our food, but also just about any service-related worker, from auto repair attendants to the people who shampoo our hair at the salon. They’re the people who clean hotel and hospital rooms, dry-clean clothes, and even take care of children to allow parents to work.
It is often said that a college education leads to higher-paying jobs, but this isn’t always true. By one estimate, locker room, coatroom, and dressing room attendants are almost as likely to have a four-year degree as the average U.S. adult. And nearly one in five childcare workers holds a bachelor’s degree, showing that higher educational attainment doesn’t automatically lead to decent wages or benefits. (These are the lowest-paying jobs for college grads.)
Though American public-school teachers aren’t among the country’s lowest-paid workers, they often struggle to make ends meet and are notoriously underpaid compared to others with comparable levels of higher education. (Teaching certainly isn’t one of the 87 jobs with six-figure salaries.)
To determine the worst paying jobs in America, 24/7 Wall St. reviewed data on median annual wage estimates for 789 detailed occupations from the May 2020 Occupational Employment and Wage Statistics program of the U.S. Bureau of Labor Statistics. Detailed occupations were ranked based on the median annual earnings for all employees in 2020. Data on projected employment change from 2020 to 2030 and the percentage of workers with at least a bachelor’s degree in 2018-2019 came from the BLS Employment Projections program. Only workers aged 25 or over were considered.
Certainly, when it comes to the laws of supply and demand in the labor market, those with skills that are easier to obtain than others (such as food preparation and washing clothes compared to performing surgeries or litigating cases in court) are not going to be paid as well. But an important question is whether anyone in America who works full time or struggles to get as many hours as possible should be paid less than what it takes to cover basic living costs, including rent, health insurance premiums, and childcare. How much the lowest-paid workers should earn is still an ongoing debate.
Click here to see the lowest-paying jobs in America

25. Locker room, coatroom, and dressing room attendants
> Median annual earnings: $26,700
> Total number of workers: 11,530
> Projected employment change, 2020-2030: +26.7%
> Locker room, coatroom, and dressing room attendants with a bachelor’s degree: 30.9%
[in-text-ad]

24. Short order cooks
> Median annual earnings: $26,570
> Total number of workers: 123,350
> Projected employment change, 2020-2030: +9.6%
> Short order cooks with a bachelor’s degree: 6.3%

23. Automotive and watercraft service attendants
> Median annual earnings: $26,540
> Total number of workers: 112,750
> Projected employment change, 2020-2030: +4.3%
> Automotive and watercraft service attendants with a bachelor’s degree: 5.7%

22. Maids and housekeeping cleaners
> Median annual earnings: $26,220
> Total number of workers: 795,590
> Projected employment change, 2020-2030: +11.3%
> Maids and housekeeping cleaners with a bachelor’s degree: 5.6%
[in-text-ad-2]

21. Animal caretakers
> Median annual earnings: $26,080
> Total number of workers: 193,660
> Projected employment change, 2020-2030: +34.4%
> Animal caretakers with a bachelor’s degree: 24.3%

20. Food preparation workers
> Median annual earnings: $26,070
> Total number of workers: 793,590
> Projected employment change, 2020-2030: +6.4%
> Food preparation workers with a bachelor’s degree: 8.9%
[in-text-ad]

19. Non-restaurant food servers
> Median annual earnings: $25,910
> Total number of workers: 254,650
> Projected employment change, 2020-2030: +13.8%
> Non-restaurant food servers with a bachelor’s degree: 11.7%

18. Pressers, textile, garment, and related materials
> Median annual earnings: $25,580
> Total number of workers: 31,980
> Projected employment change, 2020-2030: -10.9%
> Pressers, textile, garment, and related materials with a bachelor’s degree: 2.8%

17. Hotel, motel, and resort desk clerks
> Median annual earnings: $25,490
> Total number of workers: 222,550
> Projected employment change, 2020-2030: +16.4%
> Hotel, motel, and resort desk clerks with a bachelor’s degree: 19.2%
[in-text-ad-2]

16. Laundry and dry-cleaning workers
> Median annual earnings: $25,470
> Total number of workers: 179,890
> Projected employment change, 2020-2030: +11.7%
> Laundry and dry-cleaning workers with a bachelor’s degree: 5.4%

15. Childcare workers
> Median annual earnings: $25,460
> Total number of workers: 494,360
> Projected employment change, 2020-2030: +8.5%
> Childcare workers with a bachelor’s degree: 19.6%
[in-text-ad]

14. Dishwashers
> Median annual earnings: $25,270
> Total number of workers: 395,660
> Projected employment change, 2020-2030: +19%
> Dishwashers with a bachelor’s degree: 4.2%

13. Gambling and sports book writers and runners
> Median annual earnings: $25,220
> Total number of workers: 7,500
> Projected employment change, 2020-2030: +28.8%
> Gambling and sports book writers and runners with a bachelor’s degree: 18.5%

12. Ushers, lobby attendants, and ticket takers
> Median annual earnings: $25,110
> Total number of workers: 95,600
> Projected employment change, 2020-2030: +61.8%
> Ushers, lobby attendants, and ticket takers with a bachelor’s degree: 27.1%
[in-text-ad-2]

11. Lifeguards, ski patrol, and other recreational protective service workers
> Median annual earnings: $25,020
> Total number of workers: 113,150
> Projected employment change, 2020-2030: +24.5%
> Lifeguards, ski patrol, and other recreational protective service workers with a bachelor’s degree: 43%

10. Cashiers
> Median annual earnings: $25,020
> Total number of workers: 3,333,100
> Projected employment change, 2020-2030: -10%
> Cashiers with a bachelor’s degree: 12.4%
[in-text-ad]

9. Dining room and cafeteria attendants and bartender helpers
> Median annual earnings: $25,010
> Total number of workers: 374,940
> Projected employment change, 2020-2030: +26.6%
> Dining room and cafeteria attendants and bartender helpers with a bachelor’s degree: 9.1%

8. Bartenders
> Median annual earnings: $24,960
> Total number of workers: 486,720
> Projected employment change, 2020-2030: +32.5%
> Bartenders with a bachelor’s degree: 22.4%

7. Amusement and recreation attendants
> Median annual earnings: $24,760
> Total number of workers: 248,190
> Projected employment change, 2020-2030: +32.3%
> Amusement and recreation attendants with a bachelor’s degree: 30.9%
[in-text-ad-2]

6. Fast food cooks
> Median annual earnings: $24,380
> Total number of workers: 544,420
> Projected employment change, 2020-2030: -2.1%
> Fast food cooks with a bachelor’s degree: 6.3%

5. Shampooers
> Median annual earnings: $24,190
> Total number of workers: 8,310
> Projected employment change, 2020-2030: +30.6%
> Shampooers with a bachelor’s degree: 21.1%
[in-text-ad]

4. Hosts and hostesses, restaurant, lounge, and coffee shop
> Median annual earnings: $23,880
> Total number of workers: 316,700
> Projected employment change, 2020-2030: +25.2%
> Hosts and hostesses, restaurant, lounge, and coffee shop with a bachelor’s degree: 18.5%

3. Fast food and counter workers
> Median annual earnings: $23,860
> Total number of workers: 3,450,120
> Projected employment change, 2020-2030: +15%
> Fast food and counter workers with a bachelor’s degree: 13.5%

2. Gambling dealers
> Median annual earnings: $23,740
> Total number of workers: 67,330
> Projected employment change, 2020-2030: +24%
> Gambling dealers with a bachelor’s degree: 18.5%
[in-text-ad-2]

1. Waiters and waitresses
> Median annual earnings: $23,740
> Total number of workers: 1,944,240
> Projected employment change, 2020-2030: +20.1%
> Waiters and waitresses with a bachelor’s degree: 16%
Take Charge of Your Retirement In Just A Few Minutes (Sponsor)
Retirement planning doesn’t have to feel overwhelming. The key is finding expert guidance—and SmartAsset’s made it easier than ever for you to connect with a vetted financial advisor.
Here’s how it works:
- Answer a Few Simple Questions. Tell us a bit about your goals and preferences—it only takes a few minutes!
- Get Matched with Vetted Advisors Our smart tool matches you with up to three pre-screened, vetted advisors who serve your area and are held to a fiduciary standard to act in your best interests. Click here to begin
- Choose Your Fit Review their profiles, schedule an introductory call (or meet in person), and select the advisor who feel is right for you.
Why wait? Start building the retirement you’ve always dreamed of. Click here to get started today!
Thank you for reading! Have some feedback for us?
Contact the 24/7 Wall St. editorial team.
 24/7 Wall St.
 24/7 Wall St.
 24/7 Wall St.

