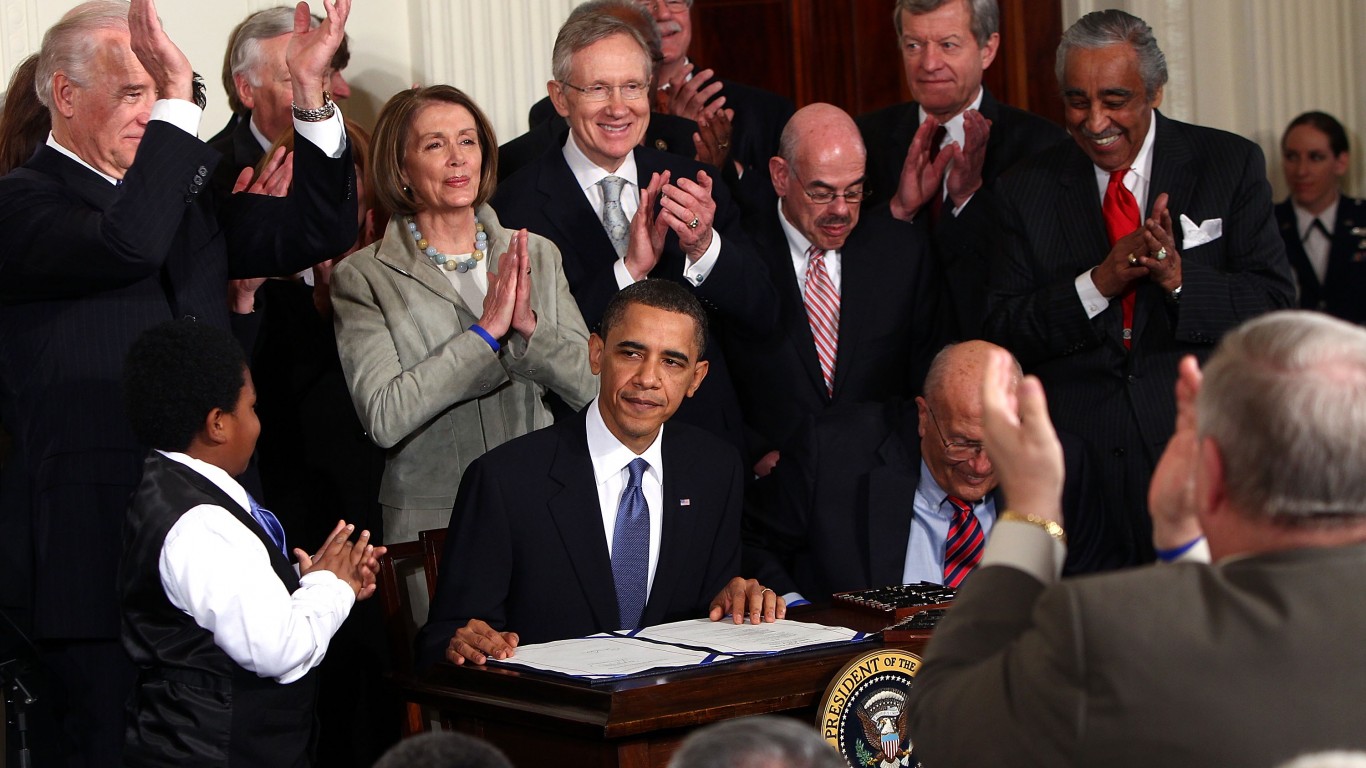
Oil magnate John D. Rockefeller is said to have become America’s first billionaire in 1916. Now, there are 2,755 billionaires in the world, with around 724 in the United States, according to Forbes. And there are predictions that Elon Musk could become the first trillionaire in the near future. (Here are countries with the richest rich people.)
It is no secret that the world’s rich are getting richer. In order to be considered a top one percenter, a U.S. household needs to make around $550,000 annually. This is the minimum. The average income for Americans in the top 1% is nearly $1.7 million, according to IRS data. The top 1%, which comprised 1.85 million U.S. households in 2021, currently hold over $50 trillion in wealth.
To identify the wealth of the top 1% the year you were born, 24/7 Wall St. reviewed the total wealth of the top 1% of households for each year going back to 1976 from Real Time Inequality. which provides statistics on how economic growth is distributed across groups.
An average household in the top 1% in 1976 had $4.3 million in wealth (adjusted for inflation), a figure that increased to $27.3 million per household in 2021.
Total wealth among the 1% has risen from $4.24 trillion in 1976 to $50.55 trillion in 2021. During that time, the share of wealth the 1% captured increased from 23.9% to 38.9%. Meanwhile, according to the same source, the bottom 50% went from owning 0.2% of total wealth in 1976 to having a negative net wealth at -0.1% in 2021 – that’s negative $180.49 billion. (Here are the countries with the worst wealth inequality.)
The total wealth of the 1%, which was rising recently at about $2.5 trillion per year, skyrocketed during the COVID-19 pandemic. Total wealth holdings of the 1% rose a whopping $5.6 trillion from 2020 to 2021 alone – the single highest annual wealth increase over the 45 years reviewed. From 2019 to 2020, wealth of the 1% increased by the second largest amount, at $5.5 trillion, while the third largest annual increase was from 2018 to 2019, at $4.4 trillion.
Click here to see how wealthy was the 1% each year since 1976
Click here to read our detailed methodology
1976
> Total wealth of top 1%: $4.24 trillion
> Avg. wealth per top 1% household: $4,341,739 — #45 most
> 1% wealth share: 23.9% — #45 largest
> Households in 1%: 975,762
> Total households: 97,576,192
[in-text-ad]
1977
> Total wealth of top 1%: $4.37 trillion
> Avg. wealth per top 1% household: $4,356,478 — #44 most
> 1% wealth share: 24.0% — #44 largest
> Households in 1%: 1,002,458
> Total households: 100,245,823
 24/7 Wall St.
1978
> Total wealth of top 1%: $4.45 trillion
> Avg. wealth per top 1% household: $4,338,166 — #46 most
> 1% wealth share: 23.2% — #46 largest
> Households in 1%: 1,026,577
> Total households: 102,657,711

1979
> Total wealth of top 1%: $5.07 trillion
> Avg. wealth per top 1% household: $4,814,074 — #43 most
> 1% wealth share: 24.8% — #43 largest
> Households in 1%: 1,054,010
> Total households: 105,400,965
[in-text-ad-2]

1980
> Total wealth of top 1%: $5.36 trillion
> Avg. wealth per top 1% household: $4,968,722 — #41 most
> 1% wealth share: 24.9% — #42 largest
> Households in 1%: 1,078,702
> Total households: 107,870,214

1981
> Total wealth of top 1%: $5.44 trillion
> Avg. wealth per top 1% household: $4,955,035 — #42 most
> 1% wealth share: 25.2% — #40 largest
> Households in 1%: 1,098,812
> Total households: 109,881,223
[in-text-ad]
1982
> Total wealth of top 1%: $5.73 trillion
> Avg. wealth per top 1% household: $5,113,960 — #40 most
> 1% wealth share: 25.7% — #38 largest
> Households in 1%: 1,121,124
> Total households: 112,112,442
 24/7 Wall St.
1983
> Total wealth of top 1%: $5.91 trillion
> Avg. wealth per top 1% household: $5,187,915 — #39 most
> 1% wealth share: 25.3% — #39 largest
> Households in 1%: 1,139,931
> Total households: 113,993,117

1984
> Total wealth of top 1%: $6.13 trillion
> Avg. wealth per top 1% household: $5,279,329 — #38 most
> 1% wealth share: 25.0% — #41 largest
> Households in 1%: 1,161,110
> Total households: 116,111,031
[in-text-ad-2]
1985
> Total wealth of top 1%: $6.98 trillion
> Avg. wealth per top 1% household: $5,880,821 — #37 most
> 1% wealth share: 25.9% — #37 largest
> Households in 1%: 1,186,328
> Total households: 118,632,757
1986
> Total wealth of top 1%: $7.77 trillion
> Avg. wealth per top 1% household: $6,413,697 — #36 most
> 1% wealth share: 26.5% — #36 largest
> Households in 1%: 1,210,974
> Total households: 121,097,418
[in-text-ad]
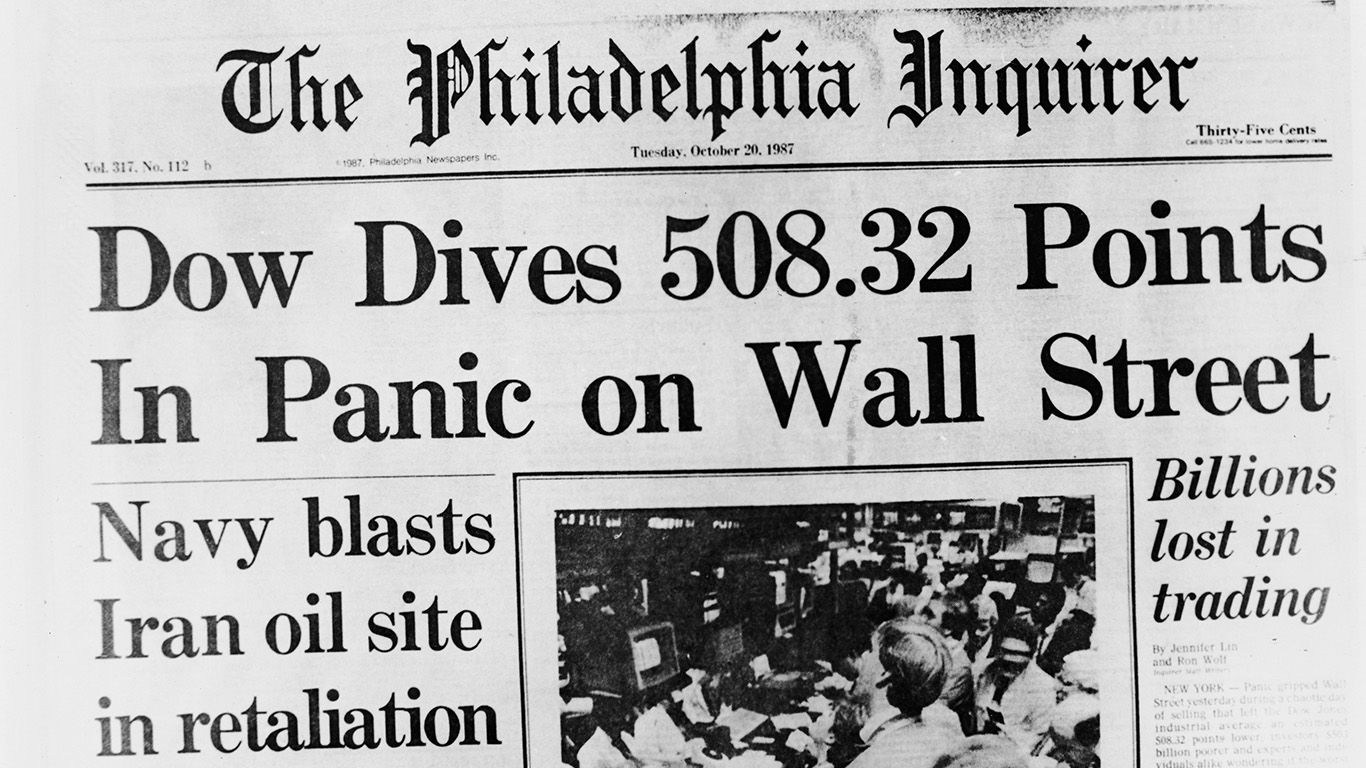
1987
> Total wealth of top 1%: $8.48 trillion
> Avg. wealth per top 1% household: $6,905,500 — #35 most
> 1% wealth share: 27.8% — #35 largest
> Households in 1%: 1,228,192
> Total households: 122,819,155

1988
> Total wealth of top 1%: $9.69 trillion
> Avg. wealth per top 1% household: $7,783,822 — #33 most
> 1% wealth share: 30.0% — #31 largest
> Households in 1%: 1,245,128
> Total households: 124,512,801

1989
> Total wealth of top 1%: $10.23 trillion
> Avg. wealth per top 1% household: $8,088,704 — #31 most
> 1% wealth share: 29.9% — #33 largest
> Households in 1%: 1,264,691
> Total households: 126,469,133
[in-text-ad-2]

1990
> Total wealth of top 1%: $10.00 trillion
> Avg. wealth per top 1% household: $7,769,605 — #34 most
> 1% wealth share: 30.0% — #32 largest
> Households in 1%: 1,286,672
> Total households: 128,667,214
1991
> Total wealth of top 1%: $10.43 trillion
> Avg. wealth per top 1% household: $7,953,154 — #32 most
> 1% wealth share: 29.8% — #34 largest
> Households in 1%: 1,311,197
> Total households: 131,119,748
[in-text-ad]

1992
> Total wealth of top 1%: $10.97 trillion
> Avg. wealth per top 1% household: $8,249,717 — #30 most
> 1% wealth share: 30.8% — #29 largest
> Households in 1%: 1,330,334
> Total households: 133,033,397

1993
> Total wealth of top 1%: $11.41 trillion
> Avg. wealth per top 1% household: $8,461,595 — #28 most
> 1% wealth share: 30.8% — #27 largest
> Households in 1%: 1,348,562
> Total households: 134,856,165

1994
> Total wealth of top 1%: $11.40 trillion
> Avg. wealth per top 1% household: $8,352,477 — #29 most
> 1% wealth share: 30.5% — #30 largest
> Households in 1%: 1,365,296
> Total households: 136,529,609
[in-text-ad-2]

1995
> Total wealth of top 1%: $12.48 trillion
> Avg. wealth per top 1% household: $8,987,675 — #27 most
> 1% wealth share: 30.8% — #28 largest
> Households in 1%: 1,388,871
> Total households: 138,887,101
1996
> Total wealth of top 1%: $13.44 trillion
> Avg. wealth per top 1% household: $9,536,662 — #26 most
> 1% wealth share: 31.3% — #26 largest
> Households in 1%: 1,409,086
> Total households: 140,908,588
[in-text-ad]

1997
> Total wealth of top 1%: $15.55 trillion
> Avg. wealth per top 1% household: $10,880,460 — #25 most
> 1% wealth share: 32.8% — #25 largest
> Households in 1%: 1,429,299
> Total households: 142,929,905

1998
> Total wealth of top 1%: $17.72 trillion
> Avg. wealth per top 1% household: $12,194,748 — #23 most
> 1% wealth share: 33.6% — #21 largest
> Households in 1%: 1,453,187
> Total households: 145,318,673

1999
> Total wealth of top 1%: $19.69 trillion
> Avg. wealth per top 1% household: $13,344,488 — #18 most
> 1% wealth share: 34.1% — #18 largest
> Households in 1%: 1,475,321
> Total households: 147,532,062
[in-text-ad-2]

2000
> Total wealth of top 1%: $19.40 trillion
> Avg. wealth per top 1% household: $13,037,136 — #21 most
> 1% wealth share: 34.0% — #19 largest
> Households in 1%: 1,487,932
> Total households: 148,793,232

2001
> Total wealth of top 1%: $19.29 trillion
> Avg. wealth per top 1% household: $12,798,577 — #22 most
> 1% wealth share: 33.7% — #20 largest
> Households in 1%: 1,507,058
> Total households: 150,705,811
[in-text-ad]

2002
> Total wealth of top 1%: $18.08 trillion
> Avg. wealth per top 1% household: $11,850,778 — #24 most
> 1% wealth share: 33.0% — #24 largest
> Households in 1%: 1,525,519
> Total households: 152,551,896

2003
> Total wealth of top 1%: $20.36 trillion
> Avg. wealth per top 1% household: $13,202,459 — #19 most
> 1% wealth share: 33.5% — #23 largest
> Households in 1%: 1,542,490
> Total households: 154,248,993

2004
> Total wealth of top 1%: $22.78 trillion
> Avg. wealth per top 1% household: $14,542,266 — #14 most
> 1% wealth share: 33.6% — #22 largest
> Households in 1%: 1,566,553
> Total households: 156,655,305
[in-text-ad-2]
2005
> Total wealth of top 1%: $24.89 trillion
> Avg. wealth per top 1% household: $15,685,322 — #12 most
> 1% wealth share: 34.5% — #17 largest
> Households in 1%: 1,586,738
> Total households: 158,673,826

2006
> Total wealth of top 1%: $26.65 trillion
> Avg. wealth per top 1% household: $16,580,473 — #10 most
> 1% wealth share: 35.3% — #15 largest
> Households in 1%: 1,607,452
> Total households: 160,745,154
[in-text-ad]
2007
> Total wealth of top 1%: $27.06 trillion
> Avg. wealth per top 1% household: $16,582,944 — #9 most
> 1% wealth share: 35.9% — #14 largest
> Households in 1%: 1,631,913
> Total households: 163,191,262
 24/7 Wall St.
2008
> Total wealth of top 1%: $22.11 trillion
> Avg. wealth per top 1% household: $13,418,076 — #17 most
> 1% wealth share: 36.1% — #13 largest
> Households in 1%: 1,647,833
> Total households: 164,783,258
2009
> Total wealth of top 1%: $22.01 trillion
> Avg. wealth per top 1% household: $13,157,120 — #20 most
> 1% wealth share: 35.3% — #16 largest
> Households in 1%: 1,672,911
> Total households: 167,291,088
[in-text-ad-2]
2010
> Total wealth of top 1%: $24.31 trillion
> Avg. wealth per top 1% household: $14,362,495 — #15 most
> 1% wealth share: 36.9% — #12 largest
> Households in 1%: 1,692,397
> Total households: 169,239,701

2011
> Total wealth of top 1%: $24.48 trillion
> Avg. wealth per top 1% household: $14,227,079 — #16 most
> 1% wealth share: 37.6% — #9 largest
> Households in 1%: 1,720,404
> Total households: 172,040,403
[in-text-ad]
2012
> Total wealth of top 1%: $27.05 trillion
> Avg. wealth per top 1% household: $15,593,715 — #13 most
> 1% wealth share: 39.0% — #1 largest
> Households in 1%: 1,734,800
> Total households: 173,480,024
 24/7 Wall St.
2013
> Total wealth of top 1%: $28.98 trillion
> Avg. wealth per top 1% household: $16,455,764 — #11 most
> 1% wealth share: 37.7% — #8 largest
> Households in 1%: 1,761,081
> Total households: 176,108,055

2014
> Total wealth of top 1%: $31.42 trillion
> Avg. wealth per top 1% household: $17,654,790 — #8 most
> 1% wealth share: 38.3% — #3 largest
> Households in 1%: 1,779,890
> Total households: 177,988,996
[in-text-ad-2]

2015
> Total wealth of top 1%: $32.04 trillion
> Avg. wealth per top 1% household: $17,686,730 — #7 most
> 1% wealth share: 38.1% — #5 largest
> Households in 1%: 1,811,474
> Total households: 181,147,354

2016
> Total wealth of top 1%: $33.32 trillion
> Avg. wealth per top 1% household: $18,429,019 — #6 most
> 1% wealth share: 37.9% — #6 largest
> Households in 1%: 1,808,243
> Total households: 180,824,317
[in-text-ad]

2017
> Total wealth of top 1%: $36.22 trillion
> Avg. wealth per top 1% household: $19,907,512 — #4 most
> 1% wealth share: 37.9% — #7 largest
> Households in 1%: 1,819,475
> Total households: 181,947,484
 24/7 Wall St.
2018
> Total wealth of top 1%: $35.09 trillion
> Avg. wealth per top 1% household: $19,157,304 — #5 most
> 1% wealth share: 37.5% — #11 largest
> Households in 1%: 1,831,577
> Total households: 183,157,723
2019
> Total wealth of top 1%: $39.50 trillion
> Avg. wealth per top 1% household: $21,478,657 — #3 most
> 1% wealth share: 37.6% — #10 largest
> Households in 1%: 1,838,967
> Total households: 183,896,734
[in-text-ad-2]

2020
> Total wealth of top 1%: $44.99 trillion
> Avg. wealth per top 1% household: $24,345,278 — #2 most
> 1% wealth share: 38.2% — #4 largest
> Households in 1%: 1,848,066
> Total households: 184,806,570

2021
> Total wealth of top 1%: $50.55 trillion
> Avg. wealth per top 1% household: $27,271,088 — #1 most
> 1% wealth share: 38.9% — #2 largest
> Households in 1%: 1,853,587
> Total households: 185,358,697
Methodology
To identify the wealth of the top 1% the year you were born, 24/7 Wall St. reviewed the total wealth of the top 1% of households for each year going back to 1976 from RealTime Inequality, which provides statistics on how economic growth is distributed across groups with research conducted by economists Thomas Blanchet, Emmanuel Saez, Gabriel Zucman.
All dollar figures are annualized and adjusted for price inflation to 2021 dollars. The average wealth per household, the population, and the 1% wealth share are also from RealTime Inequality, and all data is for the fourth quarter of each year. RealTime Inequality wealth definition includes all marketable wealth owned by households.
100 Million Americans Are Missing This Crucial Retirement Tool
The thought of burdening your family with a financial disaster is most Americans’ nightmare. However, recent studies show that over 100 million Americans still don’t have proper life insurance in the event they pass away.
Life insurance can bring peace of mind – ensuring your loved ones are safeguarded against unforeseen expenses and debts. With premiums often lower than expected and a variety of plans tailored to different life stages and health conditions, securing a policy is more accessible than ever.
A quick, no-obligation quote can provide valuable insight into what’s available and what might best suit your family’s needs. Life insurance is a simple step you can take today to help secure peace of mind for your loved ones tomorrow.
Click here to learn how to get a quote in just a few minutes.
Thank you for reading! Have some feedback for us?
Contact the 24/7 Wall St. editorial team.
Latest from 24/7