
The ForbesAvenue Bridge in Pittsburgh collapsed hours before President Joe Biden was to arrive in the city to make a speech about the need to upgrade America’s infrastructure. Like everything else, conditions of bridges, roads, and highways vary from state to state, and the state with the best highways in America is North Dakota.
Biden’s bipartisan infrastructure bill (Infrastructure Investment and Jobs Act) is his first move to begin the rebuilding of the nation’s infrastructure. The $1.2 trillion infrastructure legislation includes plans to address the fact that 1 in every 5 miles of highway in the country and 45,000 bridges are in poor condition. (These are the states with the most structurally deficient bridges.)
The investment, however, may not be enough. The American Society of Civil Engineers estimates the cost to upgrade the national infrastructure at $2.6 trillion over the next 10 years.
The quality of infrastructure, particularly roads, has varied from state to state, and so is their current state. One reason for this is that states have their own budgets to repair parts of their highway systems.
One of the most complete studies of America’s road repairs challenges is the Reason Foundation’s Annual Highway Report. The 26th annual edition of the report was released recently.
The report looks at state-controlled mileage, including the state highway systems, toll roads, some ferry services, and smaller systems serving universities and state-owned properties. Mileage also includes the Interstate System, the National Highway System, and most federal-aid system roads.
In all, the report uses 13 yardsticks for its overall highway performance rankings, 2019. These include state financial disbursements for roads and bridges, disbursements for maintenance, analysis of both urban and rural roads, pavement condition, and structurally deficient bridges.
24/7 Wall St. reviewed the report to find the 25 states with the best highways. We included several measures from the report: annual peak hours spent in congestion per commuter, percent of bridges that are structurally deficient, and roadways fatality rate per 100 million vehicle miles.
The states that top the list are North Dakota, followed by Virginia, Missouri, Kentucky, and North Carolina. On the flip side, this state has the worst highways in America.
One of the report’s authors, Baruch Feigenbaum, told Route Fifty that “States need to ensure their highway spending produces safer roads, smoother pavement, fewer deficient bridges, and less traffic congestion. The states with the best overall rankings maintain better-than-average highways with relatively efficient spending per mile.”
Click here to see the state that has the best highways in America

25. Oregon
> Annual peak hours spent in congestion: 17.01 per commuter (15th worst)
> Pct. of bridges that are structurally deficient: 1.37% (11th highest)
> Roadways fatality rate: 5.19 per 100 million vehicle miles (16th lowest)
[in-text-ad]
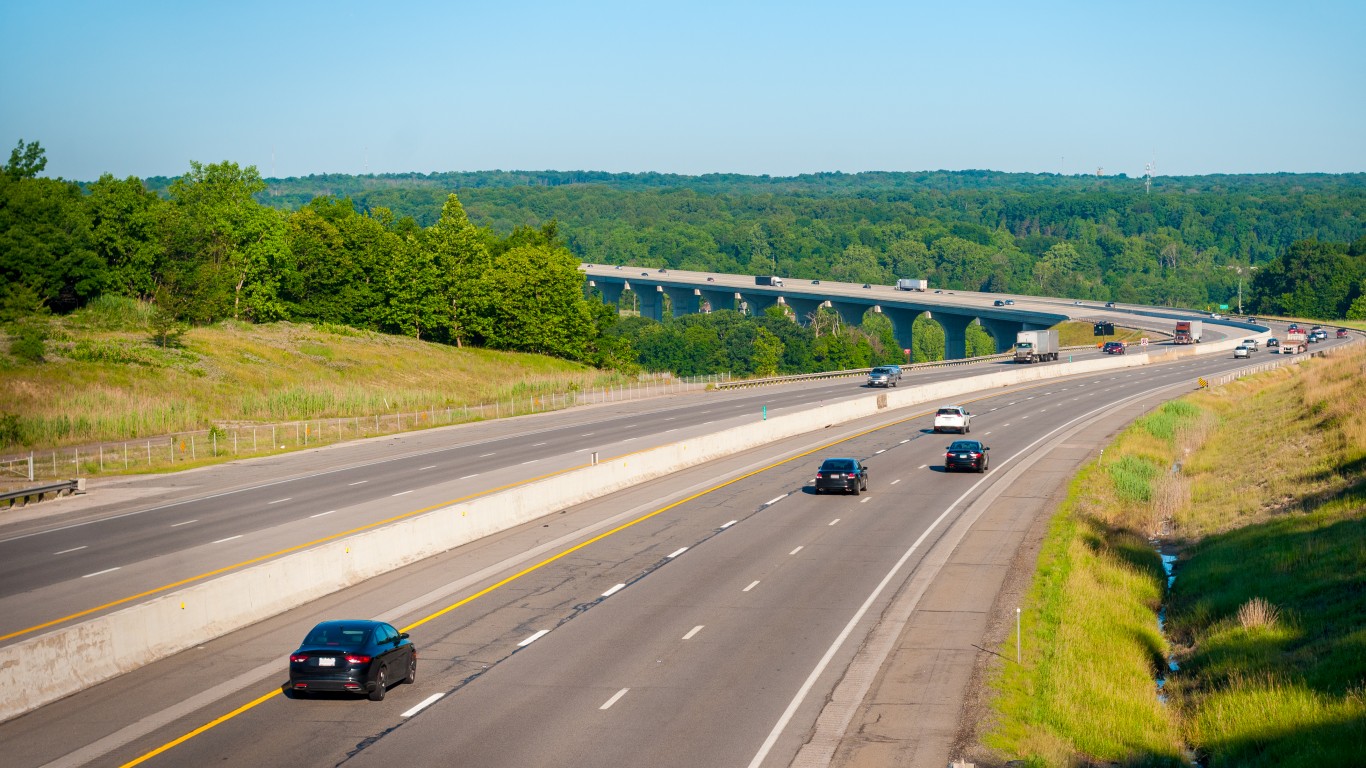
24. Ohio
> Annual peak hours spent in congestion: 5.68 per commuter (11th best)
> Pct. of bridges that are structurally deficient: 1.01% (19th lowest)
> Roadways fatality rate: 5.36 per 100 million vehicle miles (19th lowest)

23. South Carolina
> Annual peak hours spent in congestion: 8.45 per commuter (25th worst)
> Pct. of bridges that are structurally deficient: 1.73% (the highest)
> Roadways fatality rate: 8.44 per 100 million vehicle miles (20th highest)
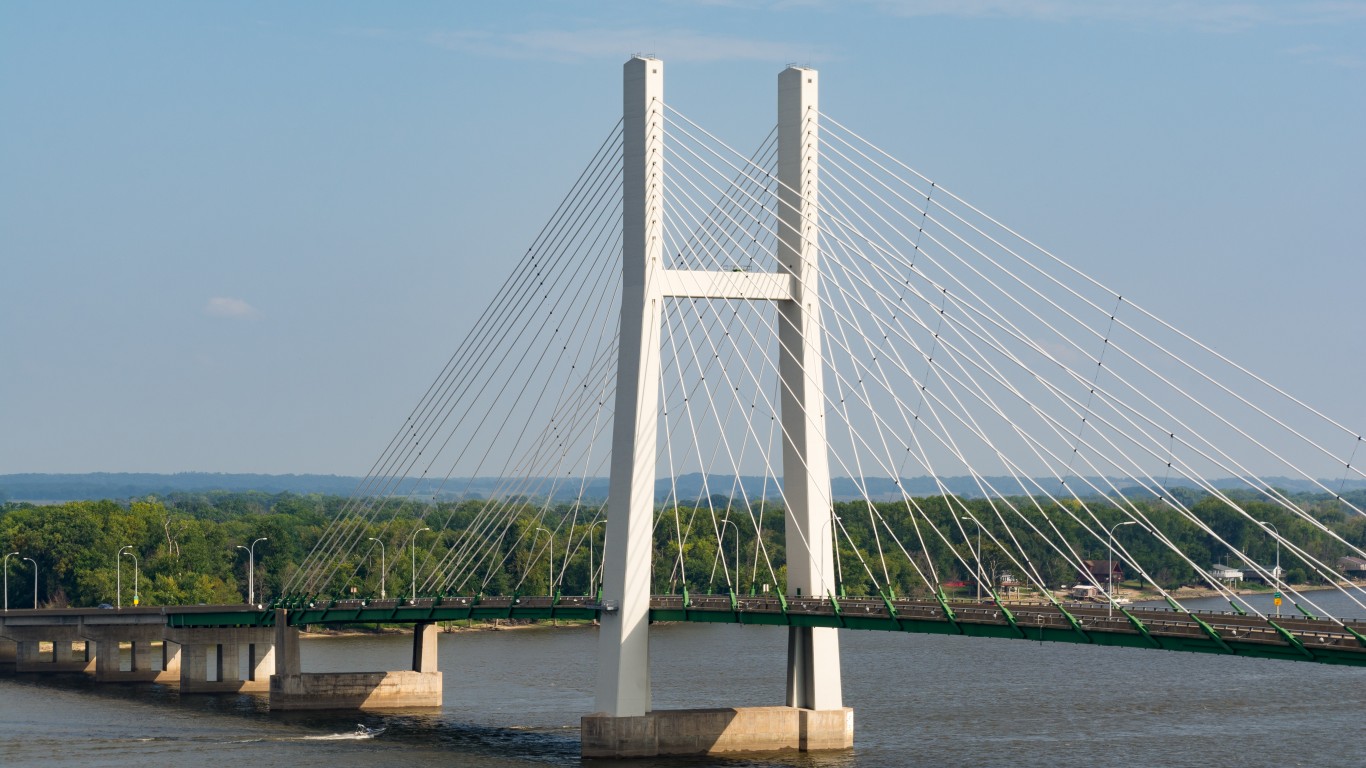
22. Iowa
> Annual peak hours spent in congestion: 7.69 per commuter (22nd best)
> Pct. of bridges that are structurally deficient: 1.00% (18th lowest)
> Roadways fatality rate: 19.03 per 100 million vehicle miles (3rd highest)
[in-text-ad-2]

21. Nebraska
> Annual peak hours spent in congestion: 2.88 per commuter (2nd best)
> Pct. of bridges that are structurally deficient: 1.17% (20th highest)
> Roadways fatality rate: 8.84 per 100 million vehicle miles (16th highest)

20. Nevada
> Annual peak hours spent in congestion: 7.28 per commuter (21st best)
> Pct. of bridges that are structurally deficient: 1.06% (23rd lowest)
> Roadways fatality rate: 1.28 per 100 million vehicle miles (the lowest)
[in-text-ad]
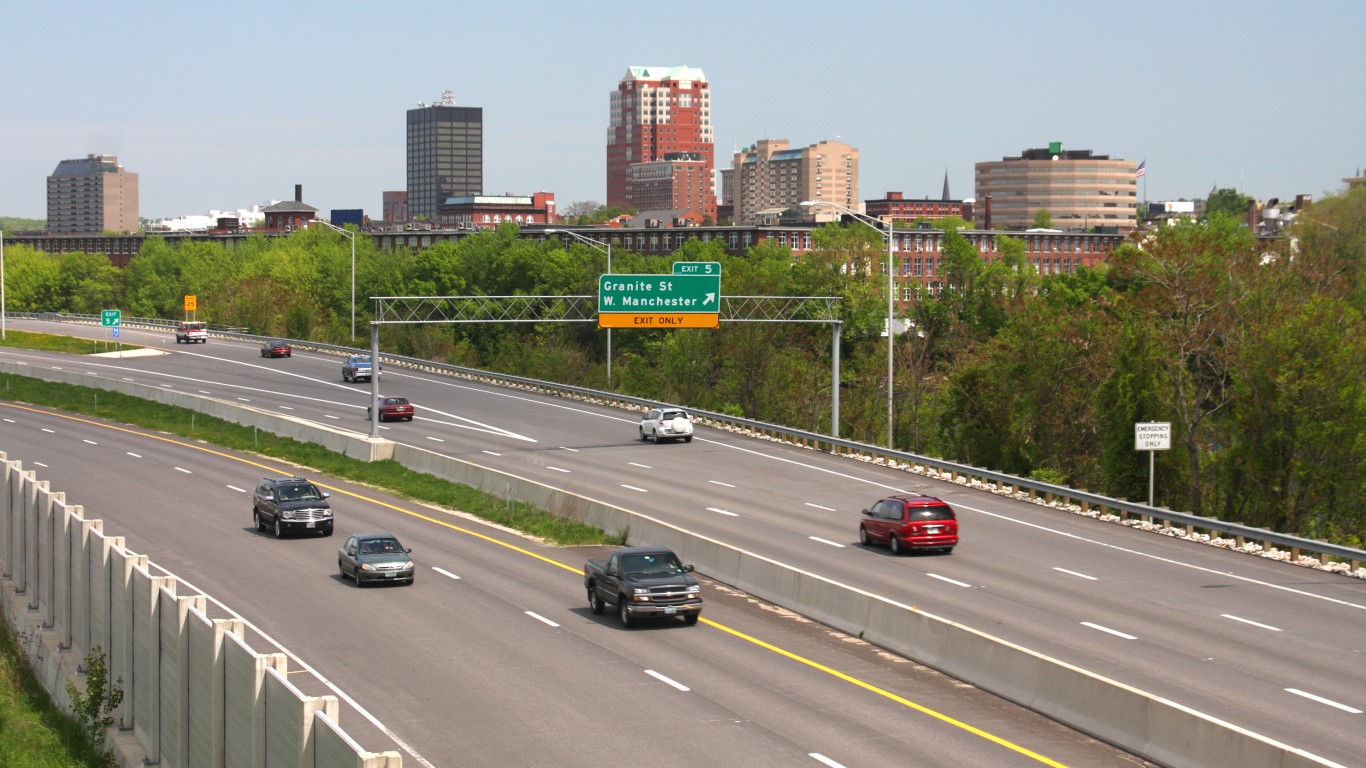
19. New Hampshire
> Annual peak hours spent in congestion: 8.10 per commuter (24th best)
> Pct. of bridges that are structurally deficient: 0.73% (5th lowest)
> Roadways fatality rate: 8.51 per 100 million vehicle miles (19th highest)

18. Minnesota
> Annual peak hours spent in congestion: 8.67 per commuter (23rd worst)
> Pct. of bridges that are structurally deficient: 0.60% (2nd lowest)
> Roadways fatality rate: 4.73 per 100 million vehicle miles (13th lowest)

17. Arkansas
> Annual peak hours spent in congestion: 5.16 per commuter (5th best)
> Pct. of bridges that are structurally deficient: 1.36% (14th highest)
> Roadways fatality rate: 4.85 per 100 million vehicle miles (14th lowest)
[in-text-ad-2]

16. Texas
> Annual peak hours spent in congestion: 23.42 per commuter (11th worst)
> Pct. of bridges that are structurally deficient: 1.25% (18th highest)
> Roadways fatality rate: 1.33 per 100 million vehicle miles (2nd lowest)
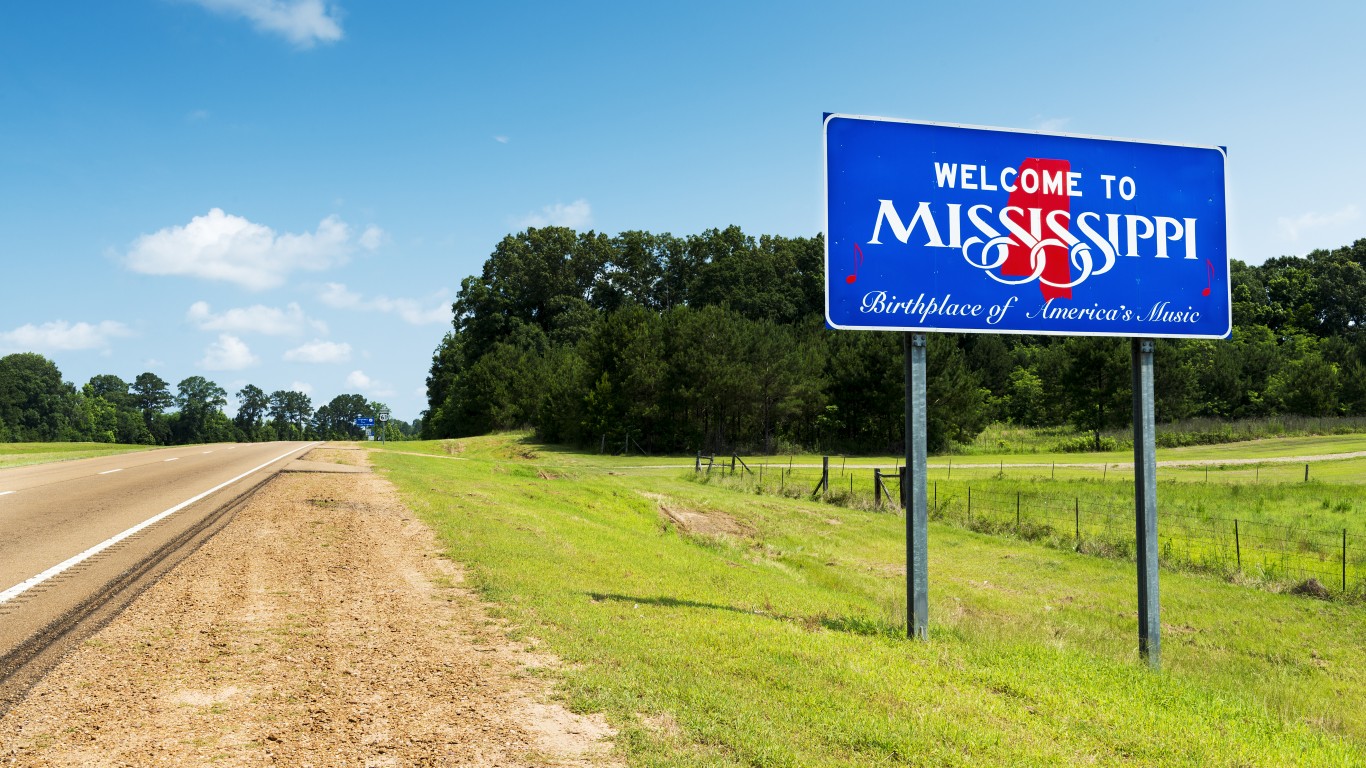
15. Mississippi
> Annual peak hours spent in congestion: 5.91 per commuter (13th best)
> Pct. of bridges that are structurally deficient: 1.56% (2nd highest)
> Roadways fatality rate: 8.72 per 100 million vehicle miles (18th highest)
[in-text-ad]

14. Georgia
> Annual peak hours spent in congestion: 14.75 per commuter (17th worst)
> Pct. of bridges that are structurally deficient: 1.12% (22nd highest)
> Roadways fatality rate: 2.95 per 100 million vehicle miles (7th lowest)
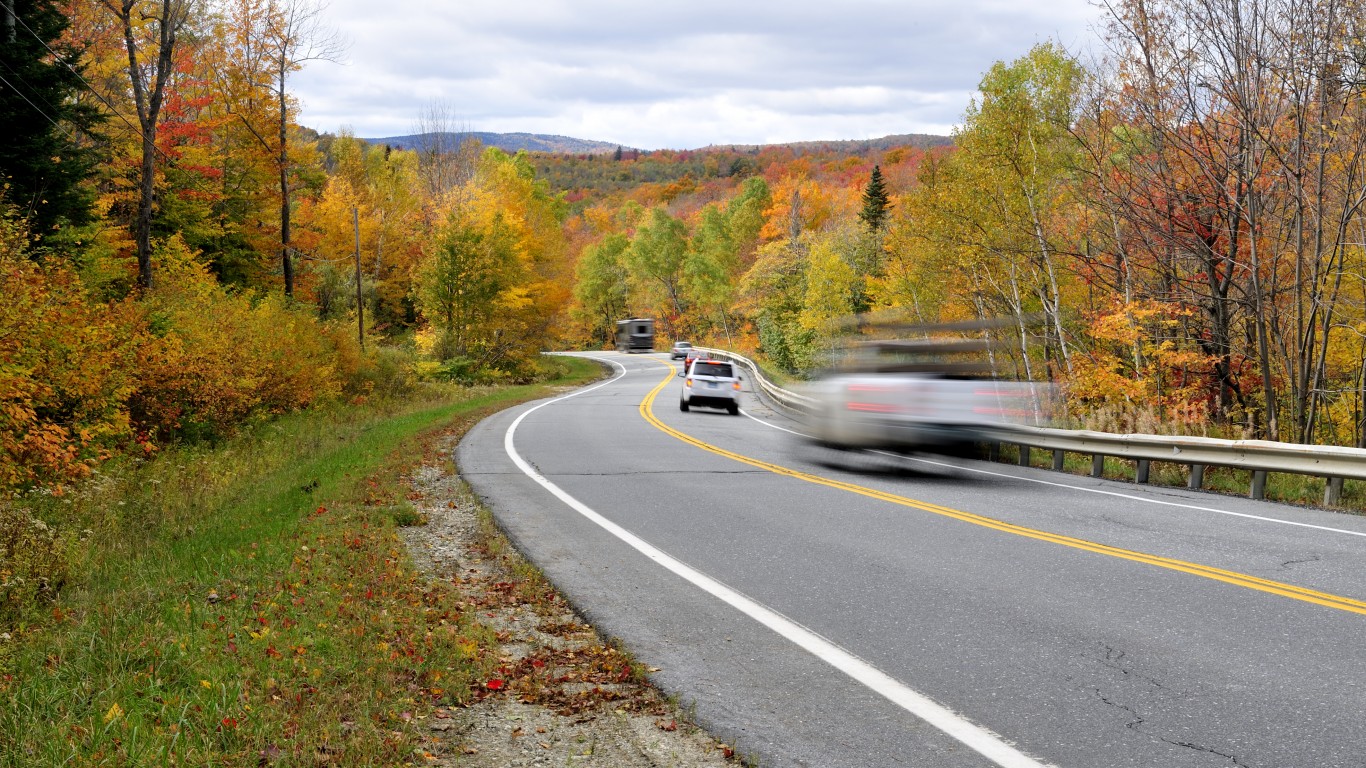
13. Vermont
> Annual peak hours spent in congestion: 6.23 per commuter (14th best)
> Pct. of bridges that are structurally deficient: 0.64% (3rd lowest)
> Roadways fatality rate: 2.41 per 100 million vehicle miles (5th lowest)
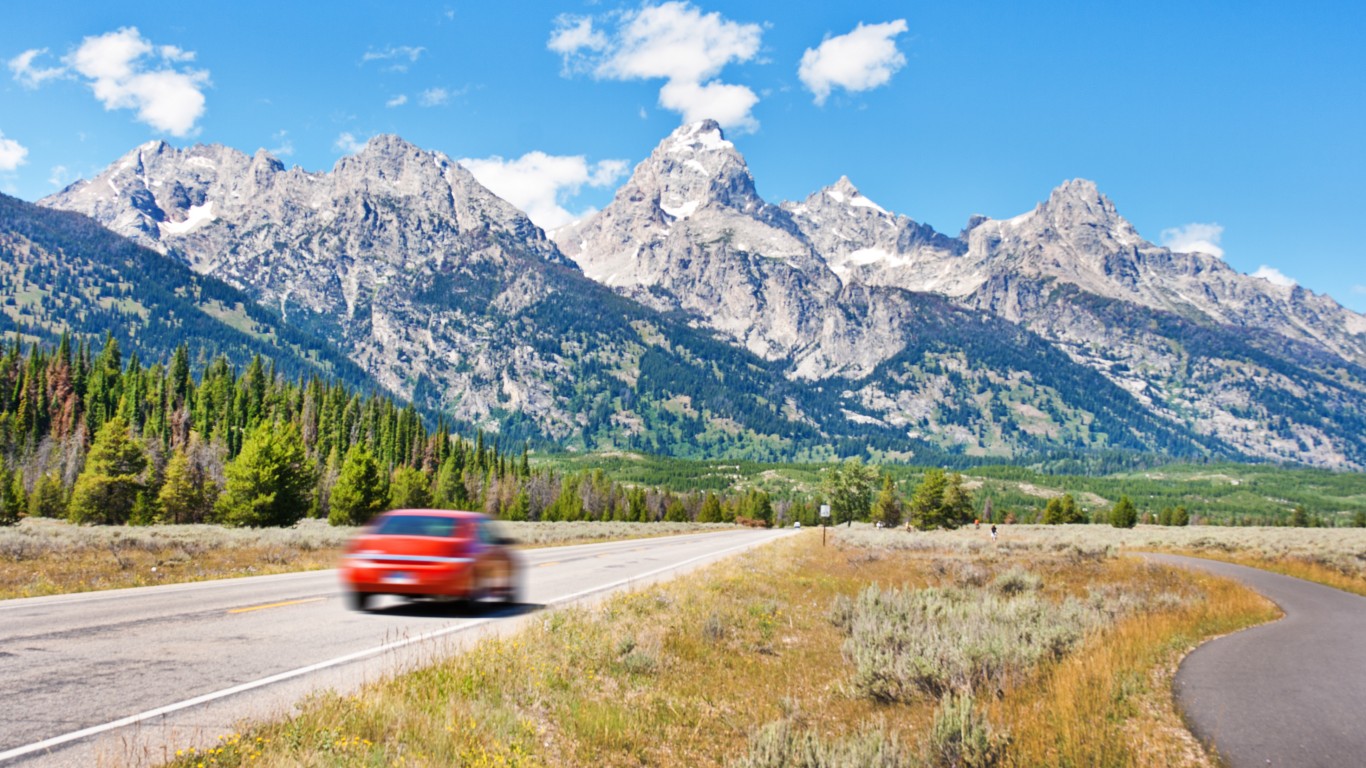
12. Wyoming
> Annual peak hours spent in congestion: 4.53 per commuter (3rd best)
> Pct. of bridges that are structurally deficient: 1.44% (5th highest)
> Roadways fatality rate: 6.90 per 100 million vehicle miles (24th lowest)
[in-text-ad-2]
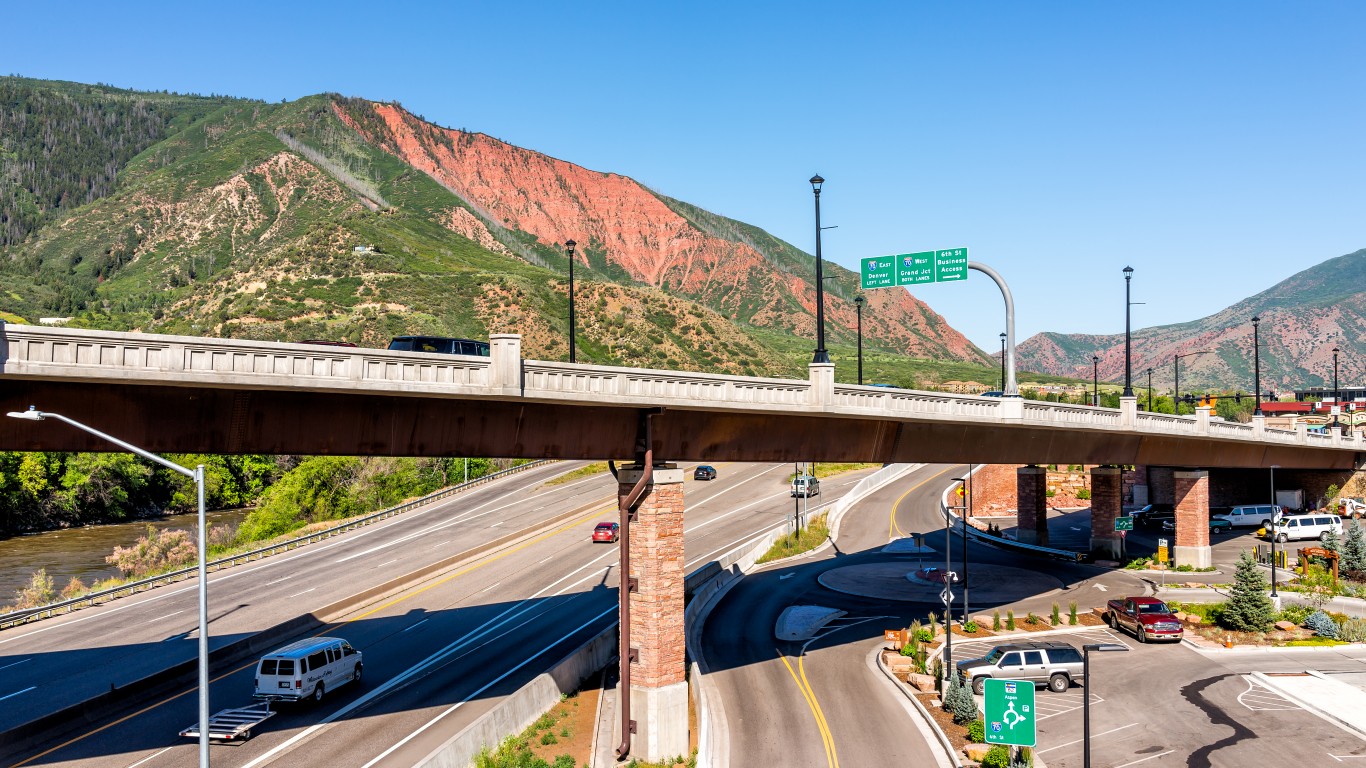
11. Montana
> Annual peak hours spent in congestion: 4.90 per commuter (4th best)
> Pct. of bridges that are structurally deficient: 1.43% (6th highest)
> Roadways fatality rate: 7.20 per 100 million vehicle miles (24th highest)

10. Tennessee
> Annual peak hours spent in congestion: 6.76 per commuter (19th best)
> Pct. of bridges that are structurally deficient: 1.37% (12th highest)
> Roadways fatality rate: 4.39 per 100 million vehicle miles (11th lowest)
[in-text-ad]
9. South Dakota
> Annual peak hours spent in congestion: 5.83 per commuter (12th best)
> Pct. of bridges that are structurally deficient: 1.03% (21st lowest)
> Roadways fatality rate: 17.02 per 100 million vehicle miles (4th highest)

8. Idaho
> Annual peak hours spent in congestion: 6.43 per commuter (16th best)
> Pct. of bridges that are structurally deficient: 1.24% (19th highest)
> Roadways fatality rate: 6.57 per 100 million vehicle miles (23rd lowest)
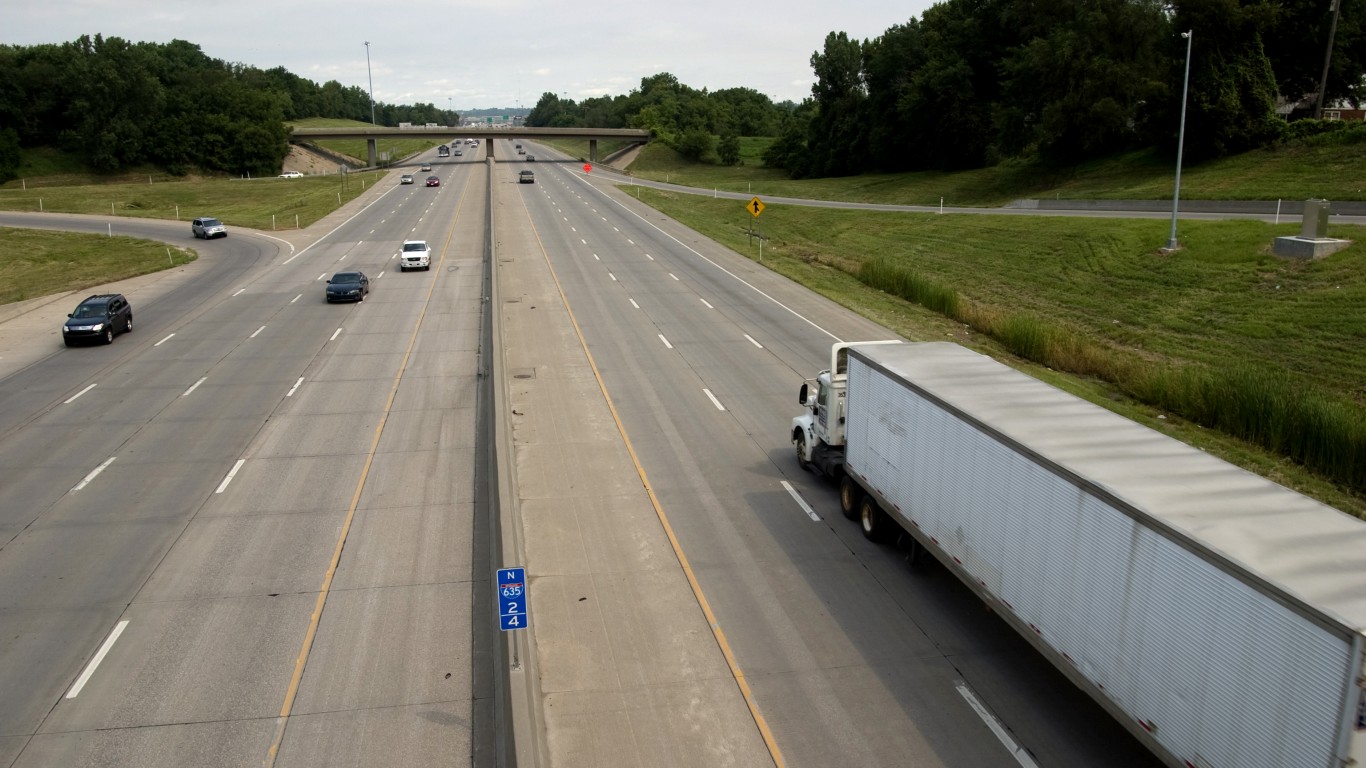
7. Kansas
> Annual peak hours spent in congestion: 8.42 per commuter (25th best)
> Pct. of bridges that are structurally deficient: 1.29% (17th highest)
> Roadways fatality rate: 5.13 per 100 million vehicle miles (17th lowest)
[in-text-ad-2]
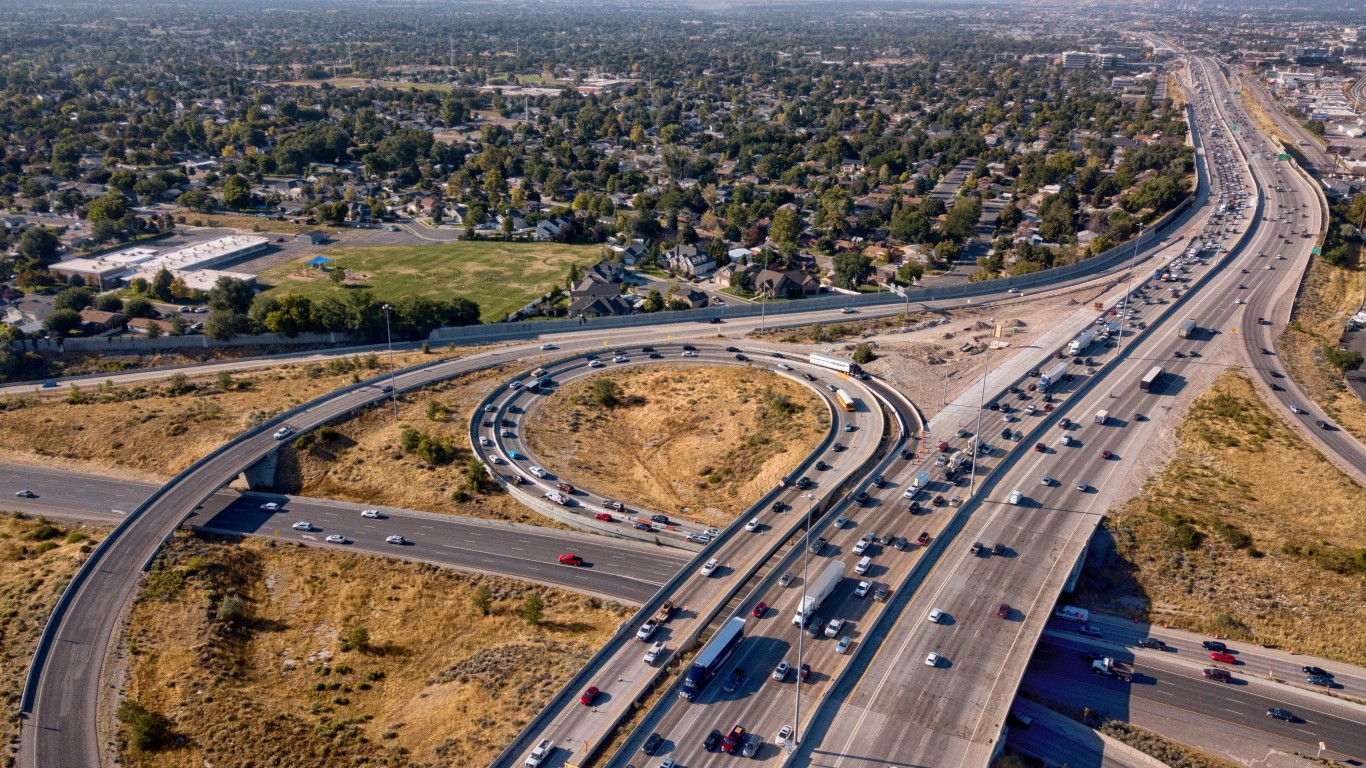
6. Utah
> Annual peak hours spent in congestion: 1.75 per commuter (the best)
> Pct. of bridges that are structurally deficient: 0.75% (6th lowest)
> Roadways fatality rate: 2.15 per 100 million vehicle miles (4th lowest)

5. North Carolina
> Annual peak hours spent in congestion: 10.74 per commuter (22nd worst)
> Pct. of bridges that are structurally deficient: 1.12% (23rd highest)
> Roadways fatality rate: 9.31 per 100 million vehicle miles (12th highest)
[in-text-ad]
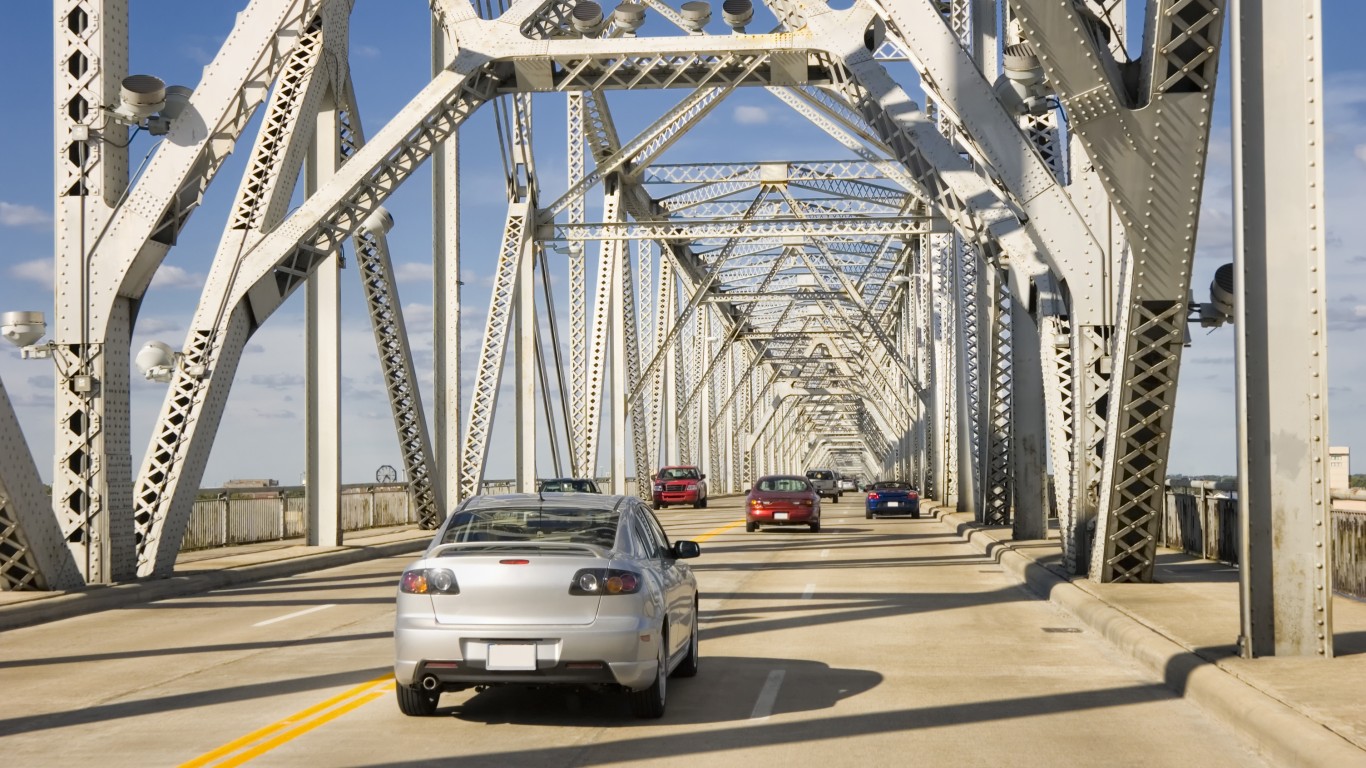
4. Kentucky
> Annual peak hours spent in congestion: 7.91 per commuter (23rd best)
> Pct. of bridges that are structurally deficient: 1.48% (4th highest)
> Roadways fatality rate: 7.24 per 100 million vehicle miles (22nd highest)

3. Missouri
> Annual peak hours spent in congestion: 5.60 per commuter (9th best)
> Pct. of bridges that are structurally deficient: 1.11% (24th highest)
> Roadways fatality rate: 8.77 per 100 million vehicle miles (17th highest)

2. Virginia
> Annual peak hours spent in congestion: 8.46 per commuter (24th worst)
> Pct. of bridges that are structurally deficient: 0.97% (15th lowest)
> Roadways fatality rate: 4.36 per 100 million vehicle miles (10th lowest)
[in-text-ad-2]
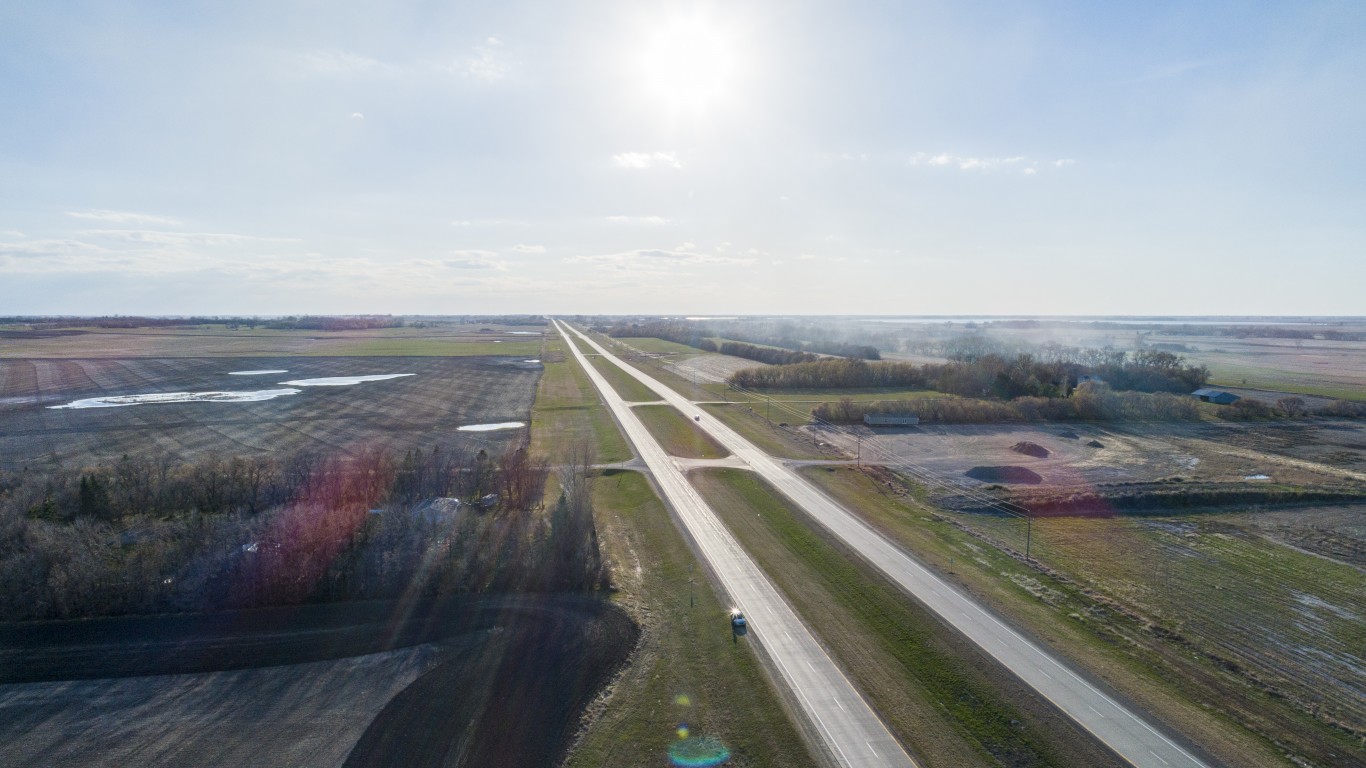
1. North Dakota
> Annual peak hours spent in congestion: 6.60 per commuter (17th best)
> Pct. of bridges that are structurally deficient: 1.02% (20th lowest)
> Roadways fatality rate: 10.67 per 100 million vehicle miles (9th highest)
In 20 Years, I Haven’t Seen A Cash Back Card This Good
After two decades of reviewing financial products I haven’t seen anything like this. Credit card companies are at war, handing out free rewards and benefits to win the best customers.
A good cash back card can be worth thousands of dollars a year in free money, not to mention other perks like travel, insurance, and access to fancy lounges.
Our top pick today pays up to 5% cash back, a $200 bonus on top, and $0 annual fee. Click here to apply before they stop offering rewards this generous.
Flywheel Publishing has partnered with CardRatings for our coverage of credit card products. Flywheel Publishing and CardRatings may receive a commission from card issuers.
Thank you for reading! Have some feedback for us?
Contact the 24/7 Wall St. editorial team.
 24/7 Wall St.
 24/7 Wall St.