
Americans, and indeed the world, have grappled with COVID-19 for two years now. From the first confirmed case in the U.S. in January 2020 through the beginning of 2022, the country has seen infection and death rates soar and plummet, as new variants have emerged and dissipated.
Every corner of the country has had to contend with some level of community spread, though not all communities have been equally hard-hit by the virus, or at the same time. Some major metro areas reported high case counts early in 2020, while others reported huge spikes within the last month.
To determine the worst week of the pandemic in America’s largest cities, 24/7 Wall St. reviewed average weekly COVID-19 cases and deaths per 100,000 people for the 50 most populous metropolitan areas, sourced from various local, state, and national health departments. Population data came from the U.S. Census Bureau.
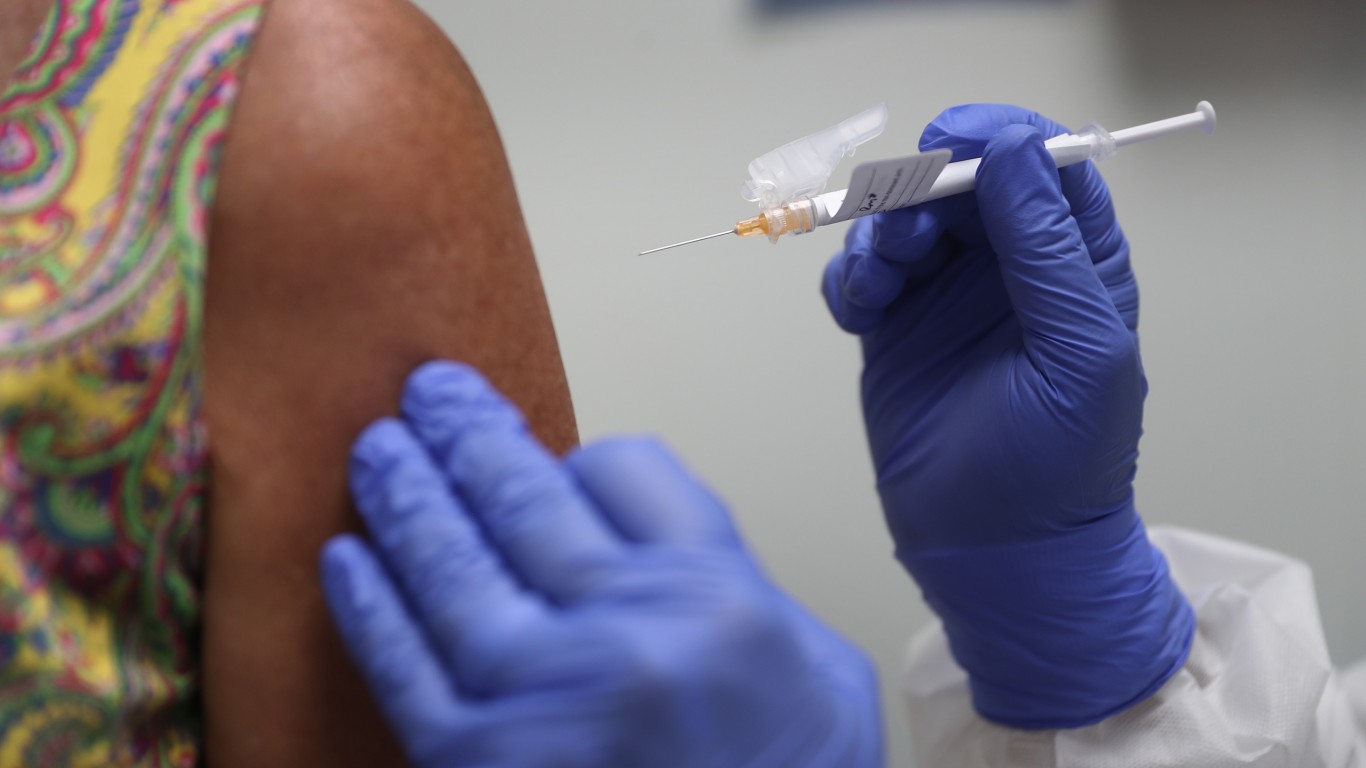
Nearly every major metro area’s highest recorded weekly average case rate occurred in January of 2022, when the omicron variant surged through the U.S. According to multiple studies, the variant appeared to be more transmissible than past iterations of the virus but less lethal. In the vast majority of major U.S. metro areas, the highest rates of COVID-19 deaths were recorded well before omicron emerged, but also often before vaccines were widely available. These are the states where the most people are vaccinated.
COVID-19 rates have been falling as of early February 2022, as the omicron variant outbreak appears to be subsiding. Yet health authorities are still encouraging caution. The Centers for Disease Control and Prevention recommends that those two years and older should wear masks indoors. But the best way to slow the spread of COVID-19 is to get vaccinated. The vaccines are “highly effective at preventing severe illness, hospitalizations, and death,” per the CDC. (These are nations fighting outbreaks of diseases other than COVID.)
Click here to see the worst days of the pandemic in America’s biggest cities

Birmingham-Hoover, AL
> Peak week for infections: Week ending Jan. 25, 2022 (4,981 infections per 100,000)
> Peak week for COVID-19 deaths: Week ending Jan. 13, 2021 (34.7 infections per 100,000)
> Current weekly case rate: 2,272 infections per 100,000
> Current weekly death rate: 8.1 deaths per 100,000
> Total cases: 6,208
> Total deaths: 96
> Population: 1,085,330
[in-text-ad]

Buffalo-Cheektowaga, NY
> Peak week for infections: Week ending Jan. 11, 2022 (3,170 infections per 100,000)
> Peak week for COVID-19 deaths: Week ending May 13, 2020 (23.0 infections per 100,000)
> Current weekly case rate: 965 infections per 100,000
> Current weekly death rate: 11.7 deaths per 100,000
> Total cases: 202,405
> Total deaths: 2,503
> Population: 1,130,175

Salt Lake City, UT
> Peak week for infections: Week ending Jan. 26, 2022 (5,476 infections per 100,000)
> Peak week for COVID-19 deaths: Week ending Jan. 13, 2022 (8.4 infections per 100,000)
> Current weekly case rate: 2,409 infections per 100,000
> Current weekly death rate: 4.4 deaths per 100,000
> Total cases: 330,201
> Total deaths: 1,464
> Population: 1,201,043

Hartford-East Hartford-Middletown, CT
> Peak week for infections: Week ending Jan. 12, 2022 (2,996 infections per 100,000)
> Peak week for COVID-19 deaths: Week ending Apr. 26, 2020 (45.9 infections per 100,000)
> Current weekly case rate: 1,132 infections per 100,000
> Current weekly death rate: 11.0 deaths per 100,000
> Total cases: 170,896
> Total deaths: 2,919
> Population: 1,207,677
[in-text-ad-2]

Louisville/Jefferson County, KY-IN
> Peak week for infections: Week ending Jan. 26, 2022 (4,471 infections per 100,000)
> Peak week for COVID-19 deaths: Week ending Mar. 25, 2021 (29.4 infections per 100,000)
> Current weekly case rate: 3,399 infections per 100,000
> Current weekly death rate: 7.7 deaths per 100,000
> Total cases: 20,027
> Total deaths: 176
> Population: 1,257,088

New Orleans-Metairie, LA
> Peak week for infections: Week ending Jan. 11, 2022 (4,093 infections per 100,000)
> Peak week for COVID-19 deaths: Week ending Apr. 16, 2020 (32.0 infections per 100,000)
> Current weekly case rate: 1,379 infections per 100,000
> Current weekly death rate: 9.9 deaths per 100,000
> Total cases: 105,555
> Total deaths: 1,257
> Population: 1,267,777
[in-text-ad]

Richmond, VA
> Peak week for infections: Week ending Jan. 10, 2022 (2,799 infections per 100,000)
> Peak week for COVID-19 deaths: Week ending Mar. 3, 2021 (51.0 infections per 100,000)
> Current weekly case rate: 2,057 infections per 100,000
> Current weekly death rate: 5.9 deaths per 100,000
> Total cases: 2,455
> Total deaths: 50
> Population: 1,269,530
 24/7 Wall St.
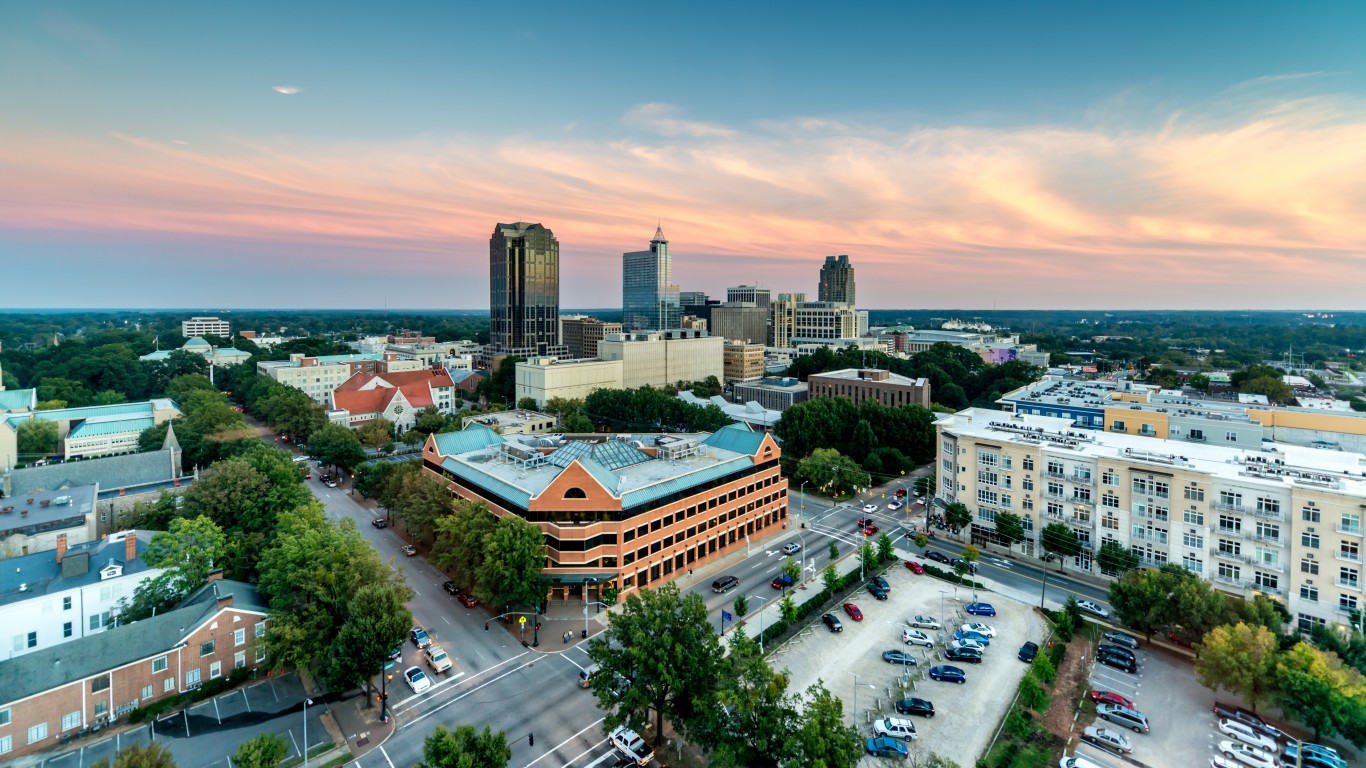
Raleigh-Cary, NC
> Peak week for infections: Week ending Jan. 26, 2022 (6,932 infections per 100,000)
> Peak week for COVID-19 deaths: Week ending Mar. 31, 2021 (14.3 infections per 100,000)
> Current weekly case rate: 3,644 infections per 100,000
> Current weekly death rate: 3.4 deaths per 100,000
> Total cases: 18,960
> Total deaths: 65
> Population: 1,332,311

Memphis, TN-MS-AR
> Peak week for infections: Week ending Sep. 20, 2020 (4,414 infections per 100,000)
> Peak week for COVID-19 deaths: Week ending Sep. 20, 2020 (67.9 infections per 100,000)
> Current weekly case rate: 2,082 infections per 100,000
> Current weekly death rate: 10.7 deaths per 100,000
> Total cases: 2,180
> Total deaths: 46
> Population: 1,339,623
[in-text-ad-2]

Oklahoma City, OK
> Peak week for infections: Week ending Jan. 21, 2022 (4,304 infections per 100,000)
> Peak week for COVID-19 deaths: Week ending Apr. 9, 2021 (76.6 infections per 100,000)
> Current weekly case rate: 3,854 infections per 100,000
> Current weekly death rate: 8.1 deaths per 100,000
> Total cases: 37,338
> Total deaths: 331
> Population: 1,382,841

Jacksonville, FL
> Peak week for infections: Week ending Jan. 24, 2022 (7,427 infections per 100,000)
> Peak week for COVID-19 deaths: Week ending Sep. 20, 2021 (216.7 infections per 100,000)
> Current weekly case rate: 2,687 infections per 100,000
> Current weekly death rate: 10.1 deaths per 100,000
> Total cases: 8,291
> Total deaths: 129
> Population: 1,503,574
[in-text-ad]

Milwaukee-Waukesha, WI
> Peak week for infections: Week ending Jan. 20, 2022 (8,654 infections per 100,000)
> Peak week for COVID-19 deaths: Week ending Dec. 22, 2020 (21.9 infections per 100,000)
> Current weekly case rate: 1,394 infections per 100,000
> Current weekly death rate: 16.9 deaths per 100,000
> Total cases: 262,587
> Total deaths: 1,994
> Population: 1,575,223
 24/7 Wall St.
Providence-Warwick, RI-MA
> Peak week for infections: Week ending Jan. 14, 2022 (6,277 infections per 100,000)
> Peak week for COVID-19 deaths: Week ending Mar. 18, 2021 (368.1 infections per 100,000)
> Current weekly case rate: 3,317 infections per 100,000
> Current weekly death rate: 17.6 deaths per 100,000
> Total cases: 145,215
> Total deaths: 2,326
> Population: 1,618,268
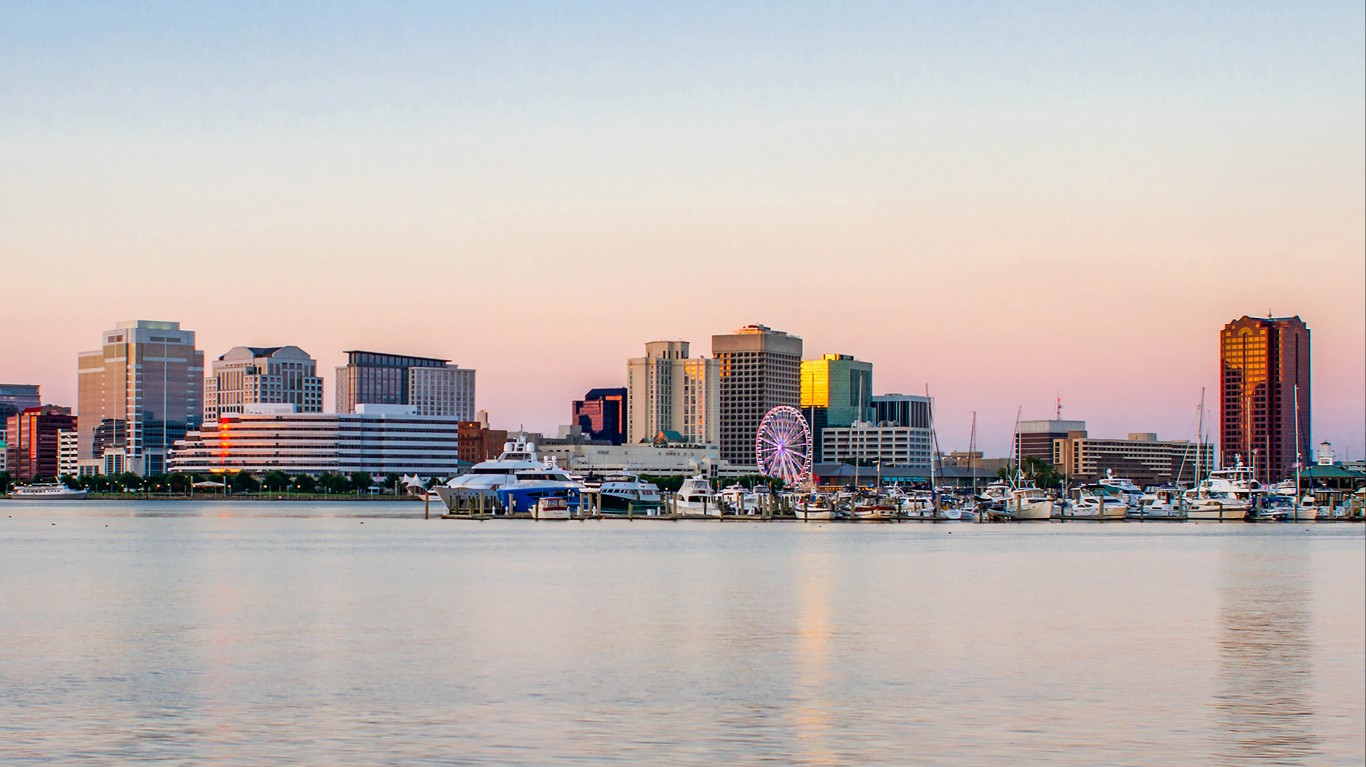
Virginia Beach-Norfolk-Newport News, VA-NC
> Peak week for infections: Week ending Jan. 14, 2022 (4,394 infections per 100,000)
> Peak week for COVID-19 deaths: Week ending Mar. 3, 2021 (42.4 infections per 100,000)
> Current weekly case rate: 2,003 infections per 100,000
> Current weekly death rate: 6.7 deaths per 100,000
> Total cases: 47,907
> Total deaths: 398
> Population: 1,761,729
[in-text-ad-2]

Nashville-Davidson-Murfreesboro-Franklin, TN
> Peak week for infections: Week ending Jan. 21, 2022 (4,328 infections per 100,000)
> Peak week for COVID-19 deaths: Week ending Dec. 30, 2021 (77.6 infections per 100,000)
> Current weekly case rate: 4,200 infections per 100,000
> Current weekly death rate: 15.3 deaths per 100,000
> Total cases: 3,739
> Total deaths: 52
> Population: 1,871,903
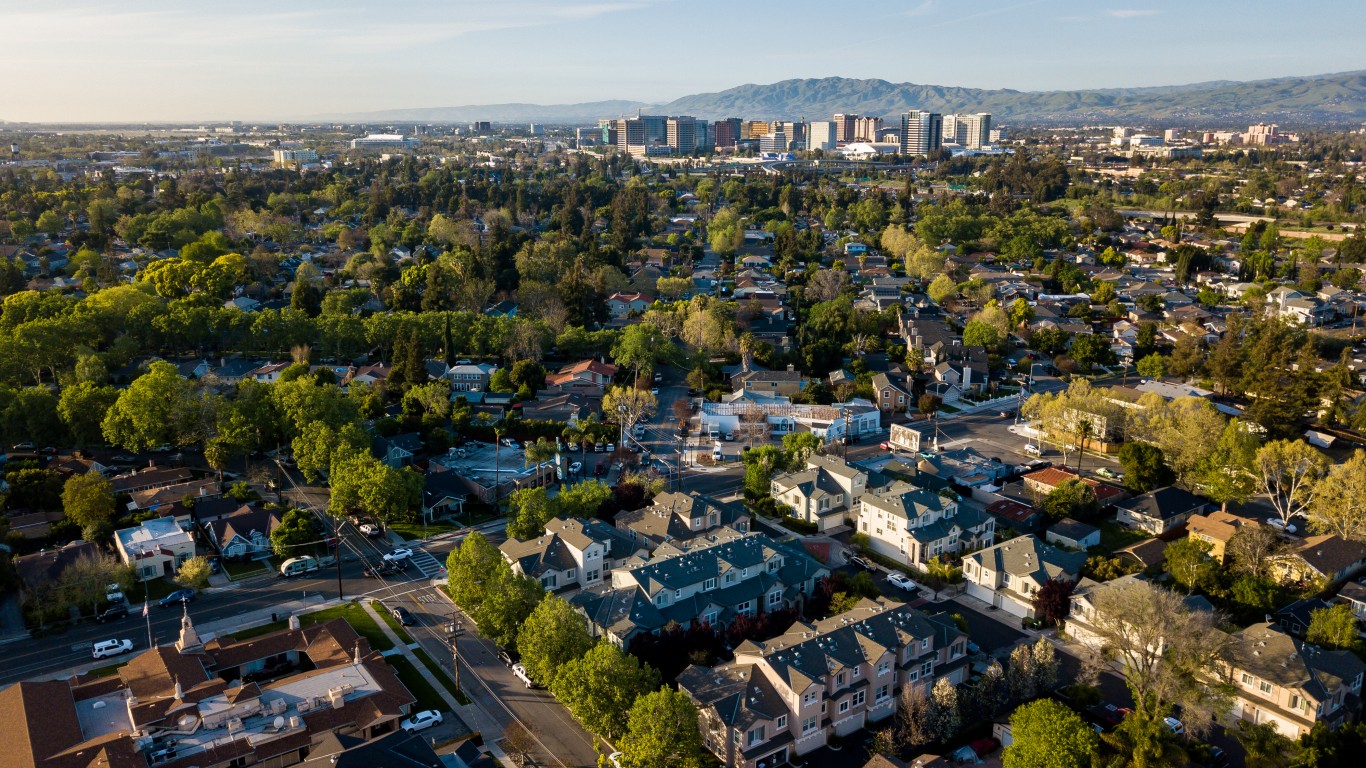
San Jose-Sunnyvale-Santa Clara, CA
> Peak week for infections: Week ending Jan. 24, 2022 (6,255 infections per 100,000)
> Peak week for COVID-19 deaths: Week ending Jan. 13, 2021 (31.4 infections per 100,000)
> Current weekly case rate: 4,016 infections per 100,000
> Current weekly death rate: 4.0 deaths per 100,000
> Total cases: 12,717
> Total deaths: 90
> Population: 1,987,846
[in-text-ad]

Indianapolis-Carmel-Anderson, IN
> Peak week for infections: Week ending Jan. 24, 2022 (5,074 infections per 100,000)
> Peak week for COVID-19 deaths: Week ending Feb. 9, 2021 (64.0 infections per 100,000)
> Current weekly case rate: 3,077 infections per 100,000
> Current weekly death rate: 22.7 deaths per 100,000
> Total cases: 14,665
> Total deaths: 148
> Population: 2,029,472
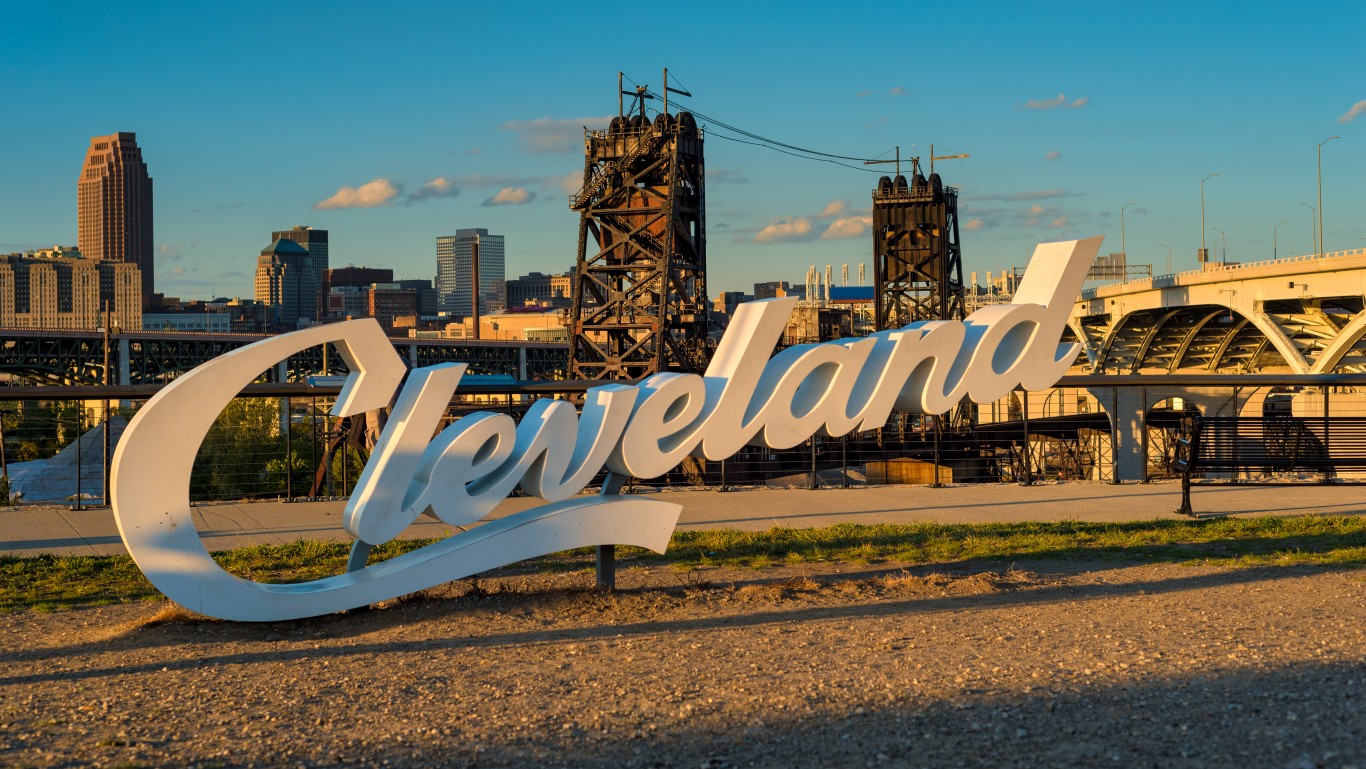
Cleveland-Elyria, OH
> Peak week for infections: Week ending Jan. 7, 2022 (4,893 infections per 100,000)
> Peak week for COVID-19 deaths: Week ending Feb. 17, 2021 (106.7 infections per 100,000)
> Current weekly case rate: 601 infections per 100,000
> Current weekly death rate: 37.1 deaths per 100,000
> Total cases: 264,158
> Total deaths: 3,390
> Population: 2,056,898

Columbus, OH
> Peak week for infections: Week ending Jan. 25, 2022 (6,821 infections per 100,000)
> Peak week for COVID-19 deaths: Week ending Feb. 17, 2021 (102.4 infections per 100,000)
> Current weekly case rate: 1,948 infections per 100,000
> Current weekly death rate: 19.6 deaths per 100,000
> Total cases: 43,161
> Total deaths: 241
> Population: 2,077,761
[in-text-ad-2]

Austin-Round Rock-Georgetown, TX
> Peak week for infections: Week ending Jan. 25, 2022 (7,806 infections per 100,000)
> Peak week for COVID-19 deaths: Week ending Aug. 18, 2020 (19.1 infections per 100,000)
> Current weekly case rate: 2,916 infections per 100,000
> Current weekly death rate: 8.6 deaths per 100,000
> Total cases: 20,968
> Total deaths: 206
> Population: 2,114,441
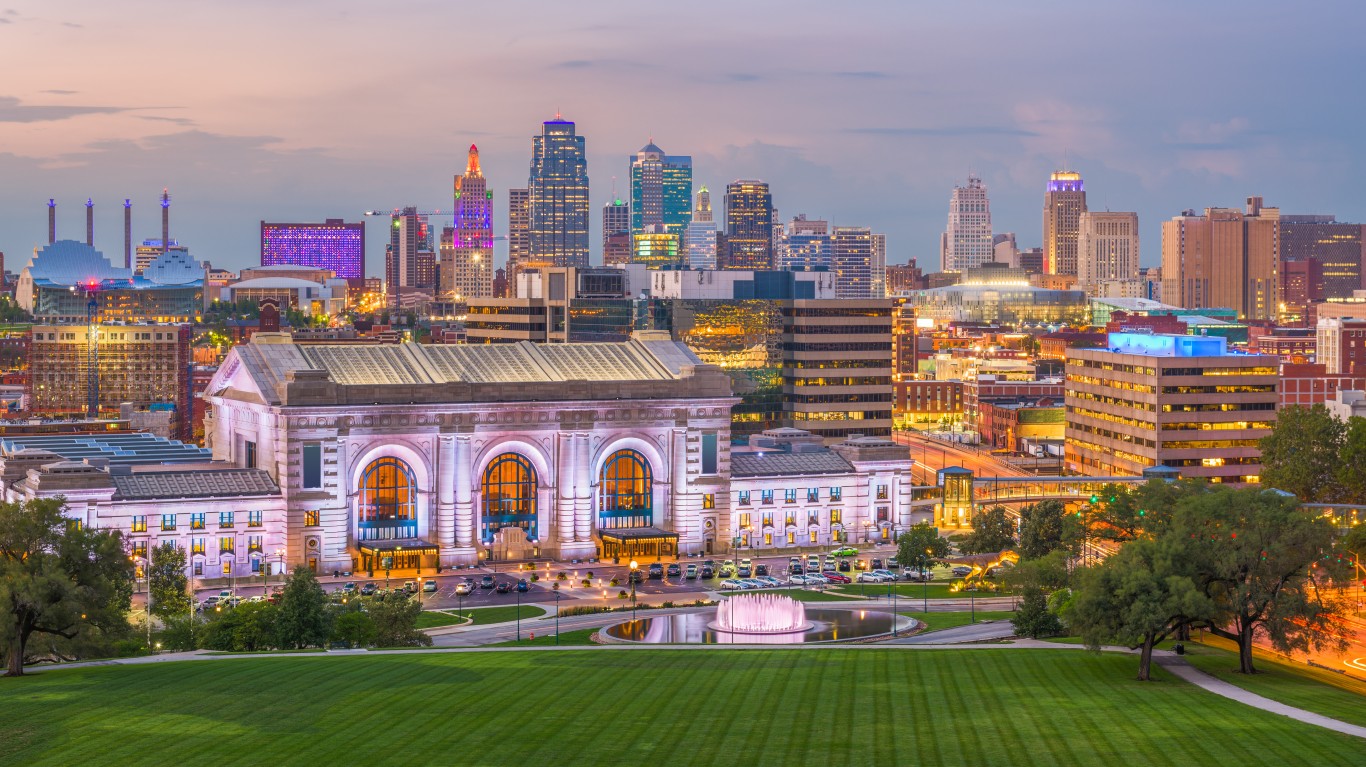
Kansas City, MO-KS
> Peak week for infections: Week ending Mar. 21, 2021 (7,851 infections per 100,000)
> Peak week for COVID-19 deaths: Week ending Mar. 18, 2021 (244.0 infections per 100,000)
> Current weekly case rate: 3,267 infections per 100,000
> Current weekly death rate: 10.4 deaths per 100,000
> Total cases: 3,641
> Total deaths: 73
> Population: 2,124,518
[in-text-ad]

Las Vegas-Henderson-Paradise, NV
> Peak week for infections: Week ending Jan. 26, 2022 (8,262 infections per 100,000)
> Peak week for COVID-19 deaths: Week ending Jan. 14, 2021 (49.9 infections per 100,000)
> Current weekly case rate: 3,263 infections per 100,000
> Current weekly death rate: 21.6 deaths per 100,000
> Total cases: 499,077
> Total deaths: 7,043
> Population: 2,182,004
 24/7 Wall St.
Cincinnati, OH-KY-IN
> Peak week for infections: Week ending Jan. 25, 2022 (8,258 infections per 100,000)
> Peak week for COVID-19 deaths: Week ending Feb. 13, 2021 (115.1 infections per 100,000)
> Current weekly case rate: 2,915 infections per 100,000
> Current weekly death rate: 16.4 deaths per 100,000
> Total cases: 34,748
> Total deaths: 248
> Population: 2,201,741

Sacramento-Roseville-Folsom, CA
> Peak week for infections: Week ending Jan. 24, 2022 (6,856 infections per 100,000)
> Peak week for COVID-19 deaths: Week ending Jan. 28, 2022 (32.9 infections per 100,000)
> Current weekly case rate: 4,575 infections per 100,000
> Current weekly death rate: 17.4 deaths per 100,000
> Total cases: 27,839
> Total deaths: 185
> Population: 2,315,980
[in-text-ad-2]

Pittsburgh, PA
> Peak week for infections: Week ending Jan. 25, 2022 (5,930 infections per 100,000)
> Peak week for COVID-19 deaths: Week ending Jan. 15, 2021 (48.3 infections per 100,000)
> Current weekly case rate: 2,968 infections per 100,000
> Current weekly death rate: 23.9 deaths per 100,000
> Total cases: 254,874
> Total deaths: 3,059
> Population: 2,331,447

Portland-Vancouver-Hillsboro, OR-WA
> Peak week for infections: Week ending Jan. 26, 2022 (5,749 infections per 100,000)
> Peak week for COVID-19 deaths: Week ending Dec. 25, 2020 (21.4 infections per 100,000)
> Current weekly case rate: 3,702 infections per 100,000
> Current weekly death rate: 13.4 deaths per 100,000
> Total cases: 56,017
> Total deaths: 488
> Population: 2,445,761
[in-text-ad]
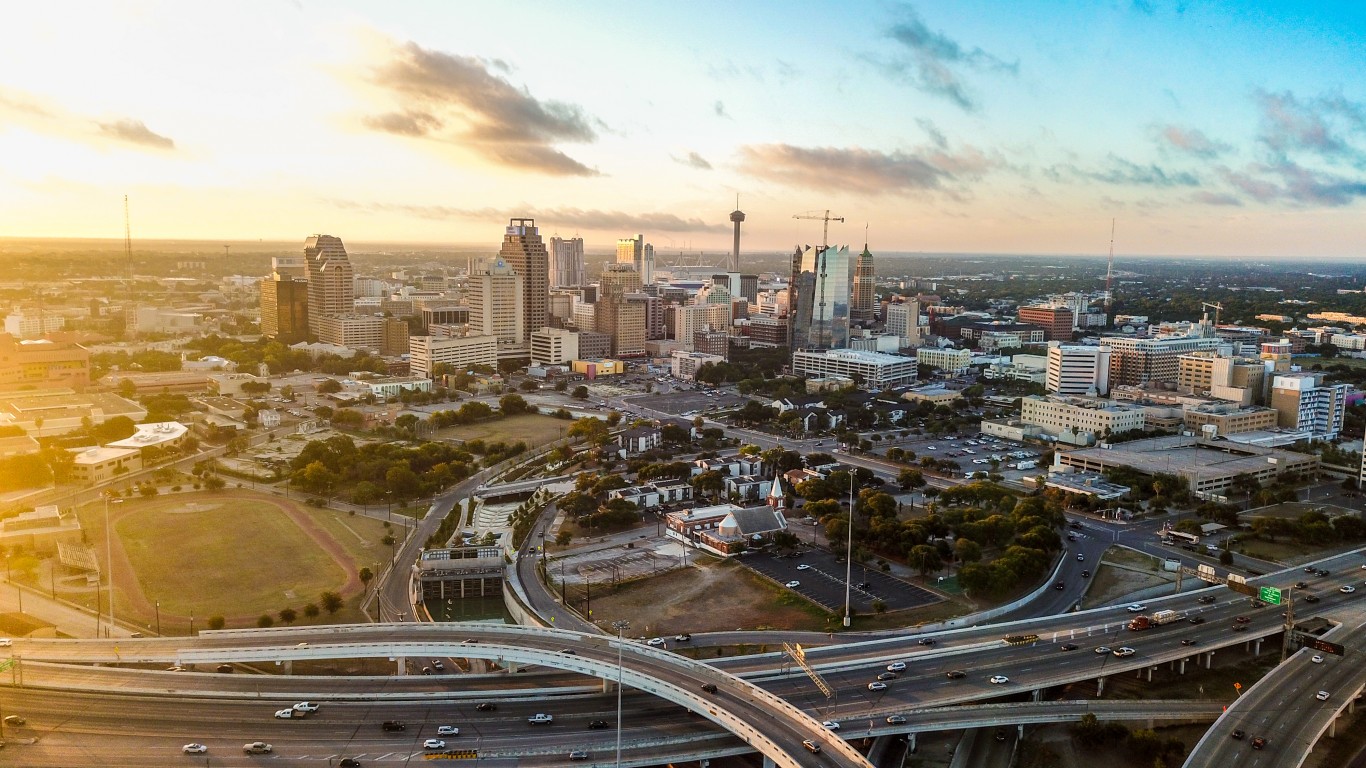
San Antonio-New Braunfels, TX
> Peak week for infections: Week ending Jan. 25, 2022 (11,278 infections per 100,000)
> Peak week for COVID-19 deaths: Week ending Aug. 3, 2020 (57.0 infections per 100,000)
> Current weekly case rate: 5,910 infections per 100,000
> Current weekly death rate: 14.7 deaths per 100,000
> Total cases: 12,790
> Total deaths: 220
> Population: 2,468,193

Orlando-Kissimmee-Sanford, FL
> Peak week for infections: Week ending Jan. 24, 2022 (12,677 infections per 100,000)
> Peak week for COVID-19 deaths: Week ending Sep. 20, 2021 (195.6 infections per 100,000)
> Current weekly case rate: 3,378 infections per 100,000
> Current weekly death rate: 16.3 deaths per 100,000
> Total cases: 81,099
> Total deaths: 1,347
> Population: 2,508,970

Charlotte-Concord-Gastonia, NC-SC
> Peak week for infections: Week ending Jan. 26, 2022 (9,376 infections per 100,000)
> Peak week for COVID-19 deaths: Week ending Feb. 3, 2021 (27.0 infections per 100,000)
> Current weekly case rate: 6,162 infections per 100,000
> Current weekly death rate: 12.4 deaths per 100,000
> Total cases: 53,211
> Total deaths: 428
> Population: 2,545,560
[in-text-ad-2]

Baltimore-Columbia-Towson, MD
> Peak week for infections: Week ending Jan. 5, 2022 (10,050 infections per 100,000)
> Peak week for COVID-19 deaths: Week ending Jun. 8, 2021 (43.6 infections per 100,000)
> Current weekly case rate: 1,019 infections per 100,000
> Current weekly death rate: 32.9 deaths per 100,000
> Total cases: 85,173
> Total deaths: 998
> Population: 2,796,733
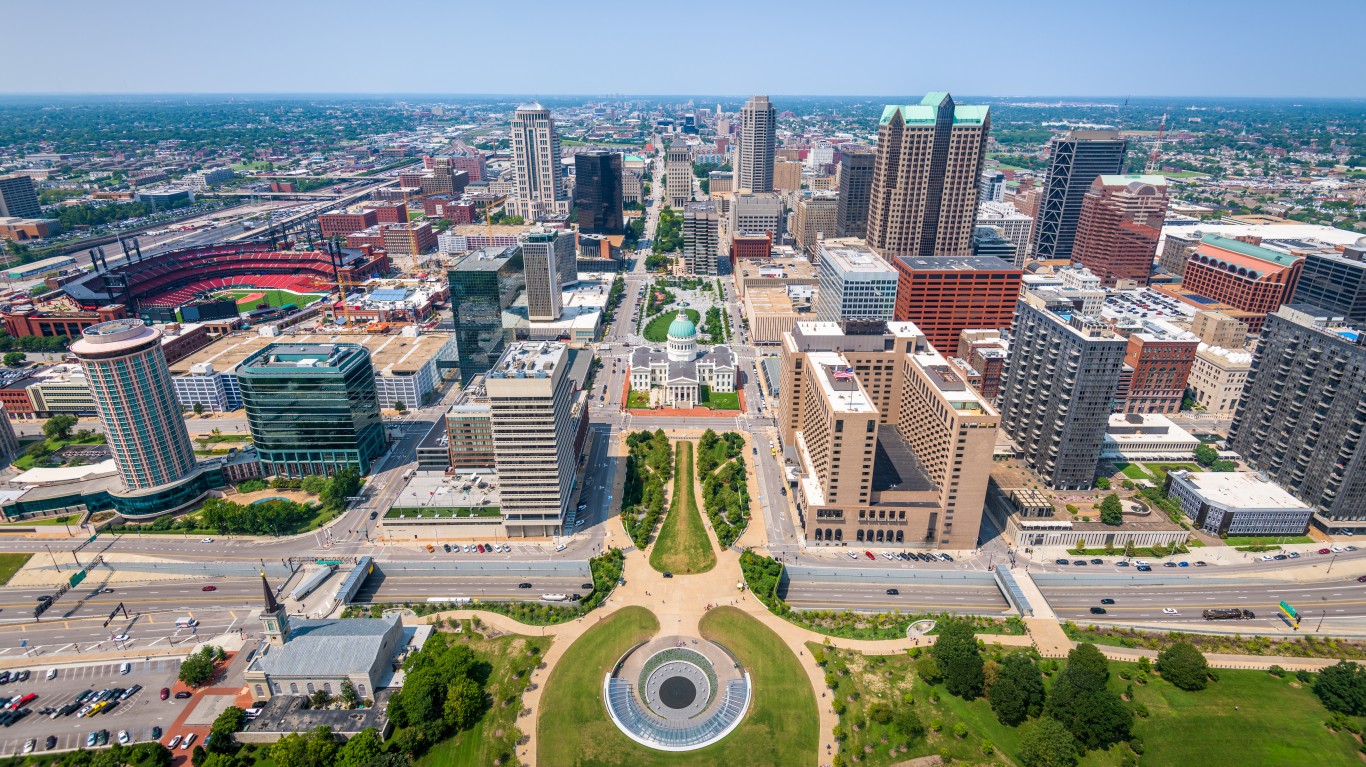
St. Louis, MO-IL
> Peak week for infections: Week ending Jan. 12, 2022 (8,184 infections per 100,000)
> Peak week for COVID-19 deaths: Week ending Nov. 1, 2020 (133.7 infections per 100,000)
> Current weekly case rate: 3,035 infections per 100,000
> Current weekly death rate: 16.3 deaths per 100,000
> Total cases: 4,196
> Total deaths: 28
> Population: 2,805,190
[in-text-ad]

Denver-Aurora-Lakewood, CO
> Peak week for infections: Week ending Jan. 14, 2022 (8,345 infections per 100,000)
> Peak week for COVID-19 deaths: Week ending Dec. 16, 2020 (41.4 infections per 100,000)
> Current weekly case rate: 3,466 infections per 100,000
> Current weekly death rate: 22.3 deaths per 100,000
> Total cases: 125,625
> Total deaths: 1,173
> Population: 2,892,066

Tampa-St. Petersburg-Clearwater, FL
> Peak week for infections: Week ending Jan. 24, 2022 (12,744 infections per 100,000)
> Peak week for COVID-19 deaths: Week ending Sep. 20, 2021 (300.7 infections per 100,000)
> Current weekly case rate: 4,273 infections per 100,000
> Current weekly death rate: 29.4 deaths per 100,000
> Total cases: 40,158
> Total deaths: 963
> Population: 3,097,859

San Diego-Chula Vista-Carlsbad, CA
> Peak week for infections: Week ending Jan. 19, 2022 (14,423 infections per 100,000)
> Peak week for COVID-19 deaths: Week ending Jan. 29, 2021 (44.6 infections per 100,000)
> Current weekly case rate: 8,358 infections per 100,000
> Current weekly death rate: 12.0 deaths per 100,000
> Total cases: 749,553
> Total deaths: 4,735
> Population: 3,316,073
[in-text-ad-2]

Minneapolis-St. Paul-Bloomington, MN-WI
> Peak week for infections: Week ending Jan. 27, 2022 (9,781 infections per 100,000)
> Peak week for COVID-19 deaths: Week ending Dec. 17, 2020 (34.6 infections per 100,000)
> Current weekly case rate: 7,657 infections per 100,000
> Current weekly death rate: 22.0 deaths per 100,000
> Total cases: 94,222
> Total deaths: 745
> Population: 3,573,609

Seattle-Tacoma-Bellevue, WA
> Peak week for infections: Week ending Jan. 26, 2022 (12,245 infections per 100,000)
> Peak week for COVID-19 deaths: Week ending Dec. 8, 2020 (35.1 infections per 100,000)
> Current weekly case rate: 9,790 infections per 100,000
> Current weekly death rate: 19.6 deaths per 100,000
> Total cases: 351,573
> Total deaths: 2,335
> Population: 3,871,323
[in-text-ad]

Detroit-Warren-Dearborn, MI
> Peak week for infections: Week ending Jan. 25, 2022 (11,095 infections per 100,000)
> Peak week for COVID-19 deaths: Week ending Apr. 16, 2020 (161.0 infections per 100,000)
> Current weekly case rate: 6,206 infections per 100,000
> Current weekly death rate: 51.0 deaths per 100,000
> Total cases: 19,677
> Total deaths: 386
> Population: 4,317,848

Riverside-San Bernardino-Ontario, CA
> Peak week for infections: Week ending Jan. 25, 2022 (15,342 infections per 100,000)
> Peak week for COVID-19 deaths: Week ending Mar. 19, 2021 (137.4 infections per 100,000)
> Current weekly case rate: 9,715 infections per 100,000
> Current weekly death rate: 19.0 deaths per 100,000
> Total cases: 591,645
> Total deaths: 5,827
> Population: 4,560,470

San Francisco-Oakland-Berkeley, CA
> Peak week for infections: Week ending Jan. 24, 2022 (14,968 infections per 100,000)
> Peak week for COVID-19 deaths: Week ending Mar. 19, 2021 (58.9 infections per 100,000)
> Current weekly case rate: 9,125 infections per 100,000
> Current weekly death rate: 14.6 deaths per 100,000
> Total cases: 250,765
> Total deaths: 1,638
> Population: 4,701,332
[in-text-ad-2]

Phoenix-Mesa-Chandler, AZ
> Peak week for infections: Week ending Jan. 25, 2022 (20,824 infections per 100,000)
> Peak week for COVID-19 deaths: Week ending Jan. 13, 2021 (110.1 infections per 100,000)
> Current weekly case rate: 10,224 infections per 100,000
> Current weekly death rate: 53.3 deaths per 100,000
> Total cases: 1,211,770
> Total deaths: 14,987
> Population: 4,761,603

Boston-Cambridge-Newton, MA-NH
> Peak week for infections: Week ending Jan. 13, 2022 (15,649 infections per 100,000)
> Peak week for COVID-19 deaths: Week ending Apr. 29, 2020 (133.7 infections per 100,000)
> Current weekly case rate: 5,112 infections per 100,000
> Current weekly death rate: 44.0 deaths per 100,000
> Total cases: 199,398
> Total deaths: 3,000
> Population: 4,832,346
[in-text-ad]
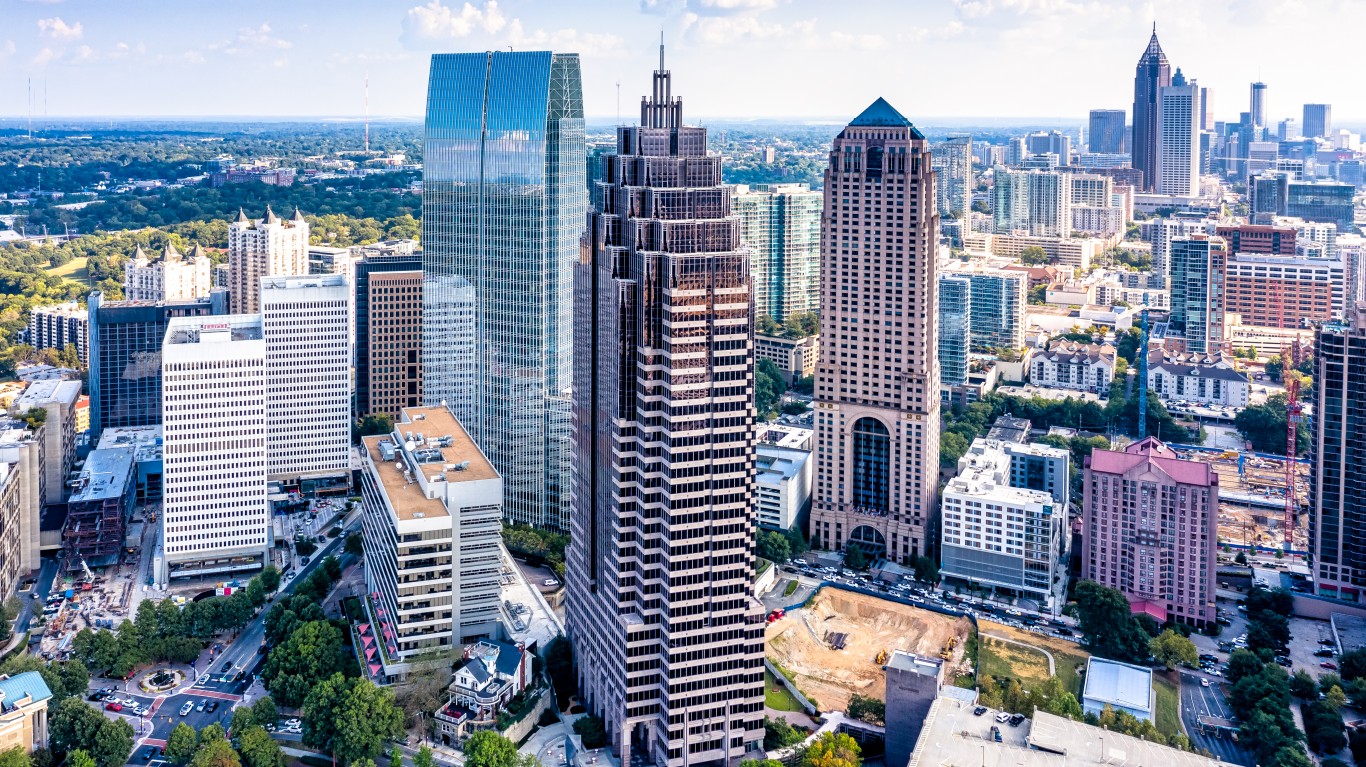
Atlanta-Sandy Springs-Alpharetta, GA
> Peak week for infections: Week ending Jan. 12, 2022 (15,499 infections per 100,000)
> Peak week for COVID-19 deaths: Week ending Jan. 28, 2021 (67.1 infections per 100,000)
> Current weekly case rate: 8,537 infections per 100,000
> Current weekly death rate: 40.3 deaths per 100,000
> Total cases: 21,348
> Total deaths: 226
> Population: 5,862,424
 24/7 Wall St.
Philadelphia-Camden-Wilmington, PA-NJ-DE-MD
> Peak week for infections: Week ending Jan. 10, 2022 (15,914 infections per 100,000)
> Peak week for COVID-19 deaths: Week ending Apr. 21, 2020 (159.9 infections per 100,000)
> Current weekly case rate: 4,032 infections per 100,000
> Current weekly death rate: 61.0 deaths per 100,000
> Total cases: 120,050
> Total deaths: 1,766
> Population: 6,079,130

Miami-Fort Lauderdale-Pompano Beach, FL
> Peak week for infections: Week ending Jan. 10, 2022 (51,900 infections per 100,000)
> Peak week for COVID-19 deaths: Week ending Sep. 20, 2021 (495.6 infections per 100,000)
> Current weekly case rate: 6,235 infections per 100,000
> Current weekly death rate: 62.4 deaths per 100,000
> Total cases: 584,108
> Total deaths: 5,379
> Population: 6,090,660
[in-text-ad-2]

Washington-Arlington-Alexandria, DC-VA-MD-WV
> Peak week for infections: Week ending Jan. 5, 2022 (18,166 infections per 100,000)
> Peak week for COVID-19 deaths: Week ending Apr. 27, 2020 (81.0 infections per 100,000)
> Current weekly case rate: 4,022 infections per 100,000
> Current weekly death rate: 30.6 deaths per 100,000
> Total cases: 28,724
> Total deaths: 169
> Population: 6,196,585

Houston-The Woodlands-Sugar Land, TX
> Peak week for infections: Week ending Jan. 25, 2022 (25,750 infections per 100,000)
> Peak week for COVID-19 deaths: Week ending Aug. 1, 2020 (119.9 infections per 100,000)
> Current weekly case rate: 6,071 infections per 100,000
> Current weekly death rate: 32.7 deaths per 100,000
> Total cases: 5,301
> Total deaths: 64
> Population: 6,884,138
[in-text-ad]
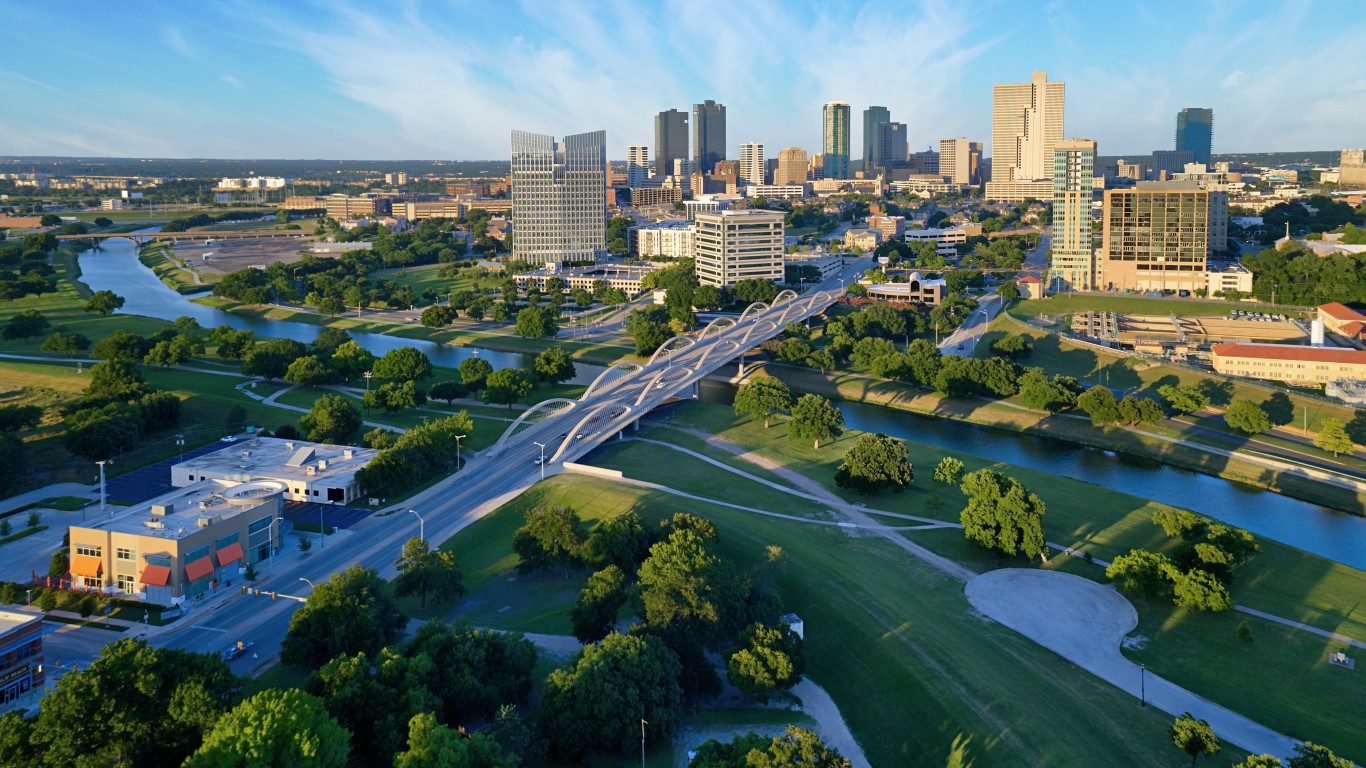
Dallas-Fort Worth-Arlington, TX
> Peak week for infections: Week ending Jan. 25, 2022 (18,967 infections per 100,000)
> Peak week for COVID-19 deaths: Week ending Jan. 27, 2021 (88.6 infections per 100,000)
> Current weekly case rate: 8,515 infections per 100,000
> Current weekly death rate: 48.4 deaths per 100,000
> Total cases: 197,090
> Total deaths: 1,346
> Population: 7,320,663

Chicago-Naperville-Elgin, IL-IN-WI
> Peak week for infections: Week ending Jan. 11, 2022 (23,856 infections per 100,000)
> Peak week for COVID-19 deaths: Week ending Apr. 16, 2020 (123.0 infections per 100,000)
> Current weekly case rate: 10,319 infections per 100,000
> Current weekly death rate: 96.6 deaths per 100,000
> Total cases: 1,089,942
> Total deaths: 13,497
> Population: 9,508,605

Los Angeles-Long Beach-Anaheim, CA
> Peak week for infections: Week ending Jan. 24, 2022 (52,354 infections per 100,000)
> Peak week for COVID-19 deaths: Week ending Feb. 2, 2021 (279.4 infections per 100,000)
> Current weekly case rate: 32,726 infections per 100,000
> Current weekly death rate: 74.4 deaths per 100,000
> Total cases: 2,689,142
> Total deaths: 28,947
> Population: 13,249,614
[in-text-ad-2]

New York-Newark-Jersey City, NY-NJ-PA
> Peak week for infections: Week ending Jan. 10, 2022 (92,352 infections per 100,000)
> Peak week for COVID-19 deaths: Week ending Mar. 16, 2021 (1410.4 infections per 100,000)
> Current weekly case rate: 11,644 infections per 100,000
> Current weekly death rate: 211.3 deaths per 100,000
> Total cases: 214,717
> Total deaths: 3,341
> Population: 19,294,236
In 20 Years, I Haven’t Seen A Cash Back Card This Good
After two decades of reviewing financial products I haven’t seen anything like this. Credit card companies are at war, handing out free rewards and benefits to win the best customers.
A good cash back card can be worth thousands of dollars a year in free money, not to mention other perks like travel, insurance, and access to fancy lounges.
Our top pick today pays up to 5% cash back, a $200 bonus on top, and $0 annual fee. Click here to apply before they stop offering rewards this generous.
Flywheel Publishing has partnered with CardRatings for our coverage of credit card products. Flywheel Publishing and CardRatings may receive a commission from card issuers.
Thank you for reading! Have some feedback for us?
Contact the 24/7 Wall St. editorial team.
Latest from 24/7


Our expert who first called NVIDIA in 2009 is predicting 2025 will see a historic AI breakthrough.
You can follow him investing $500,000 of his own money on our top AI stocks for free.