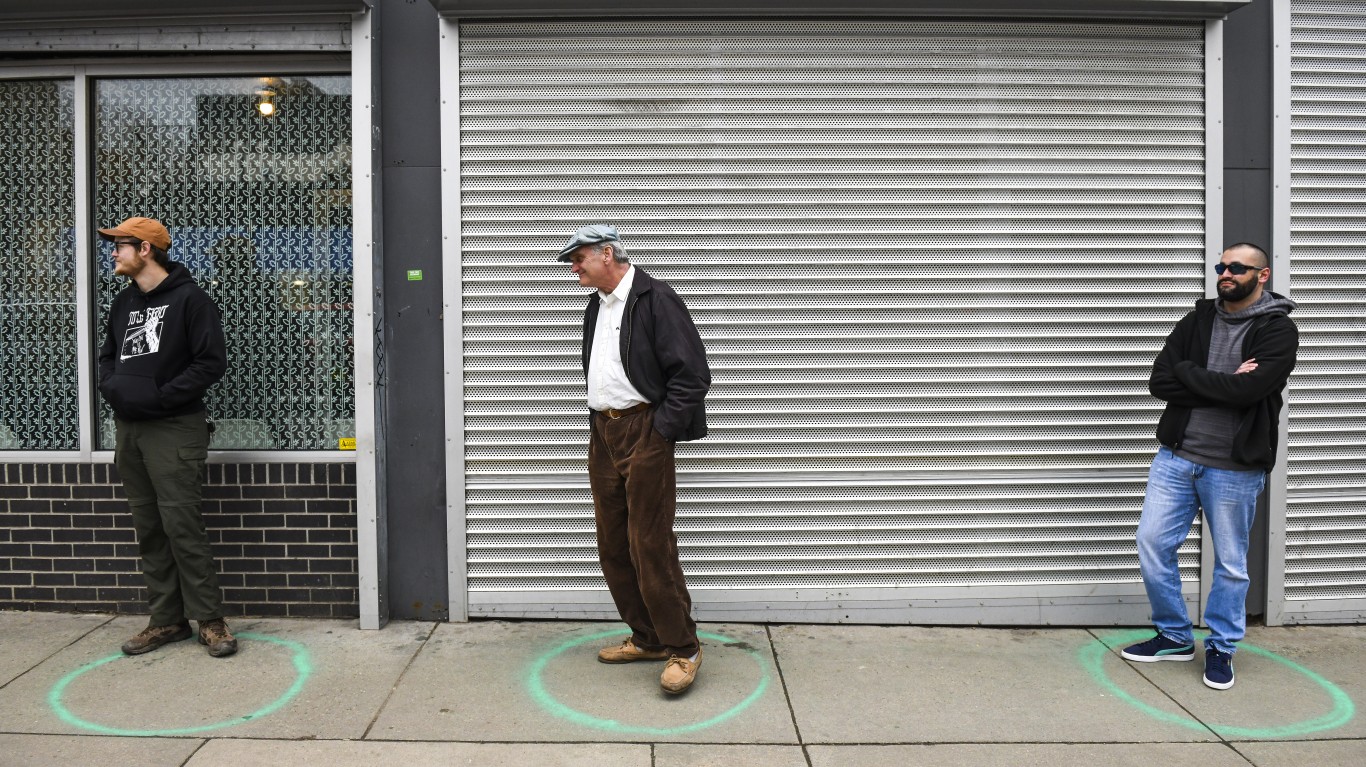
As the omicron variant continues to spread, the national vaccination effort is as urgent as it ever has been. Still, many Americans remain hesitant.
According to a recent survey conducted by the U.S. Census Bureau, 23,830,000 Americans — or 9.6% of the 18 and older population — say they will either probably or definitely not agree to receive the vaccination.
The share of Americans who will likely refuse vaccination varies considerably nationwide, from as many as 20.5% of the adult population to as little as 3.6%, depending on the state.
Many Americans who have yet to be vaccinated cite one of three reasons: either they are concerned about possible side effects, or they want to wait to see if it is safe, or it is difficult for them to obtain a vaccination. Others cite different reasons.
Nationwide, 14,120,000 people, 5.7% of the adult population, do not trust the COVID-19 vaccines, and another 6,980,000, or 2.8%, do not think COVID-19 is a big threat. Additionally, 12,130,000 American adults, or 4.9% of the 18 and older population, have not been vaccinated because they do not trust the government.
Meanwhile, the virus continues to spread. Since the beginning of the pandemic, there have been 76,448,067 confirmed cases of the virus and a total of 902,189 Americans have died as a result.
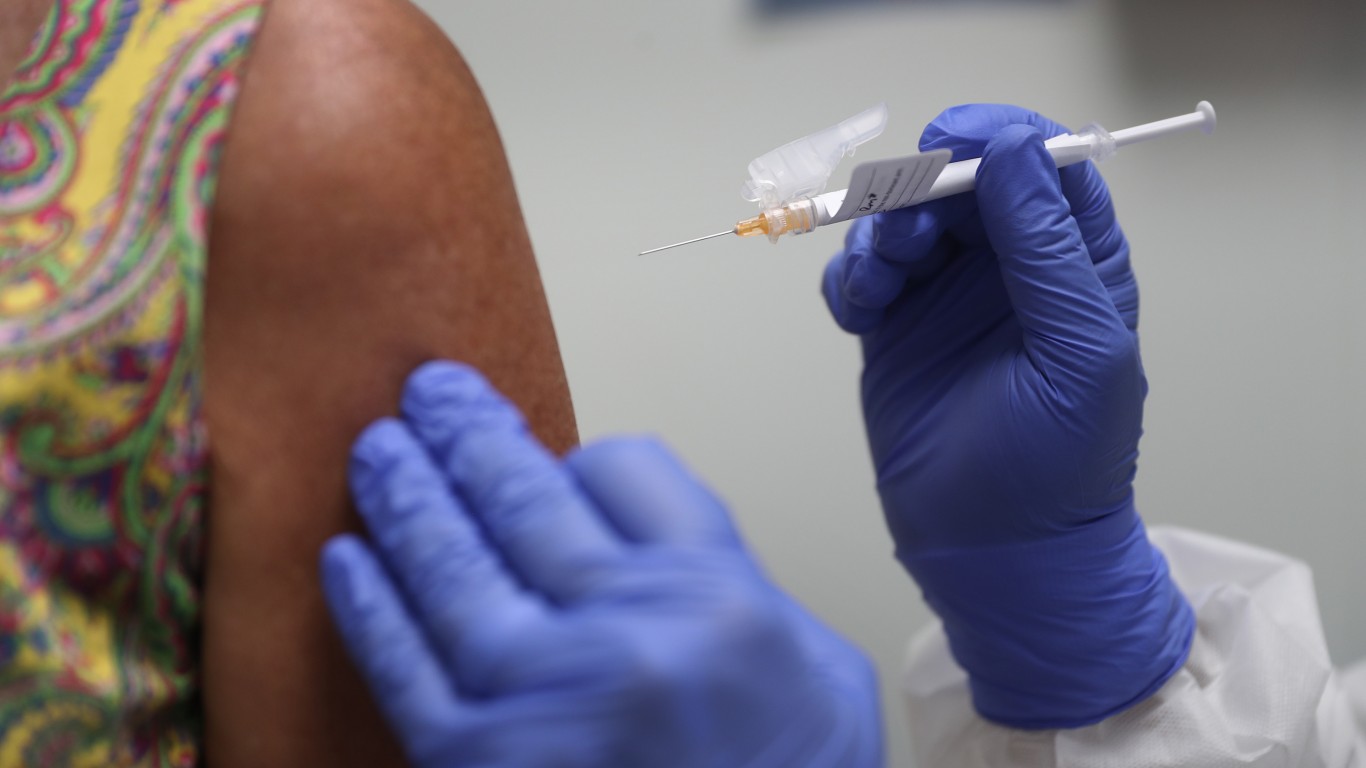
So far, 213,430,434 Americans — or 65.2% of the total population — have received the full course of vaccinations necessary to protect against COVID-19.
All survey data used in this story was published by the Census on Jan. 19, 2022. All data related to COVID-19 infections, fatalities, and vaccinations is current as of Feb. 10, 2022.

50. Massachusetts
> Adults who will likely or definitely refuse vaccination: 3.6% (193,539 total)
> Residents who are fully vaccinated: 5,304,474 (76.9% of population)
> Confirmed cases of COVID-19 to date: 23,756 per 100,000 people (total: 1,639,656)
> COVID-19-related fatalities to date: 327 per 100,000 people (total: 22,602)

49. New Mexico
> Adults who will likely or definitely refuse vaccination: 4.1% (65,380 total)
> Residents who are fully vaccinated: 1,443,450 (68.9% of population)
> Confirmed cases of COVID-19 to date: 23,660 per 100,000 people (total: 495,769)
> COVID-19-related fatalities to date: 313 per 100,000 people (total: 6,561)

48. Delaware
> Adults who will likely or definitely refuse vaccination: 4.2% (31,785 total)
> Residents who are fully vaccinated: 650,563 (67.3% of population)
> Confirmed cases of COVID-19 to date: 26,021 per 100,000 people (total: 251,669)
> COVID-19-related fatalities to date: 268 per 100,000 people (total: 2,593)

47. Maryland
> Adults who will likely or definitely refuse vaccination: 4.6% (210,978 total)
> Residents who are fully vaccinated: 4,427,003 (73.3% of population)
> Confirmed cases of COVID-19 to date: 15,987 per 100,000 people (total: 966,066)
> COVID-19-related fatalities to date: 228 per 100,000 people (total: 13,787)

46. Hawaii
> Adults who will likely or definitely refuse vaccination: 4.7% (50,663 total)
> Residents who are fully vaccinated: 1,082,655 (76.2% of population)
> Confirmed cases of COVID-19 to date: 15,664 per 100,000 people (total: 222,504)
> COVID-19-related fatalities to date: 85 per 100,000 people (total: 1,214)
These are all the counties in Hawaii where COVID-19 is slowing (and where it’s still getting worse).

45. California
> Adults who will likely or definitely refuse vaccination: 4.9% (1,476,409 total)
> Residents who are fully vaccinated: 27,502,666 (69.5% of population)
> Confirmed cases of COVID-19 to date: 22,001 per 100,000 people (total: 8,702,920)
> COVID-19-related fatalities to date: 204 per 100,000 people (total: 80,640)

44. Connecticut
> Adults who will likely or definitely refuse vaccination: 5.1% (139,626 total)
> Residents who are fully vaccinated: 2,750,727 (77.0% of population)
> Confirmed cases of COVID-19 to date: 19,863 per 100,000 people (total: 709,621)
> COVID-19-related fatalities to date: 284 per 100,000 people (total: 10,158)

43. Vermont
> Adults who will likely or definitely refuse vaccination: 5.4% (26,422 total)
> Residents who are fully vaccinated: 497,411 (79.4% of population)
> Confirmed cases of COVID-19 to date: 15,910 per 100,000 people (total: 99,644)
> COVID-19-related fatalities to date: 85 per 100,000 people (total: 531)

42. Rhode Island
> Adults who will likely or definitely refuse vaccination: 5.5% (45,000 total)
> Residents who are fully vaccinated: 844,435 (79.9% of population)
> Confirmed cases of COVID-19 to date: 33,110 per 100,000 people (total: 350,080)
> COVID-19-related fatalities to date: 318 per 100,000 people (total: 3,365)

41. New York
> Adults who will likely or definitely refuse vaccination: 5.9% (868,783 total)
> Residents who are fully vaccinated: 14,541,882 (74.4% of population)
> Confirmed cases of COVID-19 to date: 24,801 per 100,000 people (total: 4,846,576)
> COVID-19-related fatalities to date: 335 per 100,000 people (total: 65,514)

40. Washington
> Adults who will likely or definitely refuse vaccination: 6.0% (351,931 total)
> Residents who are fully vaccinated: 5,364,543 (71.2% of population)
> Confirmed cases of COVID-19 to date: 18,350 per 100,000 people (total: 1,382,782)
> COVID-19-related fatalities to date: 147 per 100,000 people (total: 11,099)

39. New Jersey
> Adults who will likely or definitely refuse vaccination: 6.8% (459,222 total)
> Residents who are fully vaccinated: 6,530,462 (73.3% of population)
> Confirmed cases of COVID-19 to date: 23,955 per 100,000 people (total: 2,134,058)
> COVID-19-related fatalities to date: 360 per 100,000 people (total: 32,094)

38. Maine
> Adults who will likely or definitely refuse vaccination: 7.5% (79,650 total)
> Residents who are fully vaccinated: 1,047,138 (78.2% of population)
> Confirmed cases of COVID-19 to date: 13,710 per 100,000 people (total: 183,499)
> COVID-19-related fatalities to date: 136 per 100,000 people (total: 1,819)
These are all the counties in Maine where COVID-19 is slowing (and where it’s still getting worse).

37. North Carolina
> Adults who will likely or definitely refuse vaccination: 7.7% (619,074 total)
> Residents who are fully vaccinated: 6,171,328 (59.4% of population)
> Confirmed cases of COVID-19 to date: 24,066 per 100,000 people (total: 2,498,957)
> COVID-19-related fatalities to date: 205 per 100,000 people (total: 21,325)
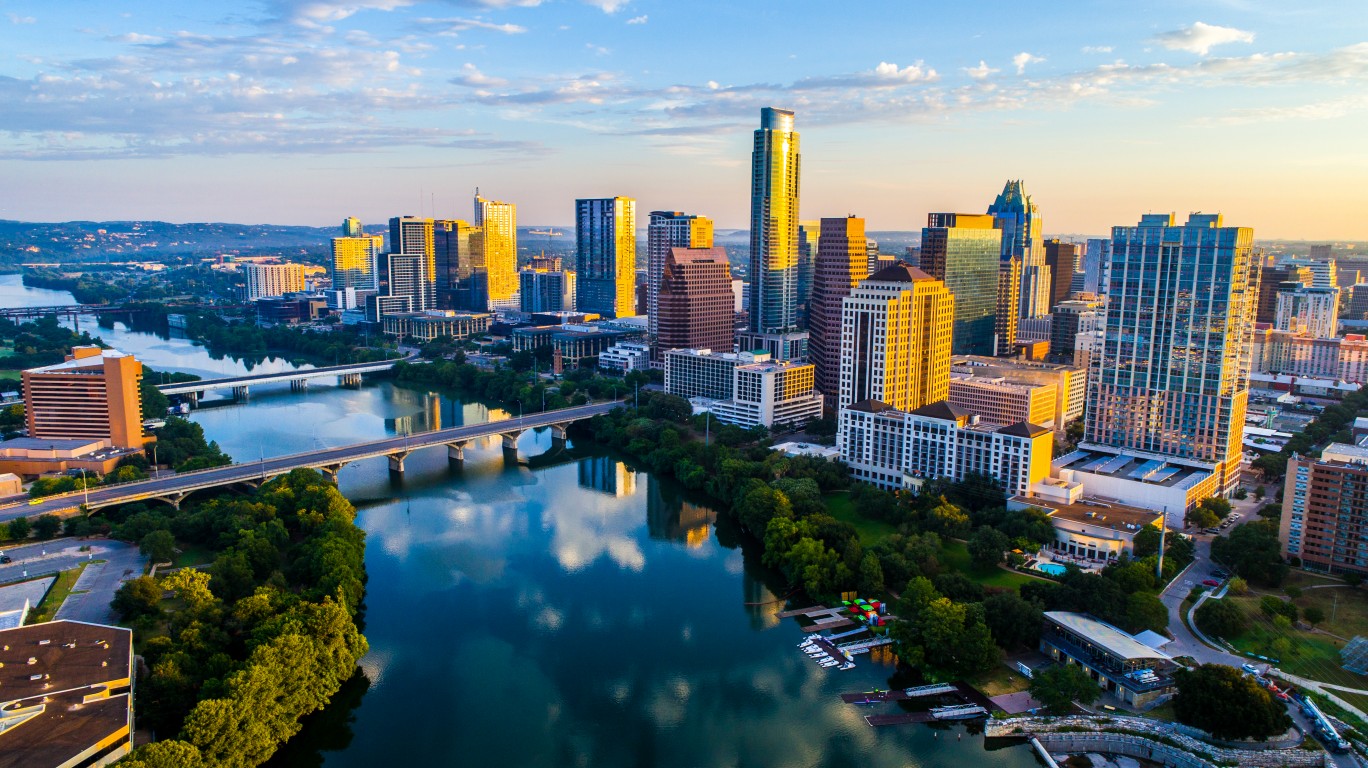
36. Texas
> Adults who will likely or definitely refuse vaccination: 8.2% (1,755,782 total)
> Residents who are fully vaccinated: 17,205,238 (59.9% of population)
> Confirmed cases of COVID-19 to date: 22,282 per 100,000 people (total: 6,395,334)
> COVID-19-related fatalities to date: 278 per 100,000 people (total: 79,711)
These are all the counties in Texas where COVID-19 is slowing (and where it’s still getting worse).

35. Virginia
> Adults who will likely or definitely refuse vaccination: 8.3% (538,752 total)
> Residents who are fully vaccinated: 6,083,844 (71.4% of population)
> Confirmed cases of COVID-19 to date: 18,710 per 100,000 people (total: 1,593,694)
> COVID-19-related fatalities to date: 203 per 100,000 people (total: 17,305)

34. Illinois
> Adults who will likely or definitely refuse vaccination: 8.5% (816,174 total)
> Residents who are fully vaccinated: 8,461,913 (66.4% of population)
> Confirmed cases of COVID-19 to date: 23,368 per 100,000 people (total: 2,977,341)
> COVID-19-related fatalities to date: 278 per 100,000 people (total: 35,476)

33. New Hampshire
> Adults who will likely or definitely refuse vaccination: 9.3% (99,583 total)
> Residents who are fully vaccinated: 941,572 (69.4% of population)
> Confirmed cases of COVID-19 to date: 20,979 per 100,000 people (total: 284,567)
> COVID-19-related fatalities to date: 167 per 100,000 people (total: 2,270)

32. Nevada
> Adults who will likely or definitely refuse vaccination: 10.2% (243,777 total)
> Residents who are fully vaccinated: 1,816,722 (59.9% of population)
> Confirmed cases of COVID-19 to date: 22,072 per 100,000 people (total: 669,748)
> COVID-19-related fatalities to date: 304 per 100,000 people (total: 9,236)
These are all the counties in Nevada where COVID-19 is slowing (and where it’s still getting worse).

31. Colorado
> Adults who will likely or definitely refuse vaccination: 10.3% (458,107 total)
> Residents who are fully vaccinated: 3,953,769 (69.4% of population)
> Confirmed cases of COVID-19 to date: 22,471 per 100,000 people (total: 1,279,858)
> COVID-19-related fatalities to date: 200 per 100,000 people (total: 11,416)

30. Nebraska
> Adults who will likely or definitely refuse vaccination: 10.6% (150,204 total)
> Residents who are fully vaccinated: 1,198,937 (62.1% of population)
> Confirmed cases of COVID-19 to date: 23,258 per 100,000 people (total: 448,709)
> COVID-19-related fatalities to date: 197 per 100,000 people (total: 3,802)

29. Missouri
> Adults who will likely or definitely refuse vaccination: 10.9% (501,238 total)
> Residents who are fully vaccinated: 3,355,247 (54.8% of population)
> Confirmed cases of COVID-19 to date: 22,236 per 100,000 people (total: 1,362,253)
> COVID-19-related fatalities to date: 293 per 100,000 people (total: 17,950)

28. Minnesota
> Adults who will likely or definitely refuse vaccination: 10.9% (460,461 total)
> Residents who are fully vaccinated: 3,808,729 (67.9% of population)
> Confirmed cases of COVID-19 to date: 24,510 per 100,000 people (total: 1,375,279)
> COVID-19-related fatalities to date: 211 per 100,000 people (total: 11,832)

27. Arizona
> Adults who will likely or definitely refuse vaccination: 10.9% (611,770 total)
> Residents who are fully vaccinated: 4,321,178 (60.3% of population)
> Confirmed cases of COVID-19 to date: 26,859 per 100,000 people (total: 1,926,240)
> COVID-19-related fatalities to date: 374 per 100,000 people (total: 26,822)

26. Oregon
> Adults who will likely or definitely refuse vaccination: 11.0% (362,034 total)
> Residents who are fully vaccinated: 2,875,544 (68.6% of population)
> Confirmed cases of COVID-19 to date: 15,880 per 100,000 people (total: 665,486)
> COVID-19-related fatalities to date: 149 per 100,000 people (total: 6,265)
These are all the counties in Oregon where COVID-19 is slowing (and where it’s still getting worse).

25. Pennsylvania
> Adults who will likely or definitely refuse vaccination: 11.0% (1,074,133 total)
> Residents who are fully vaccinated: 8,484,950 (66.3% of population)
> Confirmed cases of COVID-19 to date: 21,109 per 100,000 people (total: 2,703,408)
> COVID-19-related fatalities to date: 326 per 100,000 people (total: 41,781)

24. Florida
> Adults who will likely or definitely refuse vaccination: 11.2% (1,915,866 total)
> Residents who are fully vaccinated: 14,059,401 (66.0% of population)
> Confirmed cases of COVID-19 to date: 26,823 per 100,000 people (total: 5,713,185)
> COVID-19-related fatalities to date: 312 per 100,000 people (total: 66,468)

23. Ohio
> Adults who will likely or definitely refuse vaccination: 11.5% (1,013,735 total)
> Residents who are fully vaccinated: 6,678,306 (57.1% of population)
> Confirmed cases of COVID-19 to date: 22,389 per 100,000 people (total: 2,617,104)
> COVID-19-related fatalities to date: 296 per 100,000 people (total: 34,592)
These are all the counties in Ohio where COVID-19 is slowing (and where it’s still getting worse).

22. Kansas
> Adults who will likely or definitely refuse vaccination: 11.5% (246,147 total)
> Residents who are fully vaccinated: 1,733,958 (59.6% of population)
> Confirmed cases of COVID-19 to date: 25,709 per 100,000 people (total: 748,520)
> COVID-19-related fatalities to date: 265 per 100,000 people (total: 7,725)
These are all the counties in Kansas where COVID-19 is slowing (and where it’s still getting worse).

21. Utah
> Adults who will likely or definitely refuse vaccination: 11.7% (267,128 total)
> Residents who are fully vaccinated: 2,004,257 (63.4% of population)
> Confirmed cases of COVID-19 to date: 28,633 per 100,000 people (total: 905,112)
> COVID-19-related fatalities to date: 134 per 100,000 people (total: 4,223)
These are all the counties in Utah where COVID-19 is slowing (and where it’s still getting worse).

20. Louisiana
> Adults who will likely or definitely refuse vaccination: 11.7% (403,094 total)
> Residents who are fully vaccinated: 2,424,529 (52.0% of population)
> Confirmed cases of COVID-19 to date: 24,510 per 100,000 people (total: 1,142,165)
> COVID-19-related fatalities to date: 344 per 100,000 people (total: 16,016)

19. Michigan
> Adults who will likely or definitely refuse vaccination: 12.0% (913,699 total)
> Residents who are fully vaccinated: 5,854,113 (58.6% of population)
> Confirmed cases of COVID-19 to date: 23,128 per 100,000 people (total: 2,311,891)
> COVID-19-related fatalities to date: 331 per 100,000 people (total: 33,080)

18. Alaska
> Adults who will likely or definitely refuse vaccination: 12.1% (63,491 total)
> Residents who are fully vaccinated: 437,871 (59.4% of population)
> Confirmed cases of COVID-19 to date: 29,886 per 100,000 people (total: 220,388)
> COVID-19-related fatalities to date: 144 per 100,000 people (total: 1,060)
These are all the counties in Alaska where COVID-19 is slowing (and where it’s still getting worse).

17. Iowa
> Adults who will likely or definitely refuse vaccination: 12.3% (289,318 total)
> Residents who are fully vaccinated: 1,914,551 (60.7% of population)
> Confirmed cases of COVID-19 to date: 23,301 per 100,000 people (total: 735,422)
> COVID-19-related fatalities to date: 280 per 100,000 people (total: 8,829)
These are all the counties in Iowa where COVID-19 is slowing (and where it’s still getting worse).

16. Kentucky
> Adults who will likely or definitely refuse vaccination: 12.5% (418,027 total)
> Residents who are fully vaccinated: 2,500,818 (56.0% of population)
> Confirmed cases of COVID-19 to date: 27,139 per 100,000 people (total: 1,212,686)
> COVID-19-related fatalities to date: 295 per 100,000 people (total: 13,182)
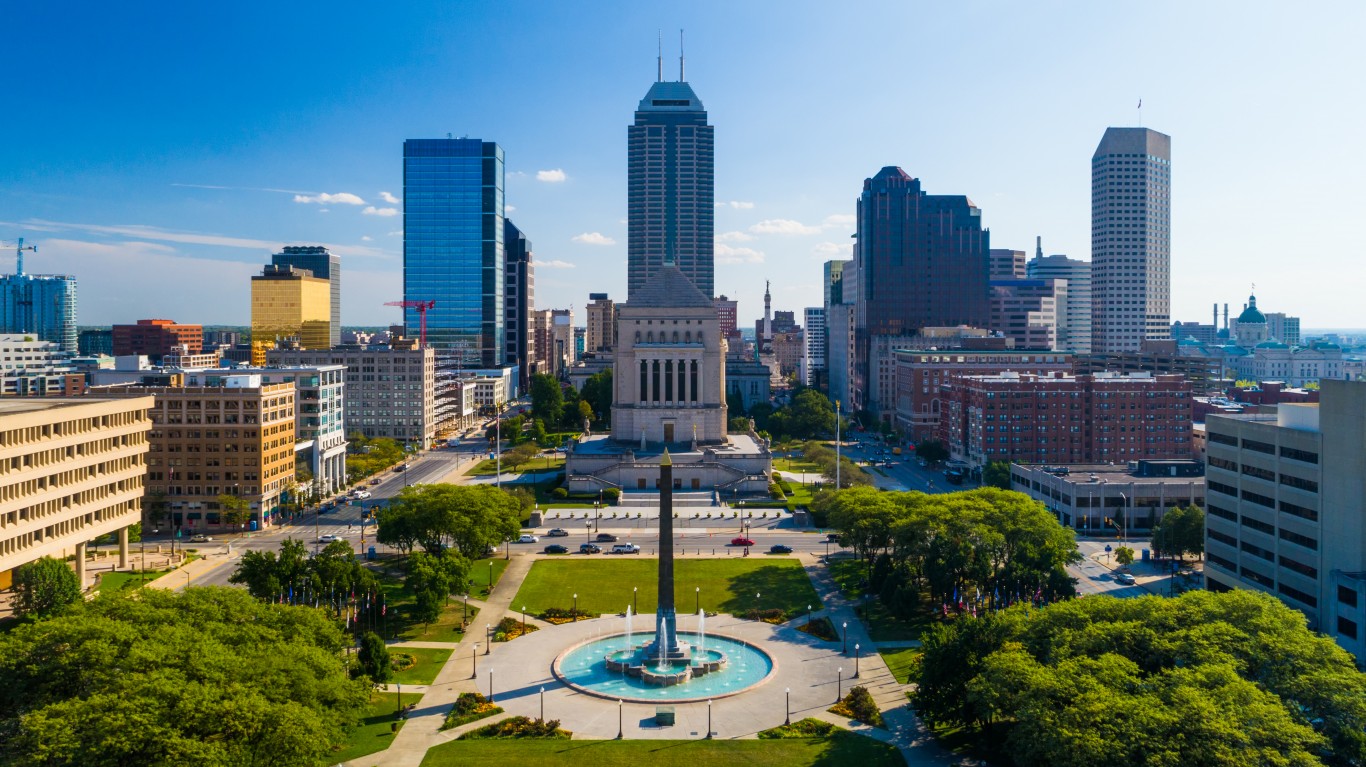
15. Indiana
> Adults who will likely or definitely refuse vaccination: 12.7% (634,990 total)
> Residents who are fully vaccinated: 3,605,880 (53.9% of population)
> Confirmed cases of COVID-19 to date: 24,733 per 100,000 people (total: 1,655,125)
> COVID-19-related fatalities to date: 327 per 100,000 people (total: 21,911)

14. Wisconsin
> Adults who will likely or definitely refuse vaccination: 12.7% (563,561 total)
> Residents who are fully vaccinated: 3,728,134 (64.1% of population)
> Confirmed cases of COVID-19 to date: 26,577 per 100,000 people (total: 1,545,059)
> COVID-19-related fatalities to date: 219 per 100,000 people (total: 12,739)
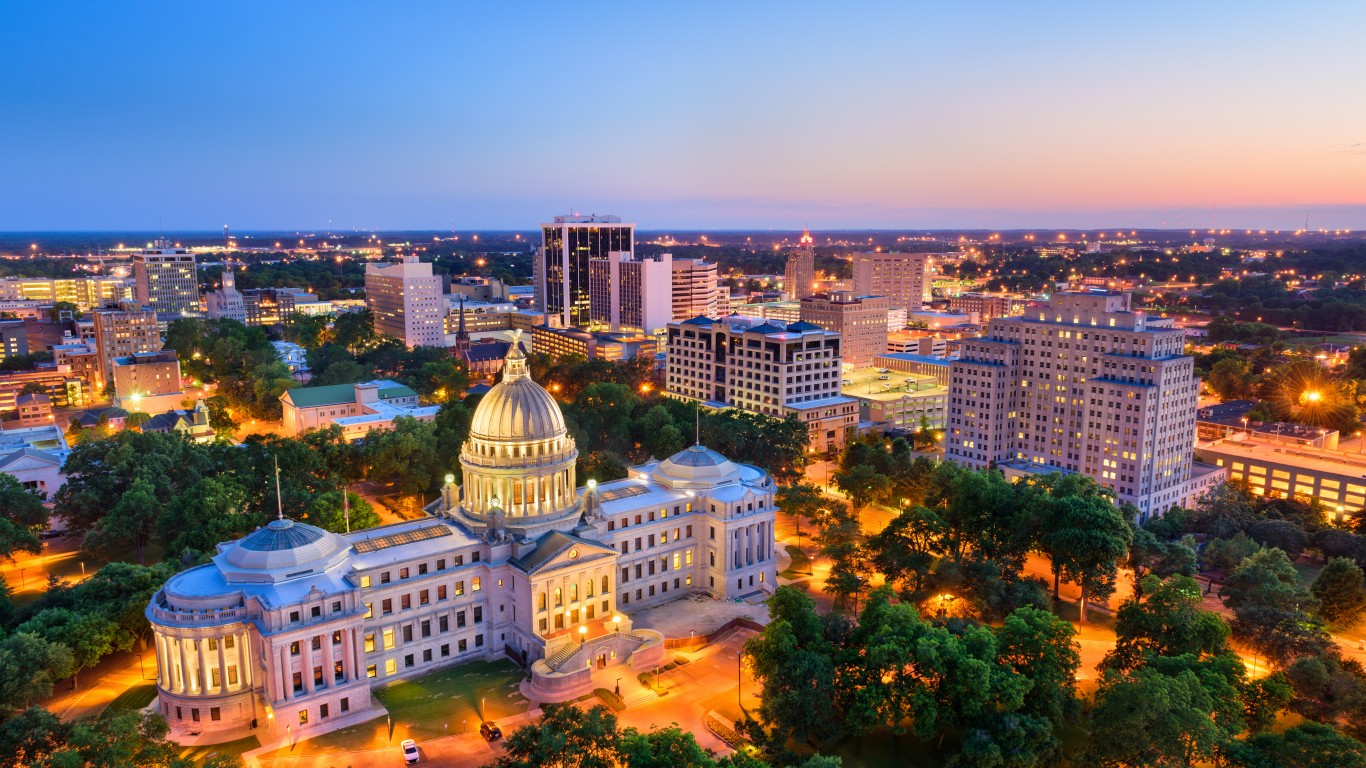
13. Mississippi
> Adults who will likely or definitely refuse vaccination: 13.2% (288,492 total)
> Residents who are fully vaccinated: 1,501,718 (50.3% of population)
> Confirmed cases of COVID-19 to date: 25,800 per 100,000 people (total: 770,522)
> COVID-19-related fatalities to date: 381 per 100,000 people (total: 11,378)
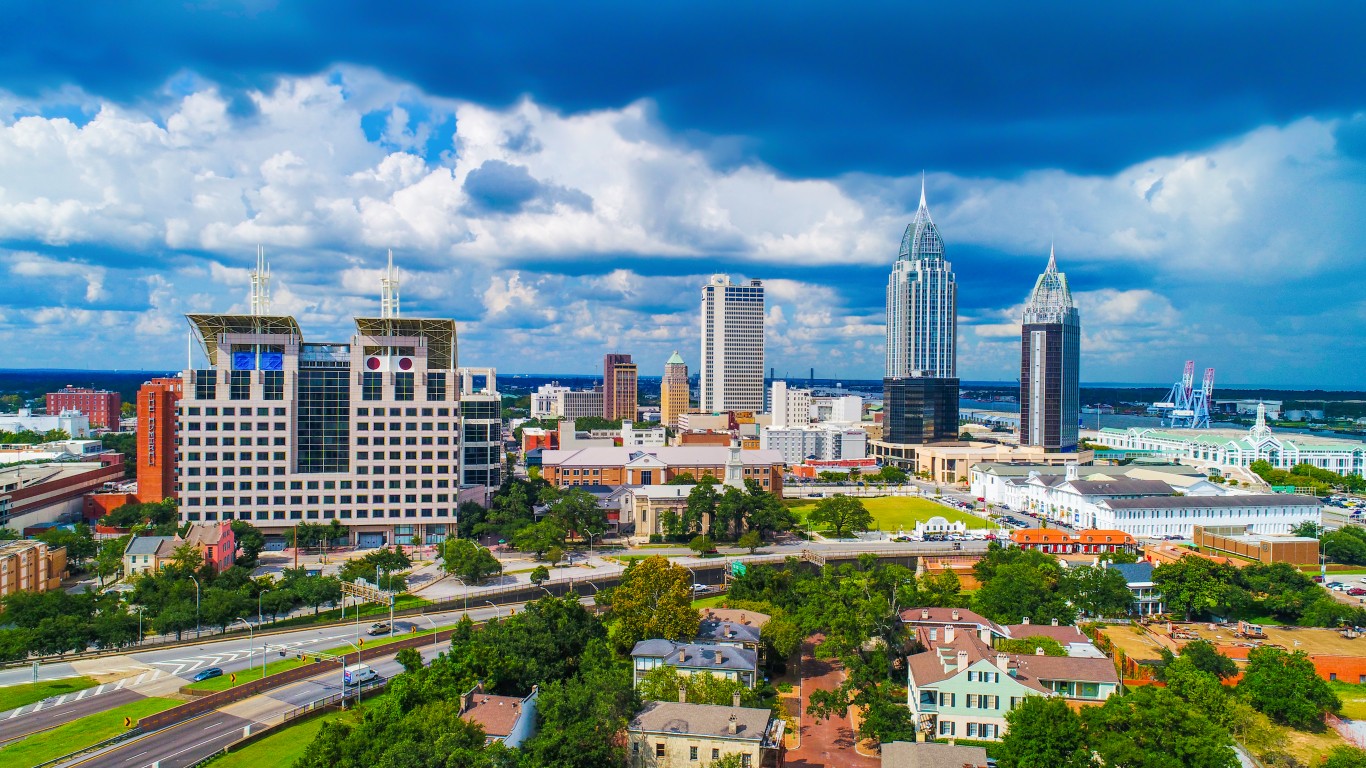
12. Alabama
> Adults who will likely or definitely refuse vaccination: 14.4% (534,489 total)
> Residents who are fully vaccinated: 2,440,010 (49.9% of population)
> Confirmed cases of COVID-19 to date: 25,656 per 100,000 people (total: 1,254,036)
> COVID-19-related fatalities to date: 357 per 100,000 people (total: 17,452)

11. Arkansas
> Adults who will likely or definitely refuse vaccination: 14.8% (332,166 total)
> Residents who are fully vaccinated: 1,599,938 (53.1% of population)
> Confirmed cases of COVID-19 to date: 26,479 per 100,000 people (total: 798,036)
> COVID-19-related fatalities to date: 328 per 100,000 people (total: 9,895)

10. South Carolina
> Adults who will likely or definitely refuse vaccination: 15.9% (630,865 total)
> Residents who are fully vaccinated: 2,844,523 (55.9% of population)
> Confirmed cases of COVID-19 to date: 28,007 per 100,000 people (total: 1,423,919)
> COVID-19-related fatalities to date: 314 per 100,000 people (total: 15,985)

9. West Virginia
> Adults who will likely or definitely refuse vaccination: 16.0% (220,558 total)
> Residents who are fully vaccinated: 1,011,450 (56.0% of population)
> Confirmed cases of COVID-19 to date: 25,812 per 100,000 people (total: 466,125)
> COVID-19-related fatalities to date: 327 per 100,000 people (total: 5,900)

8. Tennessee
> Adults who will likely or definitely refuse vaccination: 16.0% (837,122 total)
> Residents who are fully vaccinated: 3,622,457 (53.5% of population)
> Confirmed cases of COVID-19 to date: 28,772 per 100,000 people (total: 1,947,865)
> COVID-19-related fatalities to date: 342 per 100,000 people (total: 23,149)

7. Oklahoma
> Adults who will likely or definitely refuse vaccination: 16.1% (469,493 total)
> Residents who are fully vaccinated: 2,195,436 (55.7% of population)
> Confirmed cases of COVID-19 to date: 25,373 per 100,000 people (total: 1,000,480)
> COVID-19-related fatalities to date: 315 per 100,000 people (total: 12,425)
6. South Dakota
> Adults who will likely or definitely refuse vaccination: 16.4% (105,378 total)
> Residents who are fully vaccinated: 524,860 (59.5% of population)
> Confirmed cases of COVID-19 to date: 26,226 per 100,000 people (total: 231,379)
> COVID-19-related fatalities to date: 306 per 100,000 people (total: 2,697)

5. Georgia
> Adults who will likely or definitely refuse vaccination: 16.7% (1,326,670 total)
> Residents who are fully vaccinated: 5,654,378 (53.8% of population)
> Confirmed cases of COVID-19 to date: 23,000 per 100,000 people (total: 2,419,503)
> COVID-19-related fatalities to date: 320 per 100,000 people (total: 33,665)
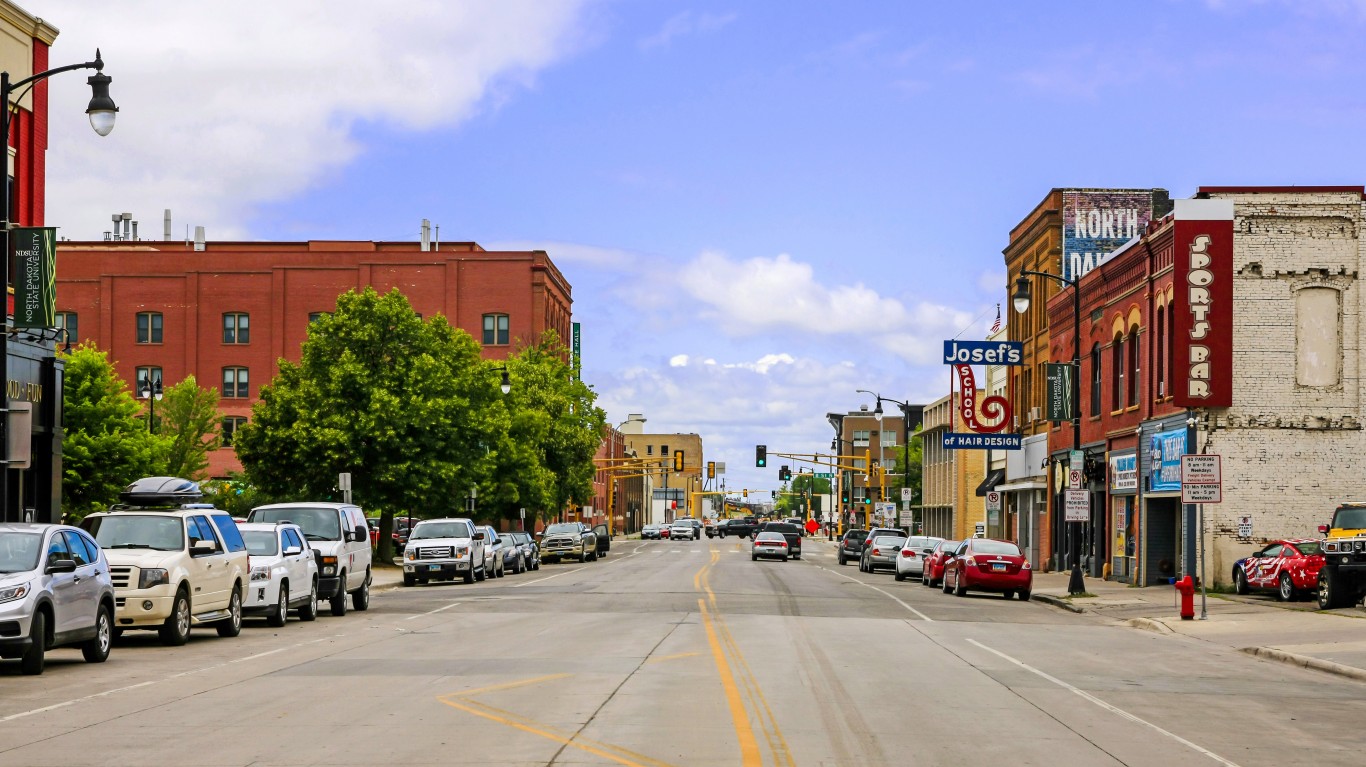
4. North Dakota
> Adults who will likely or definitely refuse vaccination: 18.6% (104,566 total)
> Residents who are fully vaccinated: 412,737 (54.3% of population)
> Confirmed cases of COVID-19 to date: 30,502 per 100,000 people (total: 231,841)
> COVID-19-related fatalities to date: 281 per 100,000 people (total: 2,139)
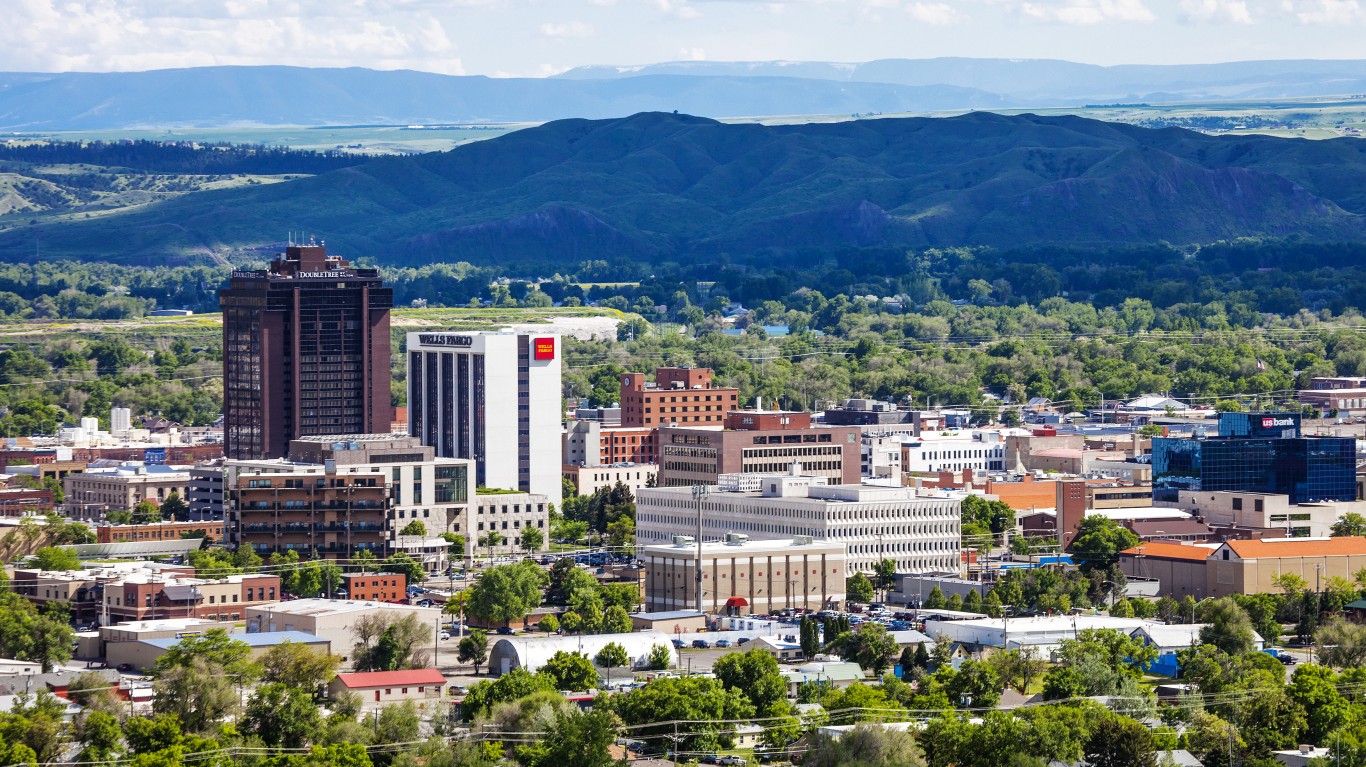
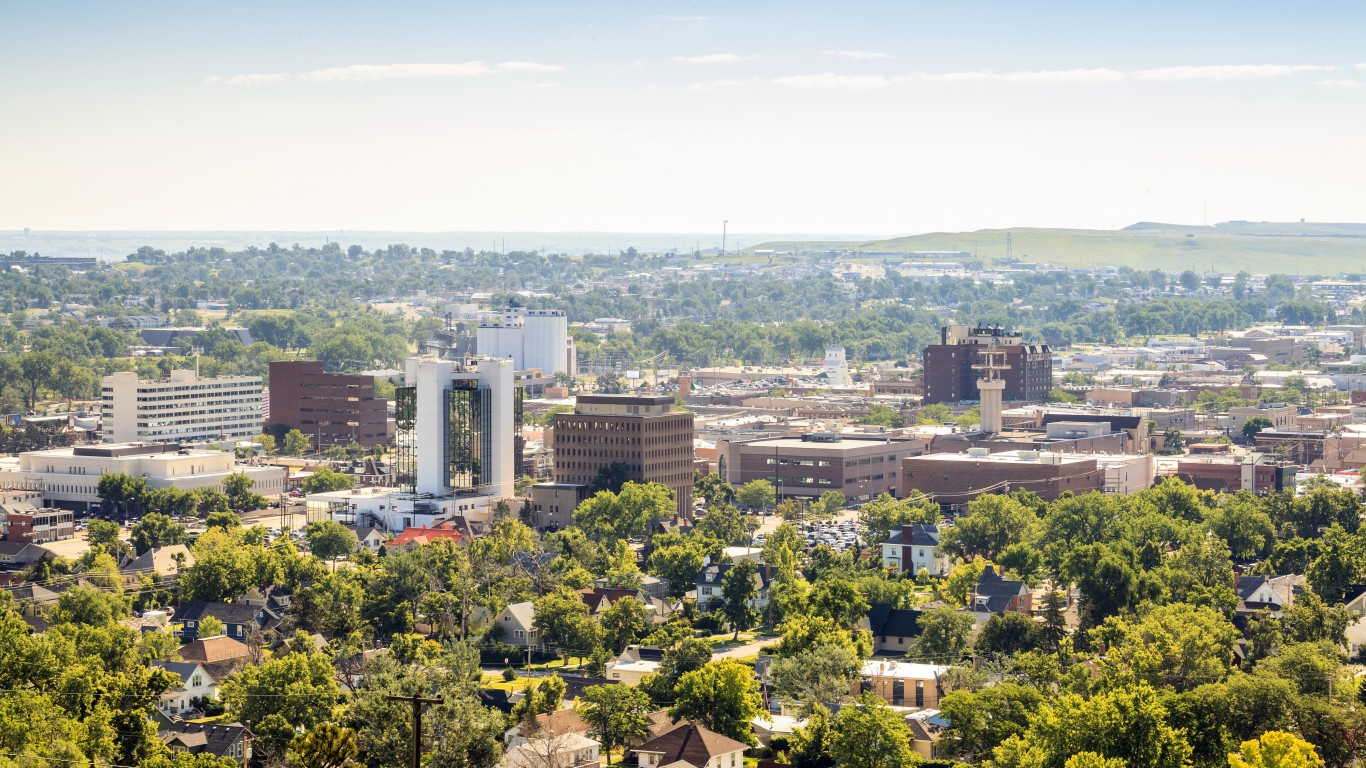
3. Montana
> Adults who will likely or definitely refuse vaccination: 19.6% (161,553 total)
> Residents who are fully vaccinated: 593,476 (55.9% of population)
> Confirmed cases of COVID-19 to date: 23,835 per 100,000 people (total: 253,204)
> COVID-19-related fatalities to date: 286 per 100,000 people (total: 3,043)
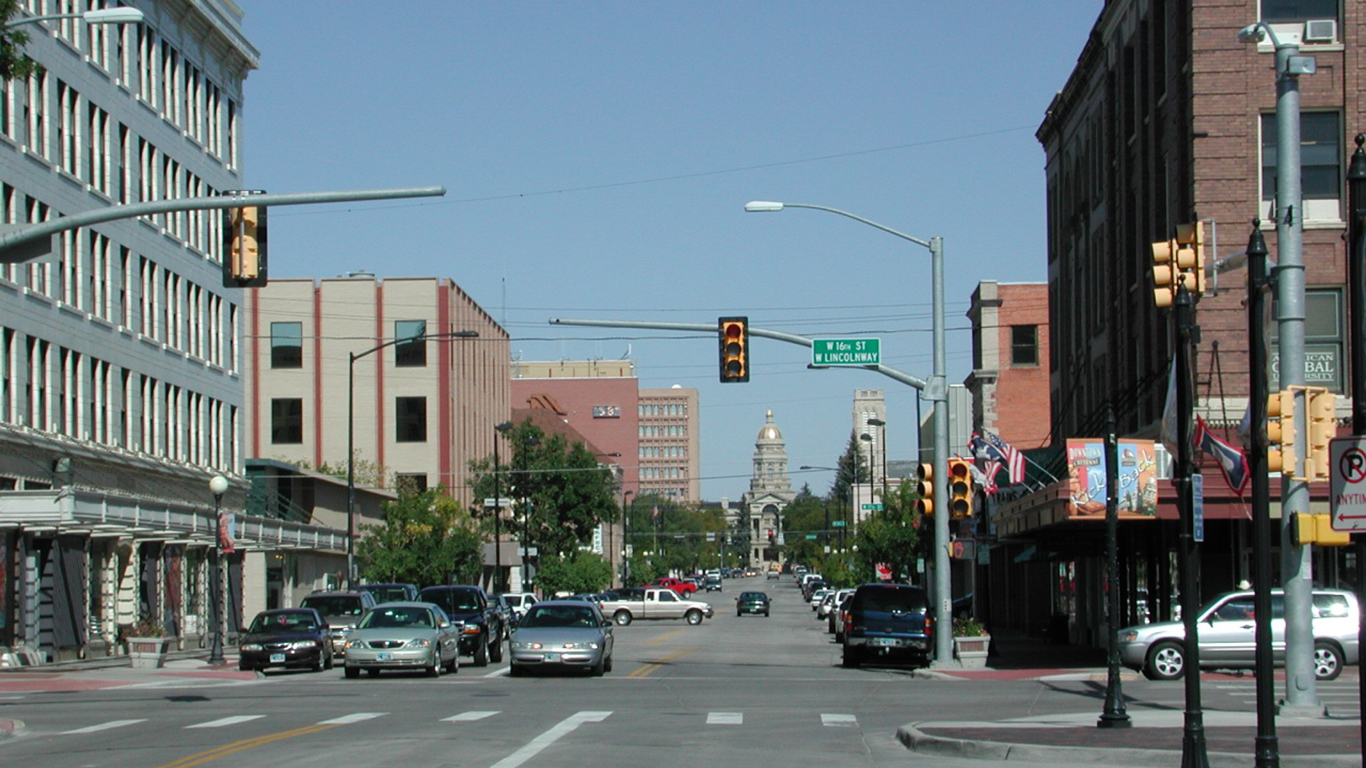
2. Wyoming
> Adults who will likely or definitely refuse vaccination: 19.8% (85,652 total)
> Residents who are fully vaccinated: 290,248 (50.2% of population)
> Confirmed cases of COVID-19 to date: 26,164 per 100,000 people (total: 151,159)
> COVID-19-related fatalities to date: 289 per 100,000 people (total: 1,667)
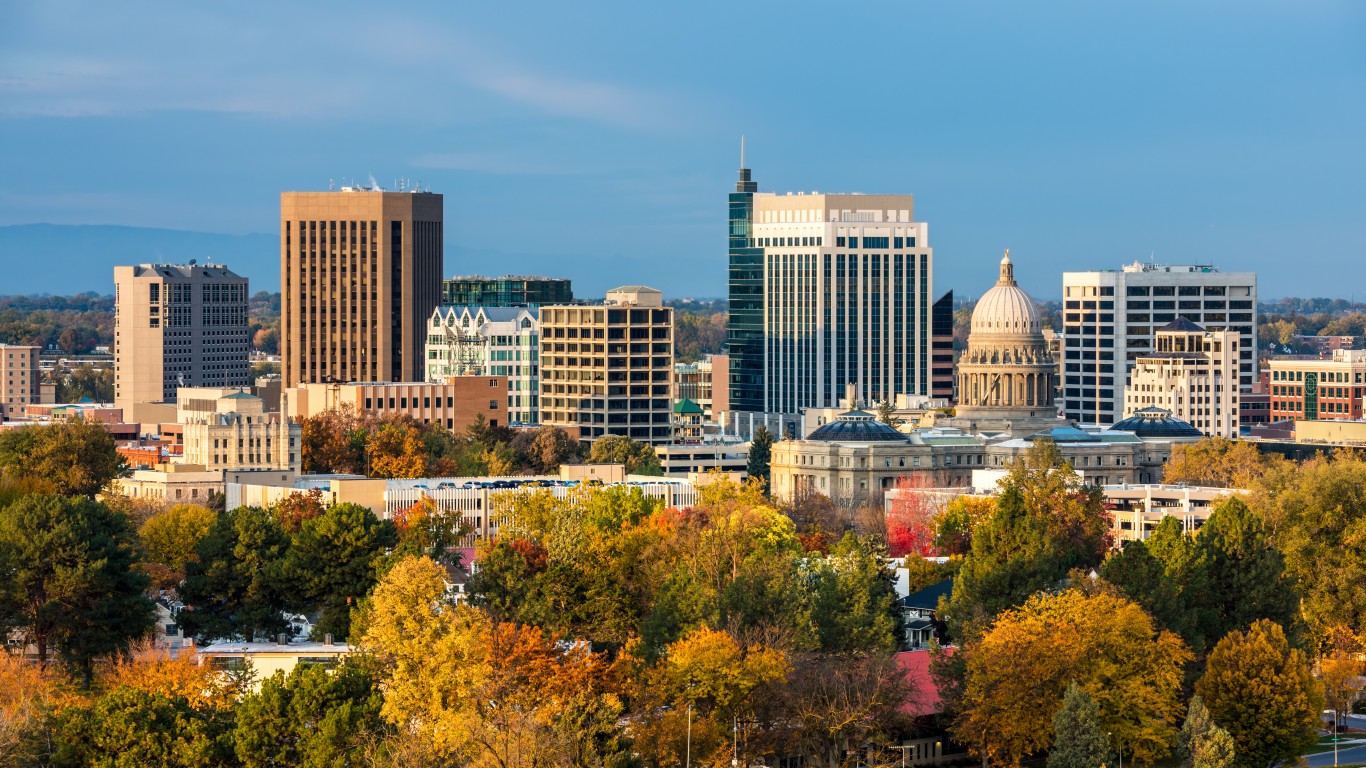
1. Idaho
> Adults who will likely or definitely refuse vaccination: 20.5% (275,831 total)
> Residents who are fully vaccinated: 939,111 (53.5% of population)
> Confirmed cases of COVID-19 to date: 22,538 per 100,000 people (total: 395,366)
> COVID-19-related fatalities to date: 256 per 100,000 people (total: 4,497)
These are all the counties in Idaho where COVID-19 is slowing (and where it’s still getting worse).