The COVID-19 pandemic ushered in a surge of retirements across the U.S. labor force. Experts estimate that in the first 18 months of the pandemic, there were 2.4 million more retirements than there would have otherwise been. Due in part to the historic increase, an estimated 19.3% of the U.S. population were retired as of mid-2021, the largest share in at least the last 25 years.
The two primary reasons older Americans left the workforce for good in recent months were the health risks posed by the pandemic and rising asset values – particularly in housing and the stock market – that made retirement financially feasible. Indeed, health and financial stability are two of many factors that affect overall quality of life throughout old age. Here is a look at what it costs to retire comfortably in every state.
With retirements at historic levels, 24/7 Wall St. created an index of over a dozen key socioeconomic measures to identify the best and worst states to grow old in. The measures were chosen to gauge the health, financial well-being, safety, and social engagement of 65 and older populations in each state. States are ranked from best to worst.
The states that rank as the best places for older Americans to live are generally those that have higher than average life expectancy at age 65, high incomes in retirement age households, safe streets, and high-levels of social engagement, among other attributes. The top states are mostly located in the Northeast and the West. Meanwhile, the worst states are disproportionately concentrated in the South. This is the state where retirees are most likely to move.
It is important to note that this is a ranking of an aggregate of conditions and is not necessarily an accurate reflection of quality of life for older residents of a given state at a personal level.
Click here to see the worst states to grow old in
Click here to read our detailed methodology
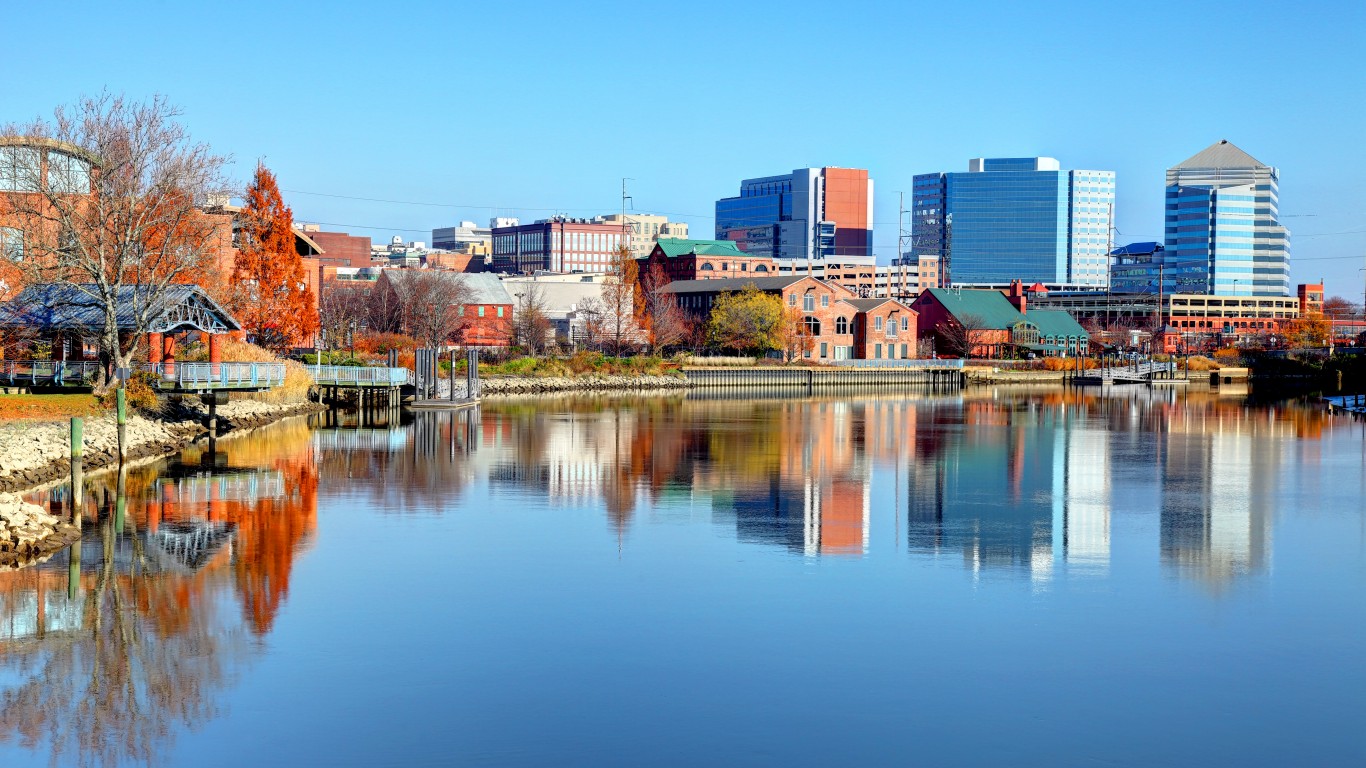
50. Delaware
> Pct. of pop. age 65+: 19.5% (5th highest)
> Avg. earnings 65 & older households: $63,962 per year (14th highest)
> 65 & older homeownership rate: 84.9% (4th highest)
> Life expectancy at age 65: age 84.2 (23rd lowest)
Delaware ranks as the best state in the country for retirement-age Americans, largely due to measures related to financial security. For example, an estimated 71.1% of households 65 and older have retirement income, the largest share of any state. Additionally, Delaware residents benefit from a lower than average cost of living. With high retirement income recipiency and relatively low living costs, only 7.3% of Delaware residents age 65 and up live below the poverty line, well below the comparable 9.4% national rate.
Remaining socially engaged throughout retirement can be critical to overall well-being. In Delaware, the 65 and older population spent an average of 42 hours volunteering in the past year, the fourth highest average among states, and 53.8% of retirement-age residents report doing favors for neighbors at least once per month, the second highest share among states.
[in-text-ad]

49. Hawaii
> Pct. of pop. age 65+: 19.0% (7th highest)
> Avg. earnings 65 & older households: $81,027 per year (the highest)
> 65 & older homeownership rate: 76.6% (10th lowest)
> Life expectancy at age 65: age 86.1 (the highest)
For many Americans, Hawaii represents an ideal place to retire for its tropical climate alone, but the state boasts many additional advantages as well. For many older Americans, driving is not an option, and in much of Hawaii, driving is not a necessity as it is in other parts of the country, as an estimated 9.9% of commuters in the state either walk or use public transportation, a larger share than in all but half a dozen other states.
Hawaii also has a nation-leading life expectancy for retirement age Americans. At age 65, average life expectancy in Hawaii is 21.1 years, the highest of any state and well above the 19.5 year national average.

48. Connecticut
> Pct. of pop. age 65+: 17.6% (16th highest)
> Avg. earnings 65 & older households: $79,202 per year (5th highest)
> 65 & older homeownership rate: 76.0% (8th lowest)
> Life expectancy at age 65: age 85.3 (2nd highest)
Connecticut is the only New England state to rank among the top five states for retirement-age Americans. The state’s high ranking is due in large part to the financial security and health outcomes of the 65 and older population. For example, the average annual earnings among households 65 and older in the state is $79,202 – well above the $63,522 national average.
Life expectancy for retirement-age Connecticut residents is also high. At age 65, average life expectancy in the state is 20.3 years, the second highest of any state and well above the 19.5 year national average.
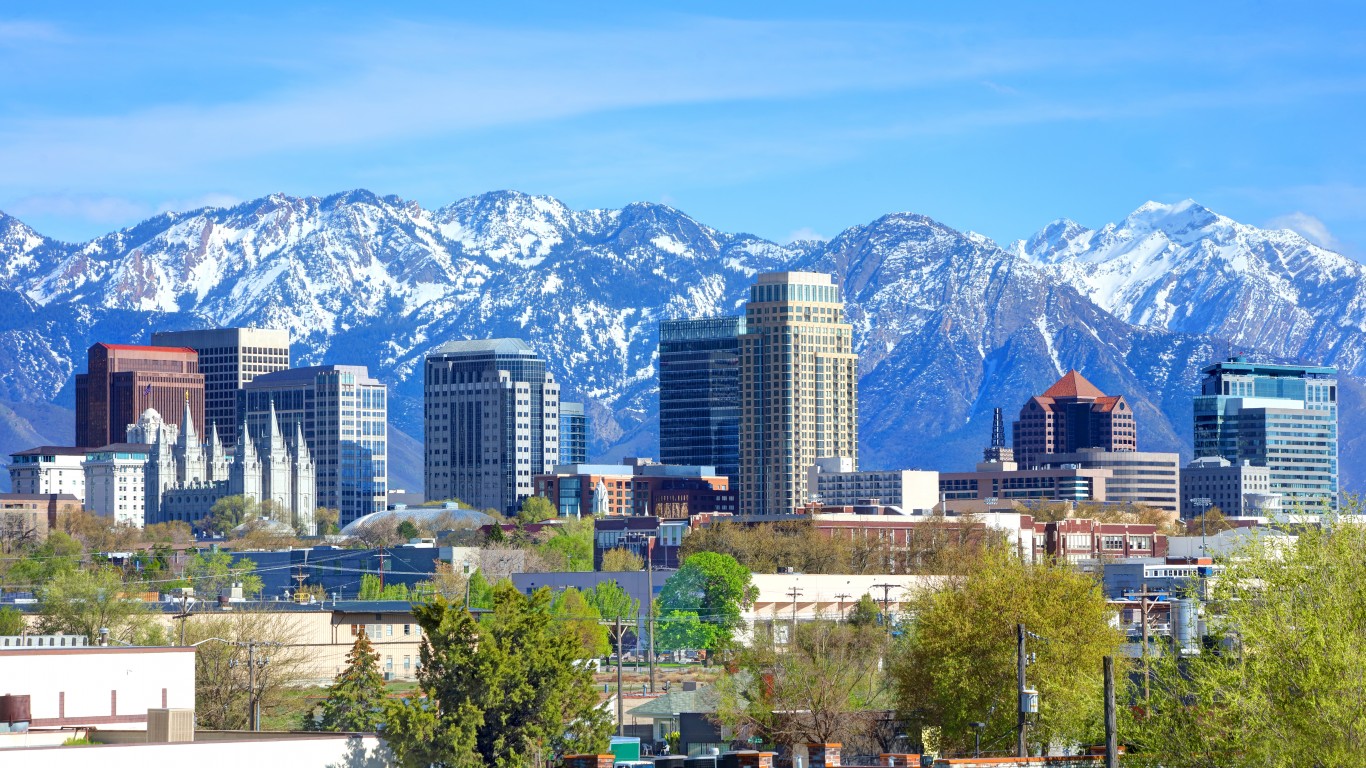
47. Utah
> Pct. of pop. age 65+: 11.4% (the lowest)
> Avg. earnings 65 & older households: $61,313 per year (18th highest)
> 65 & older homeownership rate: 86.4% (the highest)
> Life expectancy at age 65: age 84.5 (16th highest)
Retirement age residents comprise a relatively small proportion of Utah’s total population. Just 11.4% of state residents are 65 or older, the smallest share of any state. Still, by many measures, Utah ranks among the best places for Americans 65 and older. For one, Utah has one of the best funded pension systems in the country, with funding for nearly 92% of its total obligations, more than all but seven other states.
Utah is also a relatively safe state. There were only 261 violent crimes for every 100,000 people in Utah in 2020, compared to 399 per 100,000 nationwide. Older Utah residents are also more likely to be financially secure. More than two-thirds of 65 and older households in the state have retirement income, the fifth largest share among states, and only 6.2% of retirement age state residents live below the poverty line, the third smallest share among states. The cost of living in Utah is also about 5% less than the national average.
[in-text-ad-2]
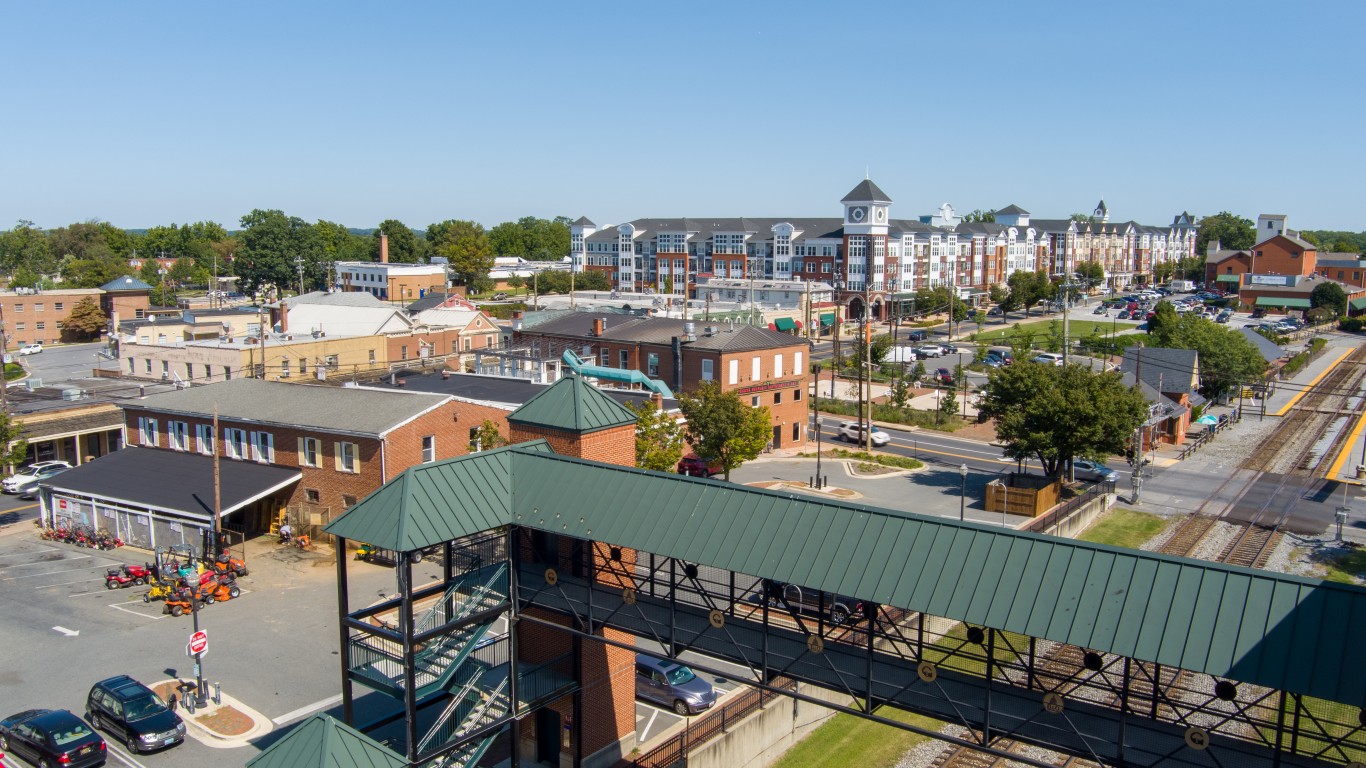
46. Maryland
> Pct. of pop. age 65+: 15.9% (9th lowest)
> Avg. earnings 65 & older households: $80,477 per year (2nd highest)
> 65 & older homeownership rate: 76.9% (12th lowest)
> Life expectancy at age 65: age 84.4 (22nd highest)
Maryland’s ranking as the fifth best state in the country for retirement age Americans is due in large part to financial security. The average annual earnings among 65 and older households in the state is $80,477 – well above the $63,522 national average. Additionally, more than two-thirds of 65 and older households in the state have retirement income, the third largest share among states.
Remaining socially engaged throughout retirement can be critical to overall well-being. In Maryland, residents 65 and older belong to an average of 2.5 groups and organizations, more than in all but two other states. Additionally, retirement age Marylanders spent an average of 33 hours volunteering in the past year, compared to the national average of less than 26 hours.

45. Massachusetts
> Pct. of pop. age 65+: 17.0% (25th highest)
> Avg. earnings 65 & older households: $76,131 per year (7th highest)
> 65 & older homeownership rate: 71.7% (3rd lowest)
> Life expectancy at age 65: age 84.9 (7th highest)
Massachusetts ranks as the sixth best state to grow old in and the second best in the Northeast. The state’s advantages include a relatively healthy older population. At age 65, average life expectancy in Massachusetts is 19.9 years, higher than in all but half a dozen states.
Older Massachusetts residents are also among the most likely to be socially engaged with their community. Retirement age residents in the state belong to an average of 2.52 groups and organizations, the most of any state. Additionally, retirement age Massachusetts residents spent an average of 30 hours volunteering in the past year, compared to the national average of less than 26 hours.
[in-text-ad]

44. New York
> Pct. of pop. age 65+: 16.9% (25th lowest)
> Avg. earnings 65 & older households: $79,339 per year (4th highest)
> 65 & older homeownership rate: 64.9% (the lowest)
> Life expectancy at age 65: age 85.2 (4th highest)
New York ranks among the 10 best states for retirement age Americans, in part because of the strong health outcomes. At age 65, average life expectancy in New York is 20.2 years, higher than in all but three other states.
About half of all New York state residents live in New York City, a place that offers many advantages for older Americans. For one, the city is walkable and boasts the largest public transit system in the United States – a significant plus for many retirement age Americans who do not want, or are no longer able, to drive.

43. Washington
> Pct. of pop. age 65+: 15.9% (8th lowest)
> Avg. earnings 65 & older households: $66,581 per year (11th highest)
> 65 & older homeownership rate: 77.4% (14th lowest)
> Life expectancy at age 65: age 84.8 (10th highest)
Washington ranks among the top 10 best states for older Americans, partially because it is a relatively safe state. There were 294 violent crimes reported in Washington for every 100,000 people in 2020, well below the national violent crime rate of 399 per 100,000.
Older Americans also tend to live longer than average in Washington state. Average life expectancy at age 65 is 19.8 years in Washington, higher than in most other states.
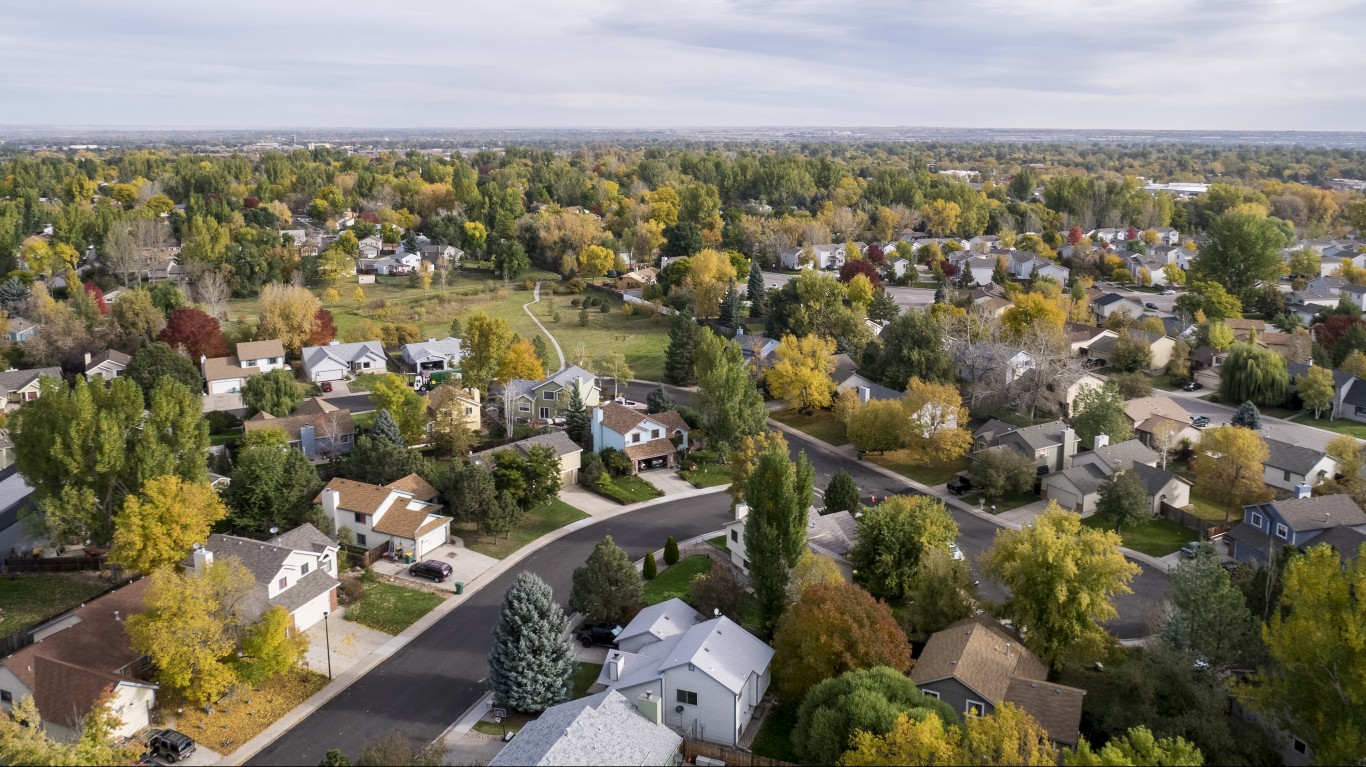
42. Colorado
> Pct. of pop. age 65+: 14.7% (5th lowest)
> Avg. earnings 65 & older households: $64,403 per year (13th highest)
> 65 & older homeownership rate: 81.1% (18th highest)
> Life expectancy at age 65: age 85.0 (5th highest)
Colorado ranks as a better place than most other states for older Americans, largely because of high levels of social engagement, which can be important for overall well-being, especially throughout retirement. The 65 and older population in Colorado spent an average of 46 hours volunteering in the past year, the second highest average among states, and 54.3% of retirement age residents report doing favors for neighbors at least once per month, the largest share among states.
Older Americans living in Colorado are also more likely than the average older American nationwide to be financially secure. The average earnings among 65 and older households in the state of $64,403 is about $1,000 higher than the national average, and the 7.2% poverty rate among the state’s 65 and older population is well below the 9.4% rate nationwide.
[in-text-ad-2]

41. Vermont
> Pct. of pop. age 65+: 20.1% (4th highest)
> Avg. earnings 65 & older households: $54,525 per year (22nd lowest)
> 65 & older homeownership rate: 80.5% (24th highest)
> Life expectancy at age 65: age 84.8 (10th highest)
Vermont is one of four states in the Northeast to rank among the 10 best places for older Americans to live, partially because of the relative financial security many older state residents have. For example, 42.2% of 65 and older households have some form of income, compared to 38.0% nationwide. Additionally, the 6.1% poverty rate among retirement age residents in Vermont is the lowest in the country.
Vermont also has one of the largest concentrations of retirement age residents in the country, with 20.1% of the population in the 65 and older age group – the third largest share among states.

40. New Hampshire
> Pct. of pop. age 65+: 18.6% (9th highest)
> Avg. earnings 65 & older households: $62,642 per year (17th highest)
> 65 & older homeownership rate: 76.9% (12th lowest)
> Life expectancy at age 65: age 84.5 (16th highest)
Access to health care becomes increasingly important for older age Americans who typically need more frequent preventive care and treatment. In New Hampshire, a nation-leading 90% of adults have a personal doctor, well above the 80% share of all American adults.
Another reason New Hampshire ranks as a better state than most for older Americans is the relative financial security of the 65 and older population. An estimated 63.3% of households in that age group have retirement income, compared to 58.8% nationwide, and 6.2% of the state’s retirement age population live below the poverty line, compared to 9.4% nationwide.
[in-text-ad]

39. Wisconsin
> Pct. of pop. age 65+: 17.5% (18th highest)
> Avg. earnings 65 & older households: $46,908 per year (2nd lowest)
> 65 & older homeownership rate: 77.0% (13th lowest)
> Life expectancy at age 65: age 84.5 (16th highest)
Wisconsin offers several advantages for older Americans – particularly those who are retired and living on a fixed income, as the cost of living in the state is about 7% less than the national average. Additionally, retired public sector workers in Wisconsin have the added benefit of one of the best funded pension systems in the country. Wisconsin is one of only two states in the country with funding for the entirety of its pension obligations.
Older Wisconsin residents are also more likely than average to report high levels of social engagement, which can be important for overall well-being, especially throughout retirement. The 65 and older population in Wisconsin spent an average of 36 hours volunteering in the past year, 11 hours more than the national average, and 49.5% of retirement age residents report doing favors for neighbors at least once per month, the ninth largest highest share among states.

38. New Jersey
> Pct. of pop. age 65+: 16.6% (21st lowest)
> Avg. earnings 65 & older households: $79,112 per year (6th highest)
> 65 & older homeownership rate: 74.2% (6th lowest)
> Life expectancy at age 65: age 84.9 (7th highest)
New Jersey ranks among the top 15 best states for older Americans, partially because it is one of the safest states in the country. There were 195 violent crimes reported in New Jersey for every 100,000 people in 2020, well below the national violent crime rate of 399 per 100,000. Older New Jersey residents are also more likely than most older Americans to be relatively affluent. The average earnings among 65 and older households in the state is over $79,000, while the average income among 65 and older households nationwide is about $63,500.
Older Americans also tend to live longer than average in New Jersey. Average life expectancy at age 65 is 19.9 years in New Jersey, higher than in all but half a dozen other states.

37. Oregon
> Pct. of pop. age 65+: 18.2% (10th highest)
> Avg. earnings 65 & older households: $54,612 per year (23rd lowest)
> 65 & older homeownership rate: 77.5% (15th lowest)
> Life expectancy at age 65: age 84.7 (12th highest)
Oregon ranks as a better place than most other states for older Americans, largely because of high levels of social engagement, which can be important for overall well-being, especially throughout retirement. The 65 and older population in Oregon spent an average of 39 hours volunteering in the past year, the fifth highest average among states, and 47.2% of retirement age residents report doing favors for neighbors at least once per month, well above the 40.7% share of older Americans nationwide.
Oregon is also a relatively safe state. There were 292 violent crimes reported in Oregon for every 100,000 people in 2020, well below the national violent crime rate of 399 per 100,000.
[in-text-ad-2]

36. Virginia
> Pct. of pop. age 65+: 15.9% (10th lowest)
> Avg. earnings 65 & older households: $68,435 per year (10th highest)
> 65 & older homeownership rate: 80.7% (23rd highest)
> Life expectancy at age 65: age 84.3 (24th highest)
Virginia ranks among the better states to grow old in, partially because of low crime rates and relative financial security. There were only 209 violent crimes in the state for every 100,000 people in 2020, well below the national violent crime rate of 399 per 100,000. Additionally, the average annual earnings among 65 and older households in the state of $68,435 is 10th highest in the country.
Older Virginians are also more likely than most retirement age Americans to be socially engaged. Virginia residents 65 and older belong to an average of 2.4 groups or organizations, the fifth highest such average among states.

35. Minnesota
> Pct. of pop. age 65+: 16.3% (18th lowest)
> Avg. earnings 65 & older households: $53,272 per year (20th lowest)
> 65 & older homeownership rate: 78.4% (20th lowest)
> Life expectancy at age 65: age 85.0 (5th highest)
Minnesota has one of the healthiest retirement age populations in the country. Average life expectancy at age 65 in the state is 20 years, one of the highest averages of any state and half a year longer than the national average.
By some measures, older Minnesotans are also more likely than most Americans 65 and older to be financially secure. Only 7.4% of the retirement age population live below the poverty line, compared to the national 65 and older poverty rate of 9.4%. Additionally, retired public sector workers in Minnesota have the added benefit of a well funded pension system. With funding for 82.2% of its pension obligations, Minnesota has a better funded pension than all but 13 other states.
[in-text-ad]

34. Maine
> Pct. of pop. age 65+: 21.3% (the highest)
> Avg. earnings 65 & older households: $48,025 per year (4th lowest)
> 65 & older homeownership rate: 78.2% (19th lowest)
> Life expectancy at age 65: age 84.1 (21st lowest)
Maine has the largest retirement age population in the country. Some 21.3% of the population are 65 and older, compared to 16.5% of the U.S. population. Maine also ranks better than most other states as a place for older Americans to live.
Maine residents – including retirees on a fixed income – benefit from a low cost of living. Goods and services are about 3% less expensive in the state than they are on average nationwide. Maine’s retirement age residents are also more likely to be financially secure than most older Americans. Only 8.5% of the retirement age population live below the poverty line, compared to the national 65 and older poverty rate of 9.4%.
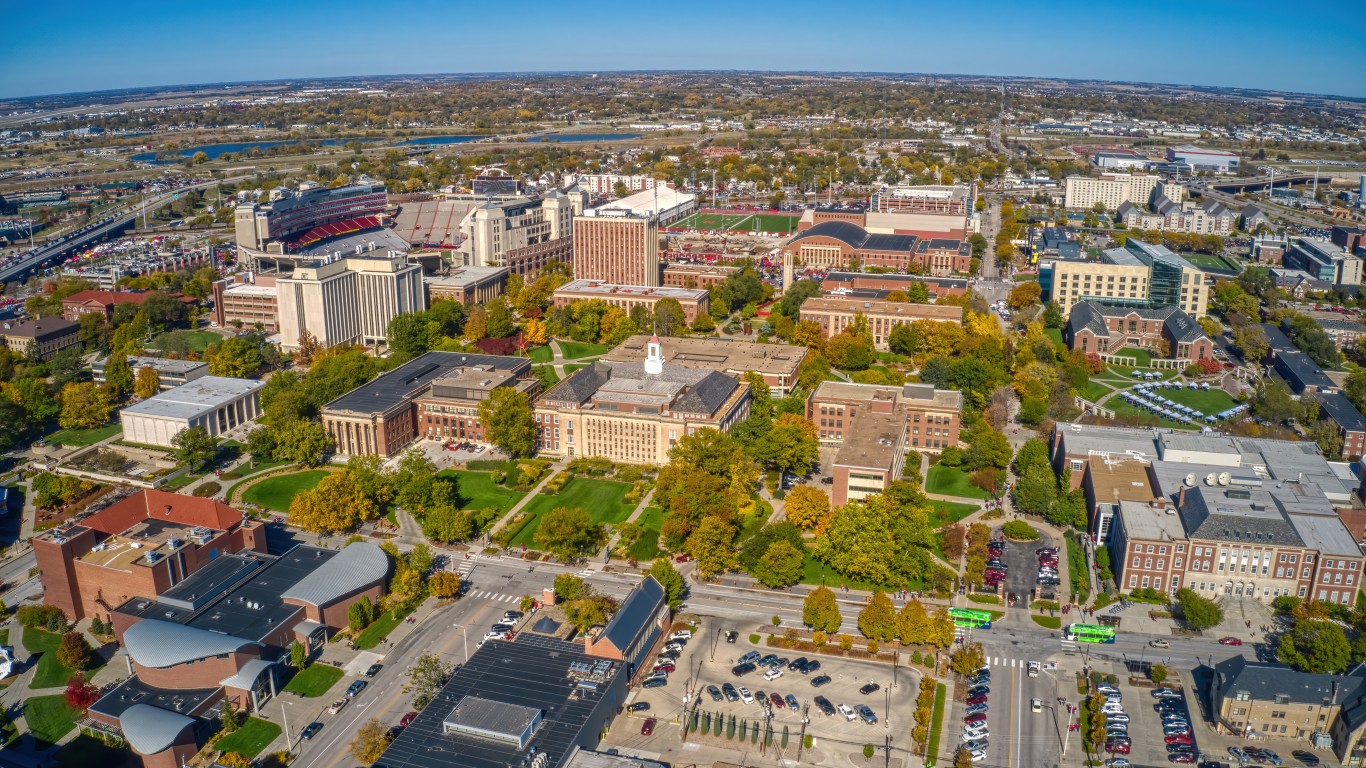
33. Nebraska
> Pct. of pop. age 65+: 16.1% (15th lowest)
> Avg. earnings 65 & older households: $54,249 per year (21st lowest)
> 65 & older homeownership rate: 77.7% (17th lowest)
> Life expectancy at age 65: age 84.3 (24th highest)
Retired public sector workers in Nebraska benefit from one of the best funded pension systems in the country. With funding for 93.1% of its pension obligations, Nebraska has a better funded pension than all but six other states. Nebraska’s retirement age residents are also more likely to be financially secure than most older Americans. Only 8.1% of the retirement age population live below the poverty line, compared to the national 65 and older poverty rate of 9.4%.
Remaining socially engaged throughout retirement can be critical to overall well-being. In Nebraska, the 65 and older population spent an average of 38 hours volunteering in the past year, the sixth highest average among states, and 50.5% of retirement age residents report doing favors for neighbors at least once per month, the seventh highest share among states.

32. Pennsylvania
> Pct. of pop. age 65+: 18.7% (8th highest)
> Avg. earnings 65 & older households: $59,513 per year (22nd highest)
> 65 & older homeownership rate: 77.6% (16th lowest)
> Life expectancy at age 65: age 84.1 (21st lowest)
Pennsylvania has a larger retirement age population than most states. Some 18.7% of the population are 65 and older, compared to 16.5% of the U.S. population. Pennsylvania also ranks better than most other states as a place for older Americans to live.
Pennsylvania residents – including retirees on a fixed income – benefit from a low cost of living. Goods and services are about 2% less expensive in the state than they are on average nationwide. Pennsylvania’s retirement age population are also more likely to be socially engaged than most older Americans. About 50% of retirement age residents report doing favors for neighbors at least once per month, the eighth highest share among states.
[in-text-ad-2]

31. Florida
> Pct. of pop. age 65+: 20.9% (2nd highest)
> Avg. earnings 65 & older households: $60,598 per year (20th highest)
> 65 & older homeownership rate: 82.4% (8th highest)
> Life expectancy at age 65: age 84.9 (7th highest)
Much of Florida has a warm climate year-round, making it an attractive state for retired Americans from northern states. Partially as a result, 20.9% of the state’s population are 65 and older, the second largest share of any state. Retirement age Floridians are also relatively healthy. Average life expectancy at age 65 in the state is about 20 years, one of the highest averages of any state and half a year longer than the national average.
Florida also has some disadvantages, however. The state’s cost of living is slightly higher than the national average, which can put additional financial strain on retirees living on a fixed income. Additionally, 10.7% of Florida’s 65 and older population live below the poverty line, a larger share than in all but five other states.

30. Rhode Island
> Pct. of pop. age 65+: 17.7% (15th highest)
> Avg. earnings 65 & older households: $69,256 per year (9th highest)
> 65 & older homeownership rate: 70.0% (2nd lowest)
> Life expectancy at age 65: age 84.5 (16th highest)
Rhode Island ranks better than most states as a place for older Americans. One of Rhode Island’s benefits is the relative lack of crime. There were 231 violent crimes in the state for every 100,000 people in 2020, well below the national violent crime rate of 399 incidents per 100,000 people.
Access to health care becomes increasingly important for older age Americans who typically need more frequent preventive care and treatment. In Rhode Island, a near nation-leading 89.9% of adults have a personal doctor, well above the 80% share of all American adults. Likely partially as a result, retirement age Rhode Islanders are also relatively healthy. Average life expectancy at age 65 in the state is about 19.5 years, one of the higher averages among states.
[in-text-ad]
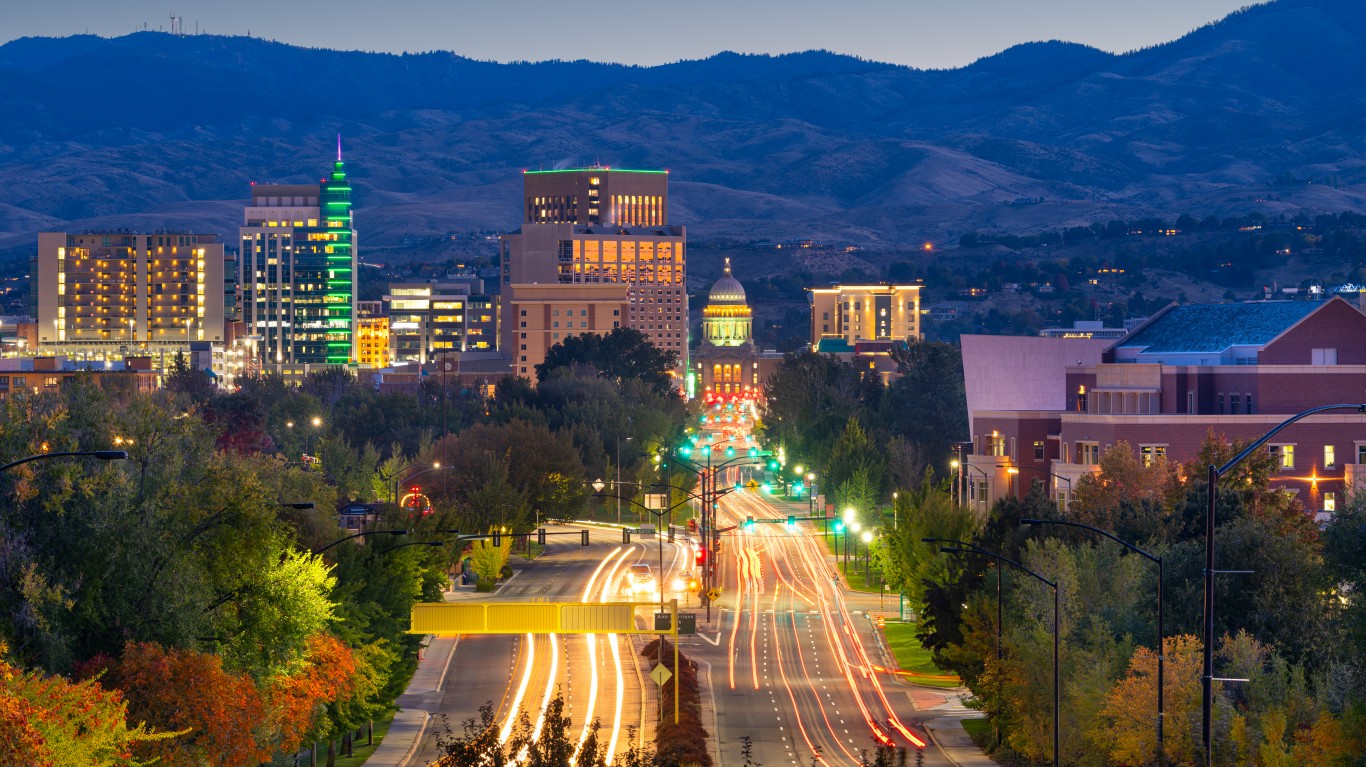
29. Idaho
> Pct. of pop. age 65+: 16.2% (16th lowest)
> Avg. earnings 65 & older households: $52,216 per year (16th lowest)
> 65 & older homeownership rate: 83.9% (6th highest)
> Life expectancy at age 65: age 84.3 (24th highest)
Idaho ranks close to the middle of the 50 states as a place for older Americans to live. Advantages include a low crime rate. There were 243 violent crimes in the state for every 100,000 people in 2020, well below the national violent crime rate of 399 incidents per 100,000 people. Idaho residents – particularly those who are retired and living on a fixed income – also benefit from a low cost of living. Goods and services are about 9% less expensive in Idaho than they are nationwide on average.
Other indicators in Idaho are less favorable. For example, the average annual earnings among 65 and older households in the state is $52,216, over $11,000 less than the comparable national average.
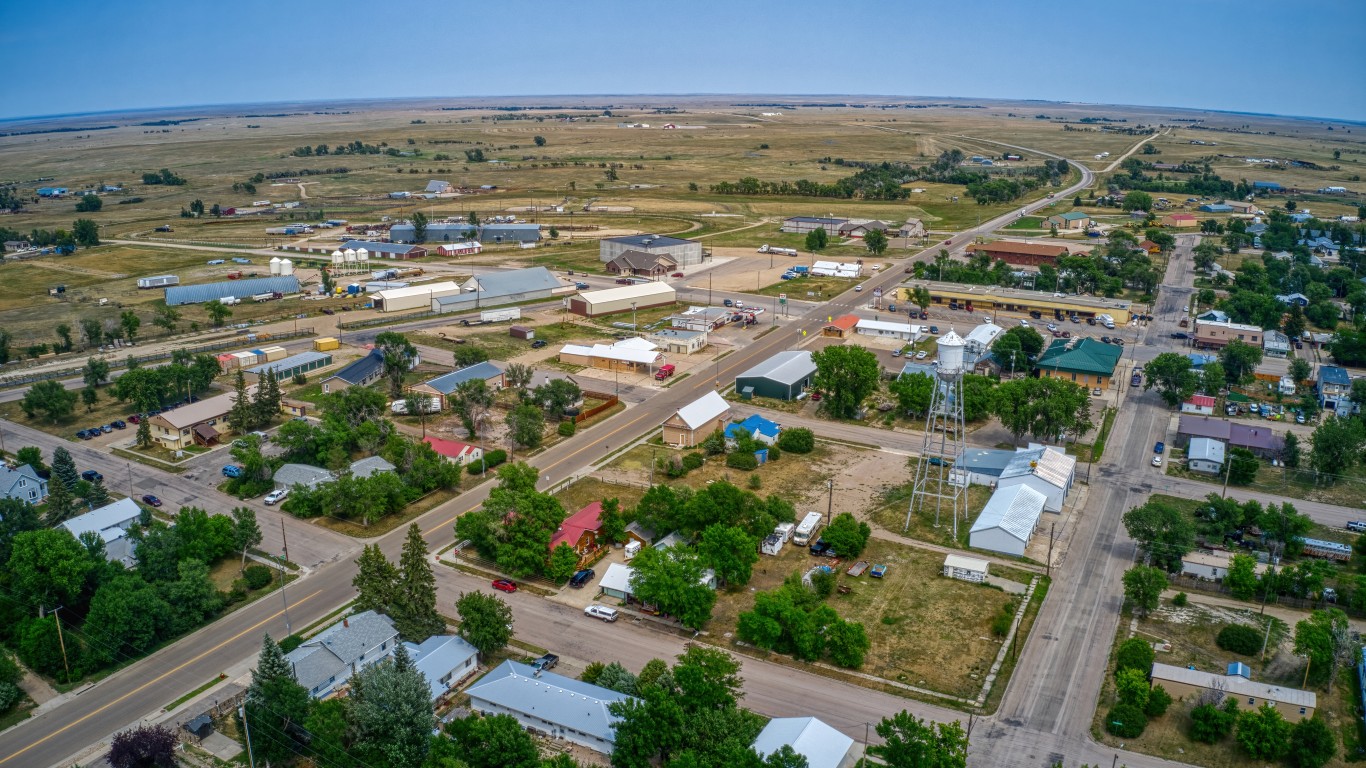
28. South Dakota
> Pct. of pop. age 65+: 17.4% (21st highest)
> Avg. earnings 65 & older households: $48,100 per year (5th lowest)
> 65 & older homeownership rate: 76.5% (9th lowest)
> Life expectancy at age 65: age 84.7 (12th highest)
South Dakota ranks close to the middle of the 50 states as a place for older Americans to live. One considerable disadvantage retirement age South Dakotans face are low incomes. The average annual earnings among 65 and older households in the state is $48,100, fifth lowest among states and well below the national average of $63,522.
Still, state residents – particularly those who are retired and living on a fixed income – benefit from a low cost of living. Goods and services are about 8.5% less expensive in Idaho than they are nationwide on average. Additionally, retired public sector workers in South Dakota have the added benefit of one of the best funded pension systems in the country. Along with Wisconsin, South Dakota is one of only two states in the country with funding for the entirety of its pension obligations.

27. California
> Pct. of pop. age 65+: 14.8% (6th lowest)
> Avg. earnings 65 & older households: $80,459 per year (3rd highest)
> 65 & older homeownership rate: 72.7% (5th lowest)
> Life expectancy at age 65: age 85.3 (2nd highest)
Much of the southern half of California has a warm climate year-round, making it an attractive option for many retired Americans. Additionally, retirement age Californians are also relatively healthy. Average life expectancy at age 65 in the state is 20.3 years, the second highest average among states.
California is not without some drawbacks, however. Goods and services are about 10% more expensive across California than they are nationwide, on average. A high cost of living can put added financial strain on retirees living on a fixed income. Older Californians are also less likely than average to remain socially engaged. Only about 31% of retirement age residents report doing favors for neighbors at least once per month, the third smallest share among states.
[in-text-ad-2]

26. Iowa
> Pct. of pop. age 65+: 17.5% (17th highest)
> Avg. earnings 65 & older households: $49,521 per year (8th lowest)
> 65 & older homeownership rate: 80.4% (25th highest)
> Life expectancy at age 65: age 84.3 (24th highest)
Iowa ranks in the middle of all states for its favorability as a place for older Americans to live. Advantages include a relatively low cost of living. Goods and services are about 9% less expensive in Iowa than they are nationwide on average. A low cost of living can improve financial security for retirees, and across Iowa, only 7.4% of the 65 and older population live below the poverty line, compared to 9.4% of older Americans nationwide.
Still, incomes among older Iowa residents tend to be relatively modest. The average earnings of households 65 and older in the state of $49,521 per year is considerably lower than the national average of $63,522. By some measures, older Iowans are also less likely to be socially engaged than most older Americans. For example, the 65 and older population in Iowa spent an average of 21 hours volunteering in the past year, nearly five hours less than the national average.

25. Michigan
> Pct. of pop. age 65+: 17.7% (14th highest)
> Avg. earnings 65 & older households: $52,137 per year (15th lowest)
> 65 & older homeownership rate: 82.0% (11th highest)
> Life expectancy at age 65: age 83.9 (18th lowest)
As is the case in much of the Midwest, Michigan has a relatively low cost of living, which can be especially important for retirees living on a fixed income. Goods and services in the state are about 6% less expensive than they are on average nationwide. Michigan’s 65 and older population are also less likely than average to live below the poverty line and are more likely to have a source of retirement income.
Older Michigan residents tend to have poorer health outcomes than the typical retirement age American. Life expectancy at age 65 in the state is 18.9 years, over half a year below the national average.
[in-text-ad]
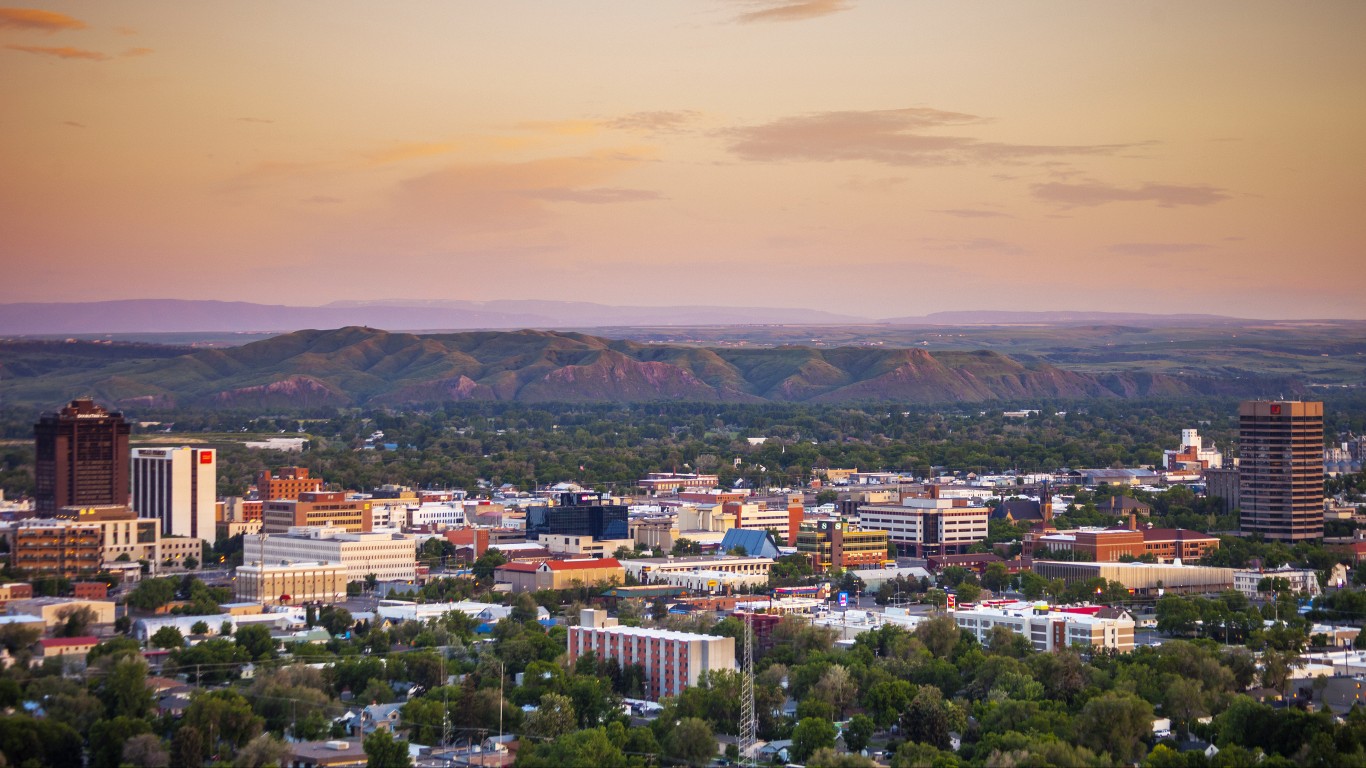
24. Montana
> Pct. of pop. age 65+: 19.5% (6th highest)
> Avg. earnings 65 & older households: $48,370 per year (6th lowest)
> 65 & older homeownership rate: 81.7% (13th highest)
> Life expectancy at age 65: age 84.5 (16th highest)
Montana ranks close to the middle of the 50 states as a place for older Americans to live. Advantages include a high level of social engagement among older state residents. In Montana, residents 65 and older belong to an average of 2.5 groups and organizations, the second highest average of any state. Additionally, nearly one in every five Montana residents are 65 or older, one of the largest such shares of any state.
Disadvantages in the state include a relatively high violent crime rate. There were 470 violent crimes reported in the state for every 100,000 people in 2020, higher than in all but 10 other states. Older Montana residents are also more likely than the typical retirement age American to have a disability, and adults in the state are also less likely to report having a personal doctor than the typical American adult.

23. Illinois
> Pct. of pop. age 65+: 16.1% (14th lowest)
> Avg. earnings 65 & older households: $62,797 per year (15th highest)
> 65 & older homeownership rate: 78.0% (18th lowest)
> Life expectancy at age 65: age 84.4 (22nd highest)
Illinois ranks in the bottom half of all states for quality of life for the 65 and older population. Though state residents 65 and older are more likely than most older Americans to have some form of retirement income, pension payments for retired public sector workers in the state are on relatively shaky ground. Illinois has funding for only about 40% of its pension obligations, the smallest share of any state.
Older Illinois residents living in and around the city of Chicago have access to a reliable public transit system, which can be critical for older Americans who are no longer able to drive. Disadvantages in the area, however, include high rates of crime. Due in no small part to criminal violence in Chicago, the Illinois’ violent crime rate of 426 incidents per 100,000 people is higher than in most states and above the 399 per 100,000 national rate.
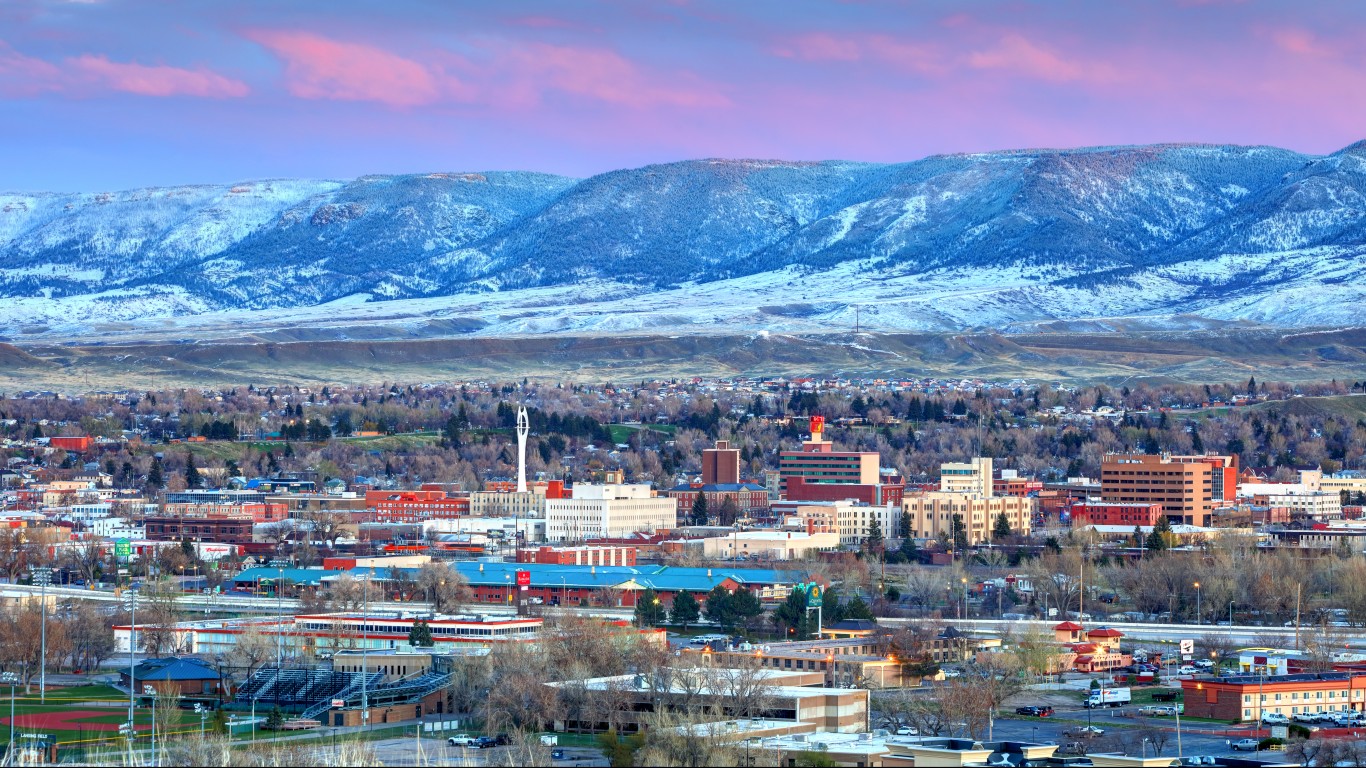
22. Wyoming
> Pct. of pop. age 65+: 17.1% (24th highest)
> Avg. earnings 65 & older households: $52,054 per year (14th lowest)
> 65 & older homeownership rate: 84.7% (5th highest)
> Life expectancy at age 65: age 84.0 (19th lowest)
Wyoming residents, particularly retirees on a fixed income, benefit from a low cost of living. Goods and services in the state are about 8% less expensive than they are nationwide on average. Still, financial security may be harder for many older Wyoming residents to achieve as the average earnings among households 65 and older is just $52,054, about $11,500 less than the national average.
Health outcomes among Wyoming’s older population are also below average. Life expectancy at age 65 in the state is just 19 years, about half a year below the national average. Poor health outcomes may be partially attributable to limited access to care. A reported 27% of adults in Wyoming do not have a personal doctor, the fifth largest share among states and well above the 20% of adults nationwide.
[in-text-ad-2]

21 Arizona
> Pct. of pop. age 65+: 18.0% (13th highest)
> Avg. earnings 65 & older households: $57,469 per year (24th highest)
> 65 & older homeownership rate: 81.7% (13th highest)
> Life expectancy at age 65: age 84.6 (15th highest)
Much of Arizona has a warm climate year-round, making it an attractive option for many retired Americans. Indeed, 18.0% of Arizona’s population are 65 or older, a larger share than in most other states and the 16.5% national average. Still, in other ways, older Americans in Arizona face some noteworthy disadvantages.
Arizona has a far higher violent crime rate than much of the rest of the country. There were 485 violent crimes for every 100,000 people in the state in 2020, well above the national violent crime rate of 399 per 100,000. Additionally, by some measures, older Arizona residents are less likely to be socially engaged than other older Americans. Only 80% of the state’s 65 and older population spend time with their family regularly compared to 83% of all older Americans, and 38% of Arizona’s 65 and older population report doing favors for neighbors at least once a month, compared to about 41% of all older Americans.

20. Ohio
> Pct. of pop. age 65+: 17.5% (19th highest)
> Avg. earnings 65 & older households: $50,402 per year (9th lowest)
> 65 & older homeownership rate: 78.8% (21st lowest)
> Life expectancy at age 65: age 83.4 (12th lowest)
Ohio ranks as a worse place for older Americans to live than most other states. Though Ohio residents benefit from a low cost of living – about 8% below the national average – earnings for older residents are far below average. The typical 65 and older household in the state earns $50,402 a year, about $13,000 less than the comparable national median.
By some measures, older Ohio residents appear to have poorer health outcomes than most older Americans, as average life expectancy at age 65 in the state of 18.4 years is the 12th lowest in the country and over a year below the national average.
[in-text-ad]

19. North Carolina
> Pct. of pop. age 65+: 16.7% (23rd lowest)
> Avg. earnings 65 & older households: $52,481 per year (17th lowest)
> 65 & older homeownership rate: 80.9% (22nd highest)
> Life expectancy at age 65: age 83.7 (15th lowest)
North Carolina ranks as a worse place for older Americans to live than most other states. Though North Carolinians benefit from a low cost of living – about 8% below the national average – earnings for older residents are far below average. The typical 65 and older household in the state earns $52,481 a year, about $11,000 less than the comparable national median.
North Carolina has a slightly higher violent crime rate than the average nationwide. There were 419 violent crimes for every 100,000 people in the state in 2020, compared to the national violent crime rate of 399 per 100,000.

18. South Carolina
> Pct. of pop. age 65+: 18.2% (11th highest)
> Avg. earnings 65 & older households: $51,372 per year (10th lowest)
> 65 & older homeownership rate: 85.3% (2nd highest)
> Life expectancy at age 65: age 83.6 (13th lowest)
South Carolina ranks behind most other states in quality of life measures for older Americans, partly because of poor health outcome measures. For example, average life expectancy at age 65 in the state of 18.6 years is the 13th lowest in the country and about a year below the national average. Older South Carolinians are also more likely than most retirement age Americans to live below the poverty line.
South Carolina also ranks among the most dangerous states in the country based on crime statistics. There were 531 violent crimes for every 100,000 people in the state in 2020, the seventh highest among states and well above the national violent crime rate of 399 per 100,000.

17. Kansas
> Pct. of pop. age 65+: 16.4% (20th lowest)
> Avg. earnings 65 & older households: $53,081 per year (19th lowest)
> 65 & older homeownership rate: 79.4% (23rd lowest)
> Life expectancy at age 65: age 83.8 (16th lowest)
Based on key socioeconomic measures, Kansas ranks behind most of the rest of the county as a place for older Americans to live. For one, life expectancy at age 65 in the state of 18.8 years is lower than in most states and nearly a year less than the national average. Social engagement can be key to overall well-being throughout retirement, and older Kansas residents, by some measures, are less likely to be socially engaged than most older Americans. For example, Kansas residents 65 and older spent an average of just 19 hours volunteering in the last year, nearly seven hours less than the national average.
Kansas is also more dangerous than most states based on crime statistics. There were 425 violent crimes for every 100,000 people in the state in 2020, the seventh highest among states and well above the national violent crime rate of 399 per 100,000.
[in-text-ad-2]

16. Alaska
> Pct. of pop. age 65+: 12.4% (2nd lowest)
> Avg. earnings 65 & older households: $69,443 per year (8th highest)
> 65 & older homeownership rate: 81.0% (20th highest)
> Life expectancy at age 65: age 84.2 (23rd lowest)
Only 12.4% of Alaska’s population are 65 or older, the second smallest share of any state. Disadvantages for many retirement age Americans in Alaska extend beyond the state’s cold climate. For one, with a violent crime rate of 838 incidents per 100,000 people, Alaska is the most dangerous state in the country and the only state with a violent crime rate that is more than double the 399 per 100,000 national rate.
Alaska also has a higher cost of living than the average nationwide, which can add strain to the budgets of retired Americans living on a fixed income. Goods and services are 3.2% more expensive in Alaska than they are nationwide, on average.

15. Indiana
> Pct. of pop. age 65+: 16.1% (13th lowest)
> Avg. earnings 65 & older households: $51,950 per year (13th lowest)
> 65 & older homeownership rate: 81.7% (13th highest)
> Life expectancy at age 65: age 83.3 (9th lowest)
Indiana ranks as a worse place for older Americans to live than most other states. Though Indiana residents benefit from a low cost of living – about 7.5% below the national average – earnings for older residents are far below average. The typical 65 and older household in the state earns $51,950 a year, about $11,600 less than the comparable national average.
Additionally, social engagement can be key to overall well-being throughout retirement, and older Indiana residents, by some measures, are less likely to be socially engaged than most older Americans. For example, just 19% of Indiana’s 65 and older population report doing something positive for the community in the past year, compared to 23% of all retirement age Americans.
[in-text-ad]

14. North Dakota
> Pct. of pop. age 65+: 15.8% (7th lowest)
> Avg. earnings 65 & older households: $62,662 per year (16th highest)
> 65 & older homeownership rate: 75.4% (7th lowest)
> Life expectancy at age 65: age 84.7 (12th highest)
Only 15.8% of North Dakota’s population are 65 or older, one of the smallest shares of any state. Indeed, North Dakota ranks among the 15 worst states to grow old in. This is partly because of limited financial security among the state’s retirement age population. Just 48.2% of 65 and older households in the state have retirement income, the smallest share of any state.
Older Americans typically need more frequent medical treatment and preventative health care. In North Dakota, 27.4% of adults report not having a personal doctor, a larger share than in all but three other states and well above the 20.1% share of adults nationwide.

13. Georgia
> Pct. of pop. age 65+: 14.3% (4th lowest)
> Avg. earnings 65 & older households: $59,751 per year (21st highest)
> 65 & older homeownership rate: 79.9% (25th lowest)
> Life expectancy at age 65: age 83.4 (12th lowest)
Based on key socioeconomic measures, Georgia ranks behind most of the rest of the county as a place for older Americans to live. For one, life expectancy at age 65 in the state of 18.4 years is lower than in most states and over a year less than the national average. Social engagement can be key to overall well-being throughout retirement, and older Georgians, by some measures, are less likely to be socially engaged than most older Americans. For example, Georgia residents 65 and older spent an average of just 24 hours volunteering in the last year, about two hours less than the national average.
Additionally, even though residents benefit from a low cost of living – about 5.5% below the national average – financial insecurity is more common than average among retirement age residents. The 65 and older poverty rate in Georgia of 10.4% is higher than in all but 10 other states and a full percentage point above the national average.

12. Missouri
> Pct. of pop. age 65+: 17.2% (23rd highest)
> Avg. earnings 65 & older households: $51,940 per year (12th lowest)
> 65 & older homeownership rate: 79.4% (23rd lowest)
> Life expectancy at age 65: age 83.4 (12th lowest)
Missouri ranks behind most other states in quality of life measures for older Americans, partly because of poor health outcome measures. For example, average life expectancy at age 65 in the state of 18.4 years is the 12th lowest in the country and over a year below the national average.
By some measures, older Missouri residents are also less likely than most retirement age Americans to be socially engaged. Missouri residents 65 and older belong to an average of 1.9 groups or organizations, the fifth smallest such average among states.
[in-text-ad-2]

11. West Virginia
> Pct. of pop. age 65+: 20.5% (3rd highest)
> Avg. earnings 65 & older households: $45,532 per year (the lowest)
> 65 & older homeownership rate: 85.2% (3rd highest)
> Life expectancy at age 65: age 82.6 (5th lowest)
Relative to most states, West Virginia has few advantages for older Americans as a place to live. For one, life expectancy at age 65 in the state is just 17.6 years, the fifth lowest of any state and about two years less than the national average.
Financial security also appears to be beyond the reach of a larger than average share of older West Virginia residents. Though West Virginians benefit from a low cost of living – about 12% below the national average – earnings for older residents are far below average. The typical 65 and older household in the state earns $45,532 a year, the lowest of any state about $18,000 less than the comparable national average.

10. Tennessee
> Pct. of pop. age 65+: 16.7% (22nd lowest)
> Avg. earnings 65 & older households: $55,990 per year (25th lowest)
> 65 & older homeownership rate: 82.3% (9th highest)
> Life expectancy at age 65: age 82.9 (8th lowest)
Tennessee ranks as the 10th worst state for older Americans, partially because of the high prevalence of crime. With a violent crime rate of 673 incidents per 100,000 people, Tennessee is the third dangerous state in the country. For context, the national violent crime rate is 399 per 100,000.
Health outcomes are also below average for older Tennessee residents. Life expectancy at age 65 in the state is just 17.9 years, one of the lowest of any state and over a year and a half less than the national average. Older Tennessee residents are also more likely to live below the poverty line and less likely to have retirement income than the typical American age 65 or older.
[in-text-ad]

9. New Mexico
> Pct. of pop. age 65+: 18.0% (12th highest)
> Avg. earnings 65 & older households: $58,485 per year (23rd highest)
> 65 & older homeownership rate: 81.9% (12th highest)
> Life expectancy at age 65: age 84.5 (16th highest)
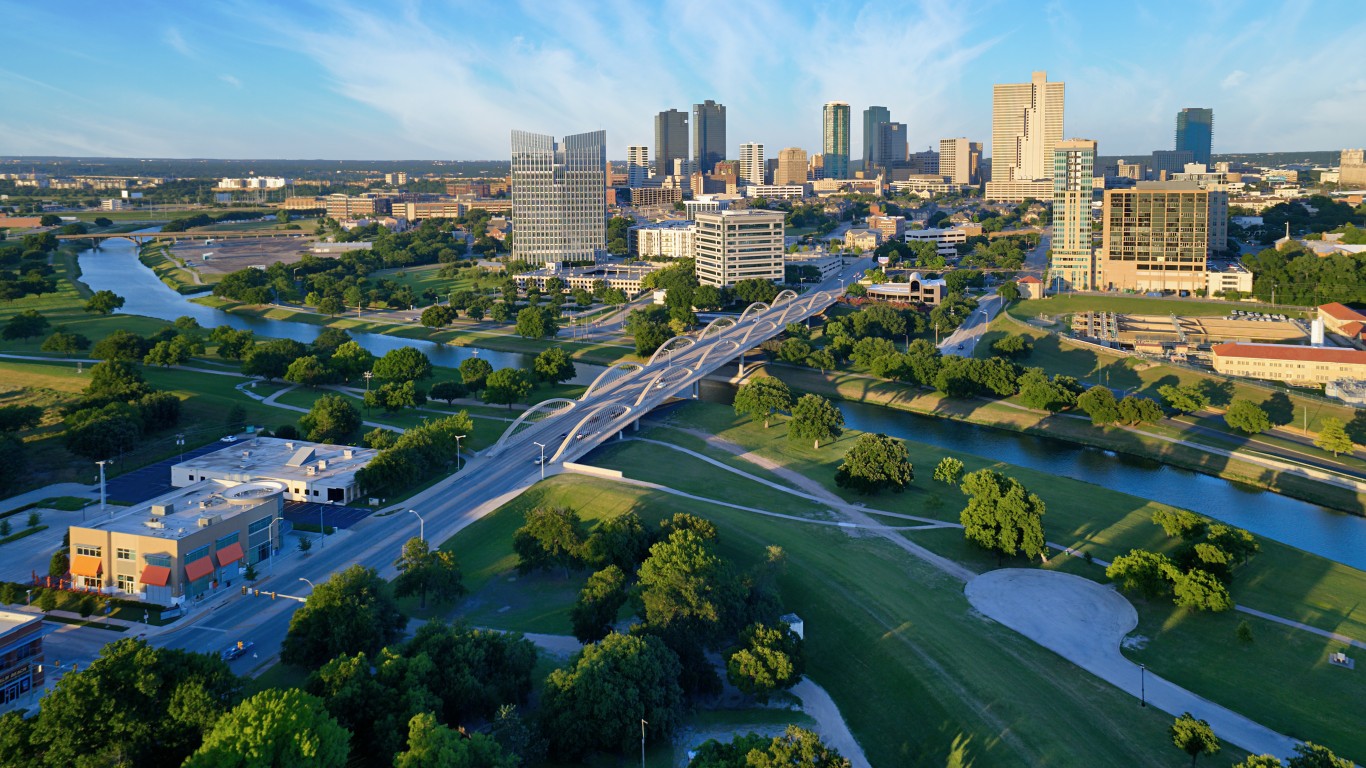
New Mexico ranks among the 10 worst states to grow old in, partially because of relatively widespread financial insecurity among retirement age residents. The poverty rate among New Mexicans 65 and older of 13.5% is the highest of any state and over 4 percentage points above the national rate. New Mexico is also among the most dangerous states. There were 778 violent crimes reported per 100,000 people in the state in 2020, the most in the lower 48 states. For context, the national violent crime rate is 399 per 100,000.
Older Americans typically need more frequent medical treatment and preventative health care. In New Mexico, 25.3% of adults report not having a personal doctor, a larger share than in all but five other states and well above the 20.1% share of adults nationwide.
8. Texas
> Pct. of pop. age 65+: 12.9% (3rd lowest)
> Avg. earnings 65 & older households: $64,589 per year (12th highest)
> 65 & older homeownership rate: 79.6% (24th lowest)
> Life expectancy at age 65: age 83.9 (18th lowest)
Financial insecurity is more common among Texas’ retirement age population than it is nationwide. An estimated 10.6% of Texans 65 and older live below the poverty line, and only 51.7% of 65 and older households in the state have retirement income, compared to the national figures of 9.4% and 58.8%, respectively.
Older Texas residents are also statistically more likely to be the victim of a violent crime than most Americans. There were 446 violent crimes reported per 100,000 people in the state in 2020, well above the national violent crime rate of 399 per 100,000.

7. Alabama
> Pct. of pop. age 65+: 17.4% (20th highest)
> Avg. earnings 65 & older households: $51,601 per year (11th lowest)
> 65 & older homeownership rate: 83.4% (7th highest)
> Life expectancy at age 65: age 82.6 (5th lowest)
Alabama ranks poorly in a number of key measures of quality of life for older Americans. For example, though Alabama residents benefit from a low cost of living – about 11% below the national average – they are more likely than average to live below the poverty line. A reported 10.5% of Alamabans 65 and older live below the poverty line, more than 1 percentage point above the 9.4% national rate and the eighth highest old age poverty rate among states.
By some measures, older Alabama residents are also less likely than average to remain socially engaged. Only about 33% of retirement age residents report doing favors for neighbors at least once per month, the fourth smallest share among states.
[in-text-ad-2]

6. Oklahoma
> Pct. of pop. age 65+: 16.1% (12th lowest)
> Avg. earnings 65 & older households: $61,091 per year (19th highest)
> 65 & older homeownership rate: 81.5% (17th highest)
> Life expectancy at age 65: age 82.6 (5th lowest)
Only five states rank worse as a place for older Americans to live than Oklahoma. Remaining socially engaged throughout retirement can be critical to overall well-being, and some key measures of social engagement for older Americans are far below average in Oklahoma. For example, only about 36% of retirement age residents report doing favors for neighbors at least once per month, well below the 41% share of older Americans nationwide. Additionally, Oklahoma residents 65 and older belong to an average of 2.0 groups and organizations, the 10th smallest share among states.
Health outcomes are also below average for older Oklahoma residents. Life expectancy at age 65 in the state is just 17.6 years, the fifth lowest of any state and about two years below the national average.

5. Nevada
> Pct. of pop. age 65+: 16.2% (17th lowest)
> Avg. earnings 65 & older households: $56,563 per year (25th highest)
> 65 & older homeownership rate: 72.0% (4th lowest)
> Life expectancy at age 65: age 83.7 (15th lowest)
Nevada ranks as the fifth worst state in the country for older Americans. Disadvantages in the state include a far higher than average violent crime rate. There were 460 violent crimes for every 100,000 people in Nevada in 2020, compared to 399 per 100,000 nationwide. Health outcomes for older state residents are also worse than average. Life expectancy at age 65 in the state is just 18.7 years, nearly a year below the national average.
Levels of social engagement among older Nevadans are also low. Only 69.3% of the state population 65 and older spends time with family at least a few times per week, the smallest share of any state, and only 29.7% of Nevada’s 65 and older population report doing a favor for their neighbors at least once a month, the second smallest share of any state.
[in-text-ad]

4. Louisiana
> Pct. of pop. age 65+: 16.0% (11th lowest)
> Avg. earnings 65 & older households: $55,809 per year (24th lowest)
> 65 & older homeownership rate: 81.1% (18th highest)
> Life expectancy at age 65: age 82.9 (8th lowest)
Based on a number of key measures, Louisiana ranks as the fourth worst state for older Americans. The state’s low ranking is due in part to health outcomes, as Louisiana is one of only eight states nationwide where life expectancy at age 65 is below 18 years. Retirement age Louisiana residents are also far less likely to be financially secure than most older Americans, as the poverty rate among state residents 65 and older of 13.2% is the second highest in the country.
Levels of social engagement among older Louisiana residents is also low. Retirement age residents in the state belong to an average of just 1.8 groups and organizations, the second lowest average of any state. Additionally, retirement age Louisiana residents spent an average of only 12 hours volunteering in the past year, the lowest average among states and less than half the comparable 26 hour national average.
3. Kentucky
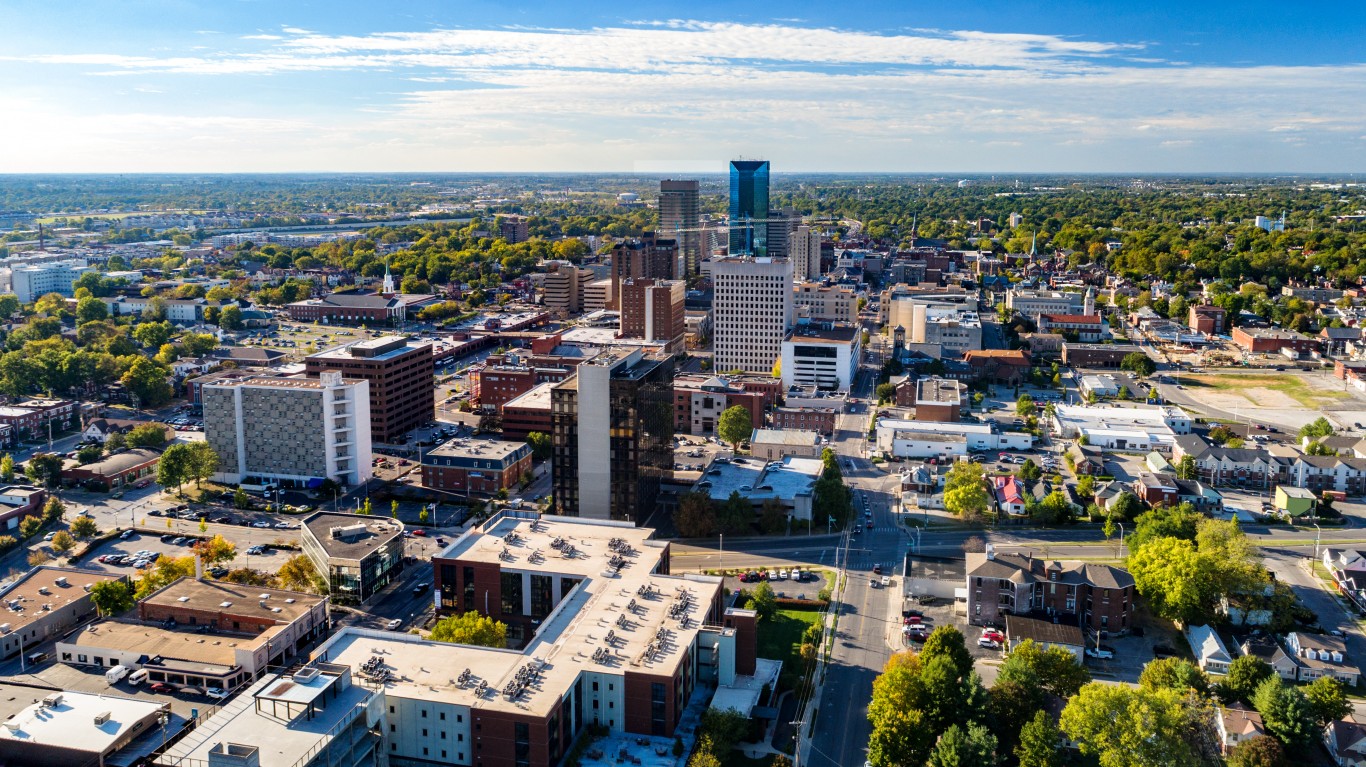
> Pct. of pop. age 65+: 16.9% (24th lowest)
> Avg. earnings 65 & older households: $52,989 per year (18th lowest)
> 65 & older homeownership rate: 81.6% (16th highest)
> Life expectancy at age 65: age 82.5 (the lowest)
Kentucky ranks as the third worst state for older Americans, in part because of worse than average health outcomes. Life expectancy at age 65 in Kentucky is just 17.5 years, the lowest in the country and two years below the national average.
Financial security is also elusive for many older Kentucky residents. The poverty rate among those 65 and older in the state of 11.6% is the fifth highest in the country and well above the 9.4% national rate. Additionally, the average annual earnings among 65 and older Kentucky households stands at just under $53,000, about $10,500 below the national average. Former public sector employees relying on a pension are drawing from one of the worst funded state pension systems in the country. Kentucky has funding for only about 45% of its pension obligations, one of the smallest shares of any state.

2. Arkansas
> Pct. of pop. age 65+: 17.4% (22nd highest)
> Avg. earnings 65 & older households: $47,041 per year (3rd lowest)
> 65 & older homeownership rate: 81.0% (20th highest)
> Life expectancy at age 65: age 82.9 (8th lowest)
Quality of life for retirement age residents of Arkansas – which ranks as the second worst state to grow old in – is undermined by a few key social and economic indicators. For one, Arkansas has a very high crime rate. There were 672 violent crimes for every 100,000 people in the state in 2020, more than in all but three other states and well above the 399 per 100,000 national violent crime rate. Financial hardship is also more common than average among older Arkansas residents. The state’s 65 and older poverty rate of 10.5% is over a full percentage point higher than the 9.4% national rate.
Remaining socially engaged throughout retirement can be critical to maintaining a high quality of life. In Arkansas, only the 65 and older population spent an average of only 15 hours volunteering in the last year, the second lowest time of any state and over 10 hours below the national average.
[in-text-ad-2]

1. Mississippi
> Pct. of pop. age 65+: 16.4% (19th lowest)
> Avg. earnings 65 & older households: $49,422 per year (7th lowest)
> 65 & older homeownership rate: 82.3% (9th highest)
> Life expectancy at age 65: age 82.5 (the lowest)
Mississippi ranks as the worst state in the country for older Americans. Life expectancy at age 65 in Mississippi is just 17.5 years, the lowest in the country and two years below the national average. Older Mississippi residents also appear to be at greater risk of financial insecurity. The poverty rate among those 65 and older in the state of 13.2% is the second highest in the country and well above the 9.4% national rate. Additionally, the average annual earnings among 65 and older Mississippi households stands at just $49,422, about $14,100 below the national average.
Remaining socially engaged throughout retirement can be critical to maintaining a high quality of life. In Mississippi, older residents are less likely to volunteer based on average annual hours of volunteer work per year, and are less likely to belong to a club or group than the typical retirement age American.
Methodology
To determine the best and worst states in which to grow old, 24/7 Wall St. reviewed several statewide as well as 65 and older population-specific data. The data includes measures in four categories: income, health, education, and environment and access. We created four indices for each of these four broad categories.
To construct the indices we used the min-max normalization method. For reference, a similar methodology was used in constructing HelpAge International’s Global AgeWatch Index and the United Nations Human Development Index.
Income
The percentage of 65 and over households with supplemental retirement income, the median household income for the 65 and over population, and the homeownership rate for the 65 and over population are one-year estimates from the U.S. Census Bureau’s 2019 American Community Survey. The pension funded ratio as of 2019 came from The Pew Charitable Trusts.
Health
The percentage of non-institutionalized people 65 and over with a disability came from the census. We also included healthy life expectancy at 65 from the the Centers for Disease Control and Prevention’s National Vital Statistics System for 2018. The percentage of adults who reported not having a personal doctor in 2020 came from the Kaiser Family Foundation. The age-adjusted elderly mortality rate per 100,000 people 65 and over from 2018 to 2020 in each state is also from the CDC.
Education
The share of people 65 and over with a bachelor’s degree or higher came from the ACS.
Environment and Access
2020 violent crime rates are from the FBI, and the share of workers who walk or use public transportation and the percentage of population 65 years and over are from the ACS. The percentage of the 65 and over population that did favors for or with their neighbors at least once a month and the average number of hours spent volunteering by the 65 and over population in the last 12 months came from the Current Population Survey’s September 2019 Volunteering and Civic Life Supplement of the Census Bureau.
Are You Still Paying With a Debit Card?
The average American spends $17,274 on debit cards a year, and it’s a HUGE mistake. First, debit cards don’t have the same fraud protections as credit cards. Once your money is gone, it’s gone. But more importantly you can actually get something back from this spending every time you swipe.
Issuers are handing out wild bonuses right now. With some you can earn up to 5% back on every purchase. That’s like getting a 5% discount on everything you buy!
Our top pick is kind of hard to imagine. Not only does it pay up to 5% back, it also includes a $200 cash back reward in the first six months, a 0% intro APR, and…. $0 annual fee. It’s quite literally free money for any one that uses a card regularly. Click here to learn more!
Flywheel Publishing has partnered with CardRatings to provide coverage of credit card products. Flywheel Publishing and CardRatings may receive a commission from card issuers.
Thank you for reading! Have some feedback for us?
Contact the 24/7 Wall St. editorial team.
 24/7 Wall St.
 24/7 Wall St.
 24/7 Wall St.
 24/7 Wall St.