
Almost half of adults in the United States are projected to be obese, not just overweight, by 2030, according to estimates published in December 2019 in the New England Journal of Medicine. Nearly one in four people will be morbidly obese, meaning carrying about 100 pounds over one’s normal body weight.
In the age of a coronavirus pandemic, this is especially worrisome as obesity, which decreases lung capacity, may triple the risk of hospitalization due to a COVID-19 infection, according to the Centers for Disease Control and Prevention.
24/7 Tempo analyzed county-level data from the 2020 County Health Rankings & Roadmaps report, a collaboration between the Robert Wood Johnson Foundation and the University of Wisconsin Population Health Institute to determine the most obese city in the United States. We aggregated county-level statistics to metropolitan statistical areas.
Many of the metro areas with high obesity rates also tend to have low-income populations. People with lower incomes are less able to afford proper medical care, as well as a healthy lifestyle, and have less access to healthy foods or gyms. Only one of the 50 cities with the highest obesity rates that were finalists for the most obese city has a median annual household income that is higher than the U.S. median of $65,712.
Though the underlying causes of obesity are many, some are within one’s control. Others, like genetics, are not. The health outcomes of being obese are clearer. One of them is diabetes. All but three of the most obese cities on our finalist list have an adult diabetes rate lower than the U.S. rate of 10.3%. Click here to see the 10 warning signs you may have diabetes.
Obesity is associated with a reduced quality of life, chronic conditions such as hypertension and diseases such as heart disease and cancer that are among the leading causes of death. Only seven of the 50 metro areas that were finalists have a lower share of adults reporting being in poor or fair health than the U.S. average of 17.2%.
Health experts have pointed to several lifestyle factors as likely contributing to the excess weight problem. Among them are a sedentary lifestyle and the consumption of high-calorie diets, including large sugary beverages.
Keeping active has been shown to help people maintain a healthy weight. Nationwide, 23.0% of adults report exercising on a regular basis. Of the 50 most obese cities on the finalist list, only two metro areas have a lower share of adults who don’t exercise regularly.
To determine the most obese city in the United States, 24/7 Tempo reviewed obesity data for all 384 metro areas in the country. The obesity rates (the share of adult residents who report a body mass index of 30 or greater) came from the 2020 County Health Rankings & Roadmaps, a collaboration between the Robert Wood Johnson Foundation and the University of Wisconsin Population Health Institute.
The age-adjusted percentage of the total population 20 years and over diagnosed with diabetes in 2016, the latest year for which data is available, also came from the 2020 County Health Rankings & Roadmaps.
Age-adjusted rates of diabetes were provided at the county level, which were then aggregated to the metropolitan level using a weighted average, based on the percentage of the 2019 one-year population of each county within each metro area. Population figures, as well as median household income and poverty rate, came from the American Community Survey 2019 1-Year Estimates.
Texarkana, Texas, is the most obese city in America, with a rate of 43.6%, against the U.S. average of 29.0%. In the city, adults who don’t exercise account for 39.2% of the residents, which ranks it first among 384 American cities. The U.S. average is 24.4%. The city’s population over 20 with diabetes is 14.6%, which ranks it 38th out of 384 metros measured. The U.S. average for this is only 10.3%.
Adults in poor or fair health in Texarkana represent 20.5% of adults, which puts its 69th out of 384 metros. The U.S. average for this measure is 17.2%. The city’s median household income is $51,544, which puts it 300th out of 384 metros The U.S. average for this number is $65,712. Texarkana’s population is 149,308.
Click here to see the most obese cities in America
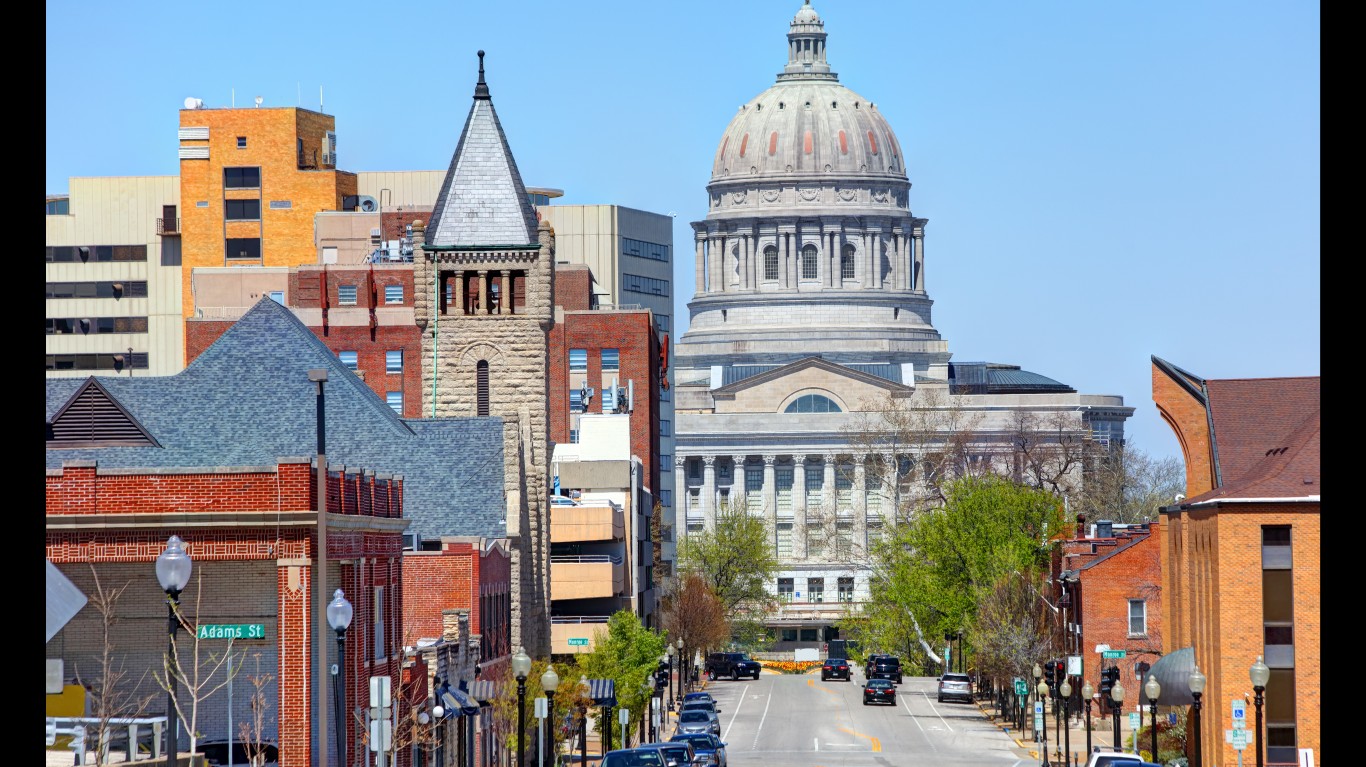
50. Jefferson City, Missouri
> Obesity rate: 36.4% (US avg.: 29.0%)
> Adults who don’t exercise: 24.9% — 173rd out of 384 (US avg.: 24.4%)
> Pop. over 20 with diabetes: 13.5% — 64th out of 384 (US avg.: 10.3%)
> Adults in poor or fair health: 17.1% — 182nd out of 384 (US avg.: 17.2%)
> Median household income: $60,786 — 167th out of 384 (US avg.: $65,712)
> Population: 151,418
[in-text-ad]

49. Cumberland, Maryland
> Obesity rate: 36.4% (US avg.: 29.0%)
> Adults who don’t exercise: 27.9% — 99th out of 384 (US avg.: 24.4%)
> Pop. over 20 with diabetes: 14.8% — 33rd out of 384 (US avg.: 10.3%)
> Adults in poor or fair health: 17.6% — 160th out of 384 (US avg.: 17.2%)
> Median household income: $49,729 — 326th out of 384 (US avg.: $65,712)
> Population: 97,284

48. Hagerstown-Martinsburg, Maryland
> Obesity rate: 36.5% (US avg.: 29.0%)
> Adults who don’t exercise: 28.2% — 88th out of 384 (US avg.: 24.4%)
> Pop. over 20 with diabetes: 13.3% — 66th out of 384 (US avg.: 10.3%)
> Adults in poor or fair health: 17.7% — 155th out of 384 (US avg.: 17.2%)
> Median household income: $60,095 — 187th out of 384 (US avg.: $65,712)
> Population: 289,545
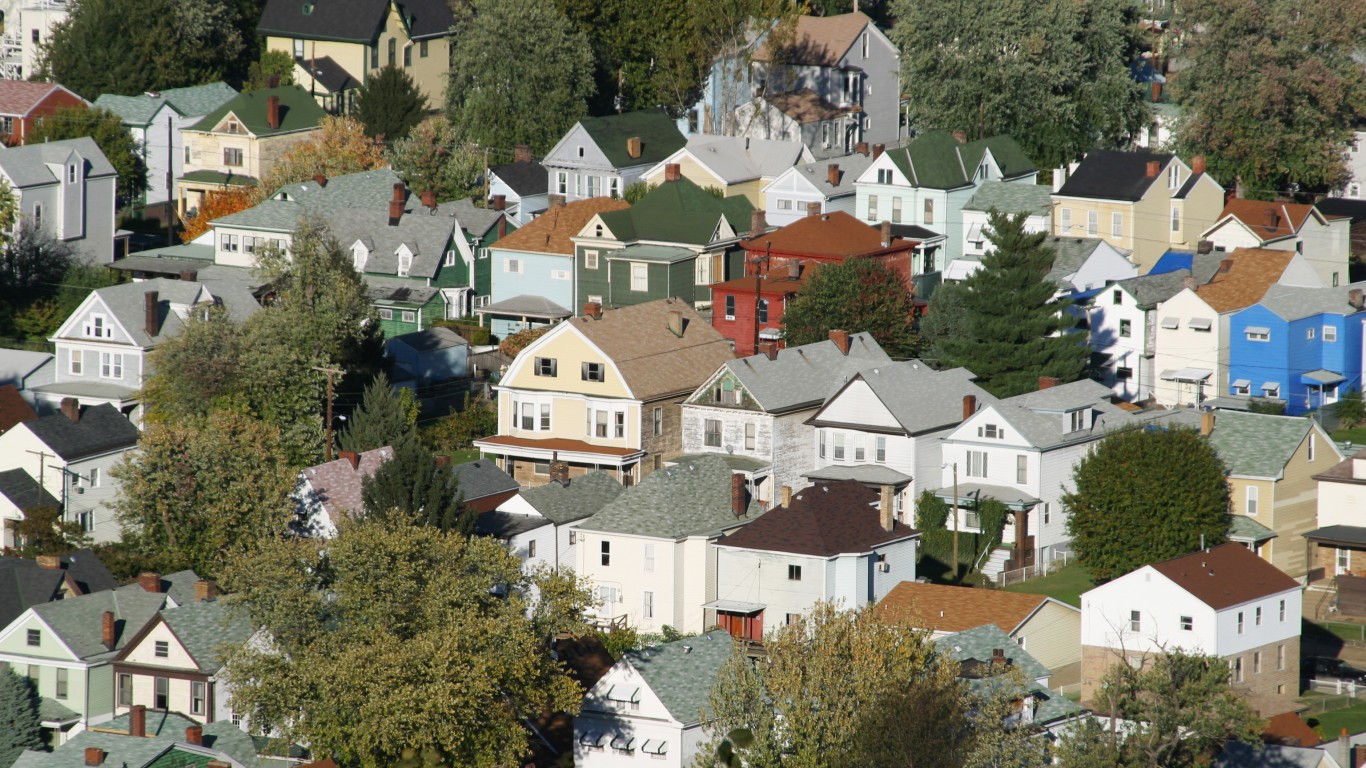
47. Wheeling, West Virginia
> Obesity rate: 36.6% (US avg.: 29.0%)
> Adults who don’t exercise: 29.9% — 53rd out of 384 (US avg.: 24.4%)
> Pop. over 20 with diabetes: 13.7% — 57th out of 384 (US avg.: 10.3%)
> Adults in poor or fair health: 19.7% — 88th out of 384 (US avg.: 17.2%)
> Median household income: $50,440 — 314th out of 384 (US avg.: $65,712)
> Population: 138,948
[in-text-ad-2]

46. Beaumont-Port Arthur, Texas
> Obesity rate: 36.7% (US avg.: 29.0%)
> Adults who don’t exercise: 32.8% — 15th out of 384 (US avg.: 24.4%)
> Pop. over 20 with diabetes: 13.5% — 65th out of 384 (US avg.: 10.3%)
> Adults in poor or fair health: 19.1% — 107th out of 384 (US avg.: 17.2%)
> Median household income: $58,818 — 198th out of 384 (US avg.: $65,712)
> Population: 392,563

45. Oshkosh-Neenah, Wisconsin
> Obesity rate: 36.7% (US avg.: 29.0%)
> Adults who don’t exercise: 21.8% — 270th out of 384 (US avg.: 24.4%)
> Pop. over 20 with diabetes: 9.0% — 285th out of 384 (US avg.: 10.3%)
> Adults in poor or fair health: 12.7% — 350th out of 384 (US avg.: 17.2%)
> Median household income: $58,347 — 206th out of 384 (US avg.: $65,712)
> Population: 171,907
[in-text-ad]
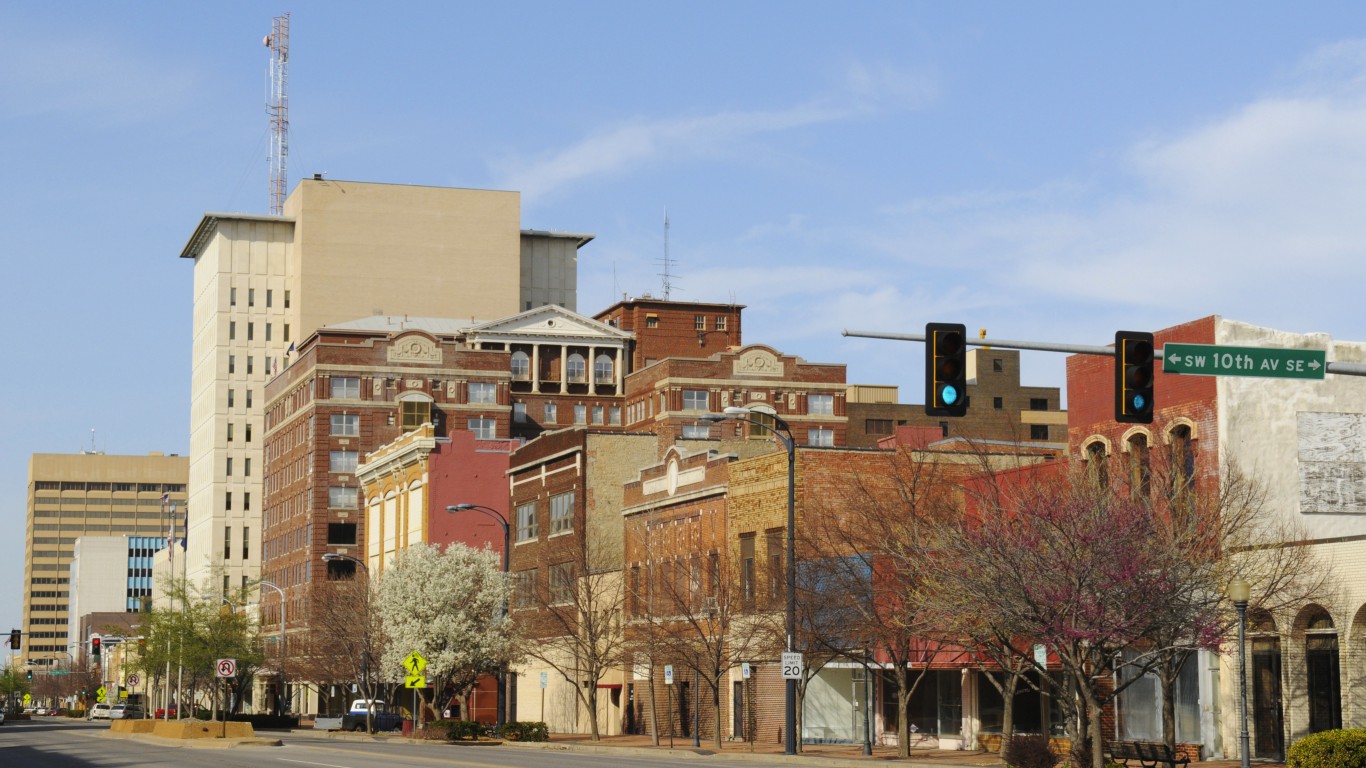
44. Topeka, Kansas
> Obesity rate: 36.7% (US avg.: 29.0%)
> Adults who don’t exercise: 25.2% — 164th out of 384 (US avg.: 24.4%)
> Pop. over 20 with diabetes: 11.3% — 153rd out of 384 (US avg.: 10.3%)
> Adults in poor or fair health: 16.2% — 218th out of 384 (US avg.: 17.2%)
> Median household income: $59,567 — 193rd out of 384 (US avg.: $65,712)
> Population: 231,969
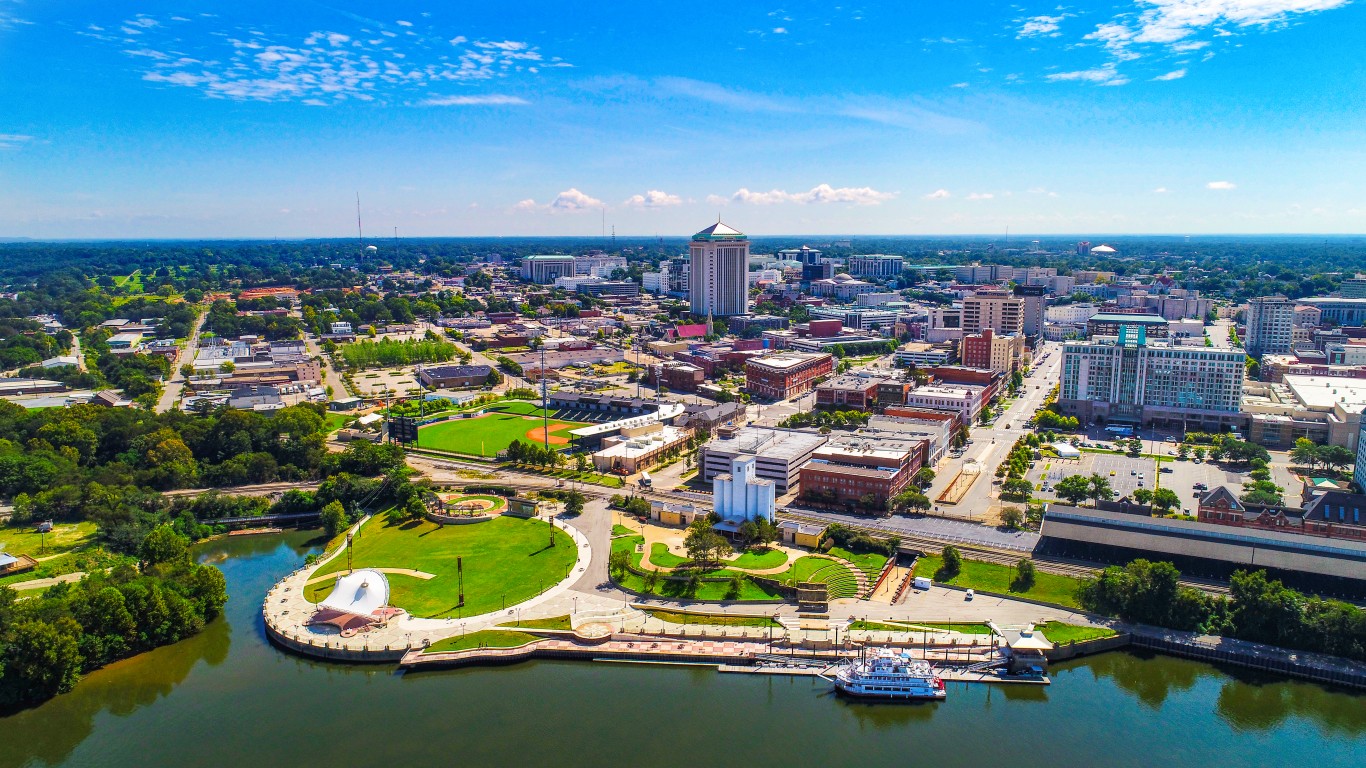
43. Montgomery, Alabama
> Obesity rate: 36.7% (US avg.: 29.0%)
> Adults who don’t exercise: 29.2% — 68th out of 384 (US avg.: 24.4%)
> Pop. over 20 with diabetes: 13.9% — 54th out of 384 (US avg.: 10.3%)
> Adults in poor or fair health: 22.5% — 26th out of 384 (US avg.: 17.2%)
> Median household income: $53,834 — 270th out of 384 (US avg.: $65,712)
> Population: 372,809

42. Weirton-Steubenville, West Virginia
> Obesity rate: 36.9% (US avg.: 29.0%)
> Adults who don’t exercise: 33.5% — 12th out of 384 (US avg.: 24.4%)
> Pop. over 20 with diabetes: 15.8% — 20th out of 384 (US avg.: 10.3%)
> Adults in poor or fair health: 20.6% — 65th out of 384 (US avg.: 17.2%)
> Median household income: $49,510 — 332nd out of 384 (US avg.: $65,712)
> Population: 115,816
[in-text-ad-2]
41. Hinesville, Georgia
> Obesity rate: 36.9% (US avg.: 29.0%)
> Adults who don’t exercise: 33.7% — 10th out of 384 (US avg.: 24.4%)
> Pop. over 20 with diabetes: 12.1% — 119th out of 384 (US avg.: 10.3%)
> Adults in poor or fair health: 21.4% — 46th out of 384 (US avg.: 17.2%)
> Median household income: $53,060 — 283rd out of 384 (US avg.: $65,712)
> Population: 81,344

39. Yuma, Arizona
> Obesity rate: 36.9% (US avg.: 29.0%)
> Adults who don’t exercise: 26.3% — 135th out of 384 (US avg.: 24.4%)
> Pop. over 20 with diabetes: 14.1% — 50th out of 384 (US avg.: 10.3%)
> Adults in poor or fair health: 22.7% — 18th out of 384 (US avg.: 17.2%)
> Median household income: $46,419 — 362nd out of 384 (US avg.: $65,712)
> Population: 213,787
[in-text-ad]

39. Michigan City-La Porte, Indiana
> Obesity rate: 36.9% (US avg.: 29.0%)
> Adults who don’t exercise: 30.1% — 51st out of 384 (US avg.: 24.4%)
> Pop. over 20 with diabetes: 12.9% — 81st out of 384 (US avg.: 10.3%)
> Adults in poor or fair health: 18.3% — 126th out of 384 (US avg.: 17.2%)
> Median household income: $56,019 — 244th out of 384 (US avg.: $65,712)
> Population: 109,888
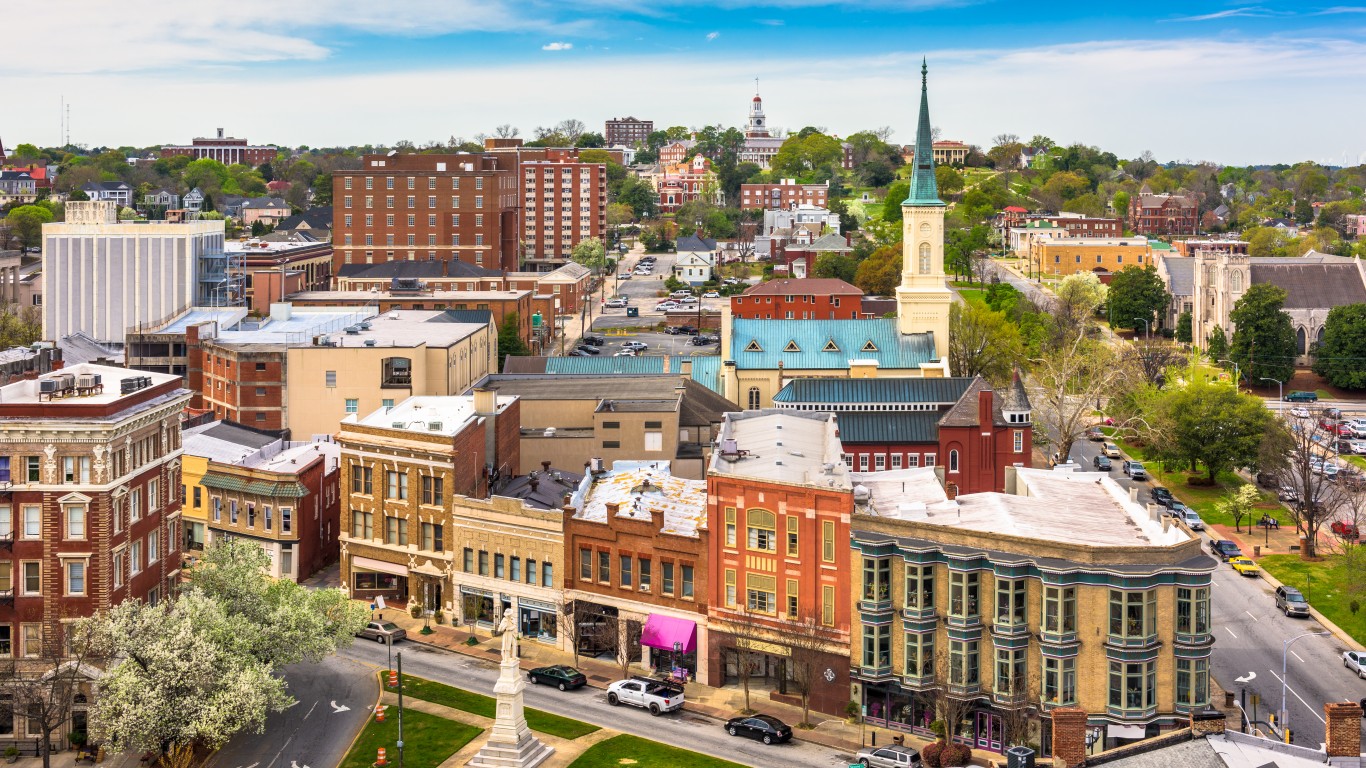
38. Macon, Georgia
> Obesity rate: 36.9% (US avg.: 29.0%)
> Adults who don’t exercise: 32.6% — 16th out of 384 (US avg.: 24.4%)
> Pop. over 20 with diabetes: 14.6% — 36th out of 384 (US avg.: 10.3%)
> Adults in poor or fair health: 20.0% — 75th out of 384 (US avg.: 17.2%)
> Median household income: $48,435 — 347th out of 384 (US avg.: $65,712)
> Population: 231,130
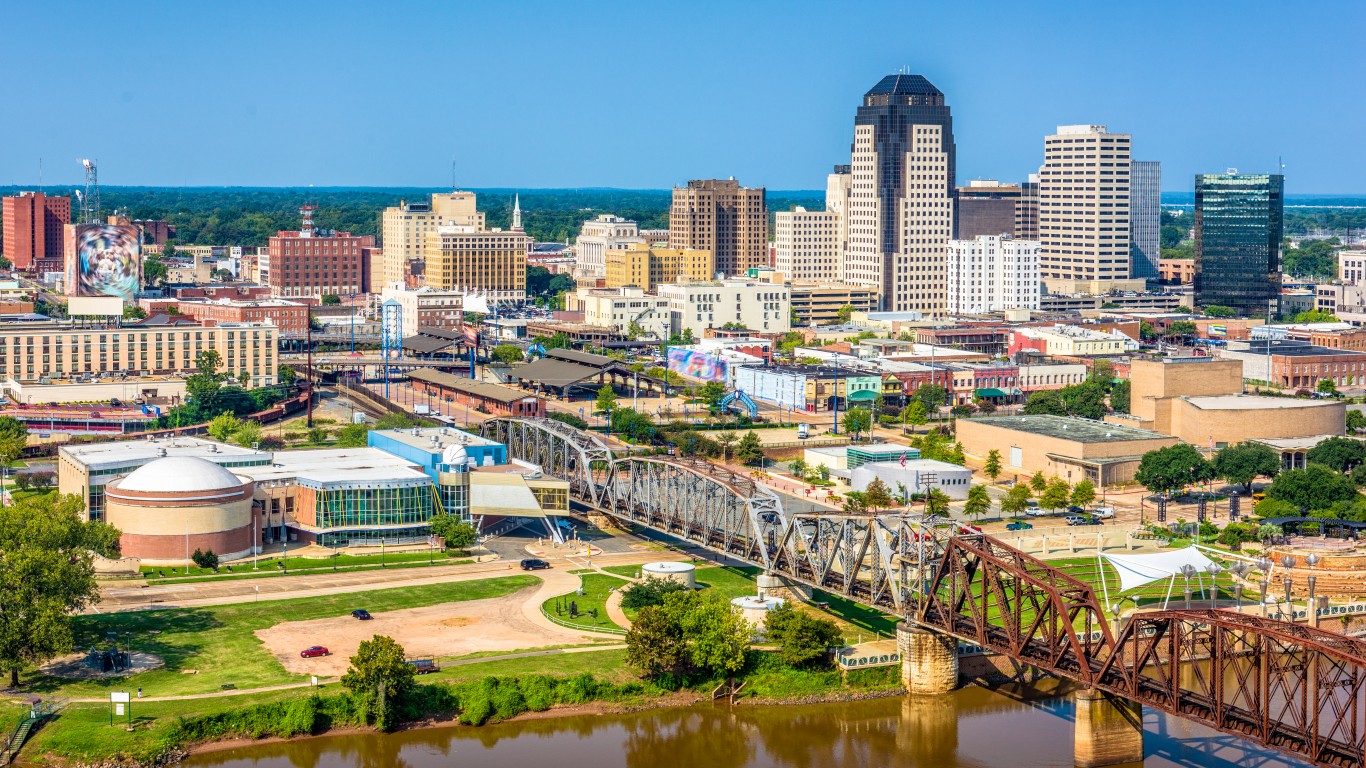
37. Shreveport-Bossier City, Louisiana
> Obesity rate: 37.0% (US avg.: 29.0%)
> Adults who don’t exercise: 29.9% — 54th out of 384 (US avg.: 24.4%)
> Pop. over 20 with diabetes: 13.0% — 75th out of 384 (US avg.: 10.3%)
> Adults in poor or fair health: 21.7% — 37th out of 384 (US avg.: 17.2%)
> Median household income: $47,447 — 357th out of 384 (US avg.: $65,712)
> Population: 394,706
[in-text-ad-2]
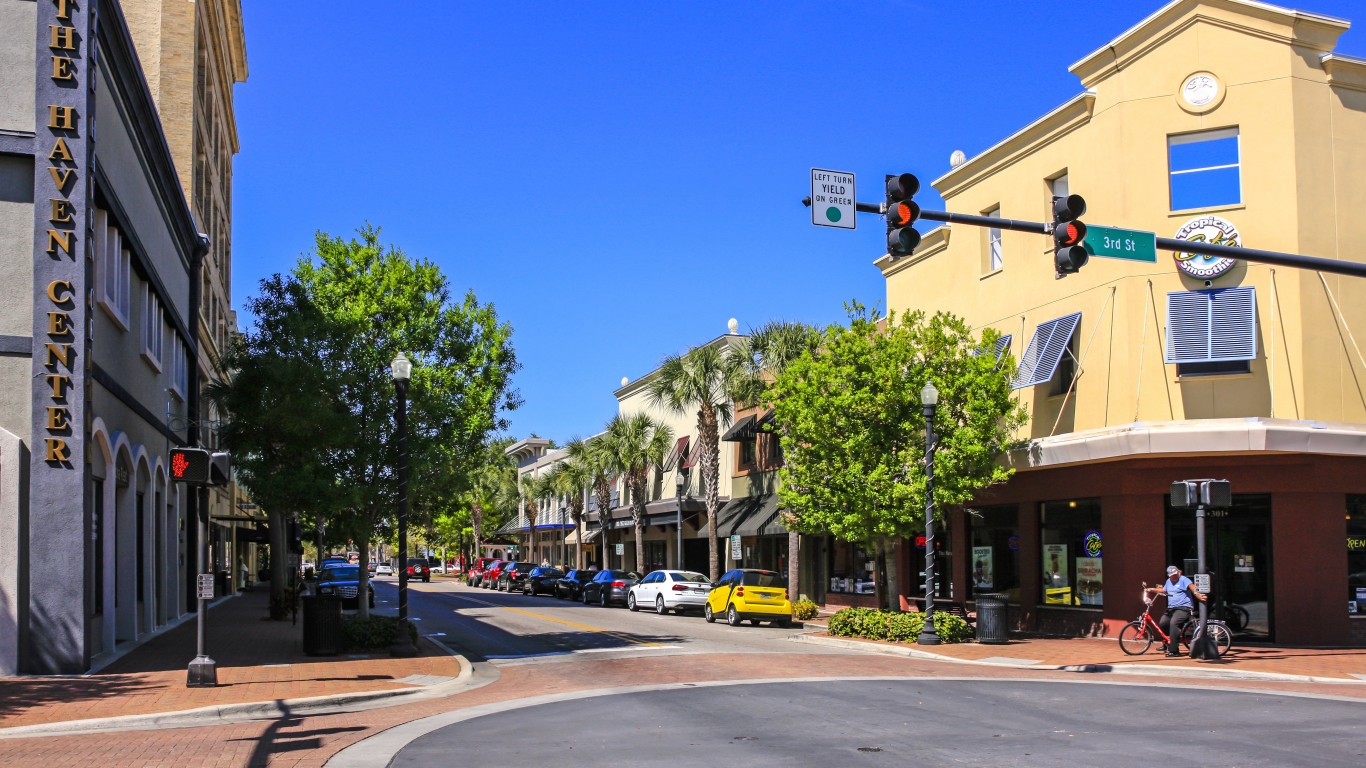
35. Lakeland-Winter Haven, Florida
> Obesity rate: 37.1% (US avg.: 29.0%)
> Adults who don’t exercise: 28.8% — 76th out of 384 (US avg.: 24.4%)
> Pop. over 20 with diabetes: 14.9% — 31st out of 384 (US avg.: 10.3%)
> Adults in poor or fair health: 20.7% — 63rd out of 384 (US avg.: 17.2%)
> Median household income: $51,833 — 294th out of 384 (US avg.: $65,712)
> Population: 724,777

35. Visalia-Porterville, California
> Obesity rate: 37.1% (US avg.: 29.0%)
> Adults who don’t exercise: 26.9% — 121st out of 384 (US avg.: 24.4%)
> Pop. over 20 with diabetes: 9.3% — 268th out of 384 (US avg.: 10.3%)
> Adults in poor or fair health: 25.7% — 5th out of 384 (US avg.: 17.2%)
> Median household income: $57,692 — 214th out of 384 (US avg.: $65,712)
> Population: 466,195
[in-text-ad]

34. Saginaw, Michigan
> Obesity rate: 37.3% (US avg.: 29.0%)
> Adults who don’t exercise: 25.5% — 154th out of 384 (US avg.: 24.4%)
> Pop. over 20 with diabetes: 10.6% — 198th out of 384 (US avg.: 10.3%)
> Adults in poor or fair health: 17.7% — 157th out of 384 (US avg.: 17.2%)
> Median household income: $48,303 — 350th out of 384 (US avg.: $65,712)
> Population: 190,539
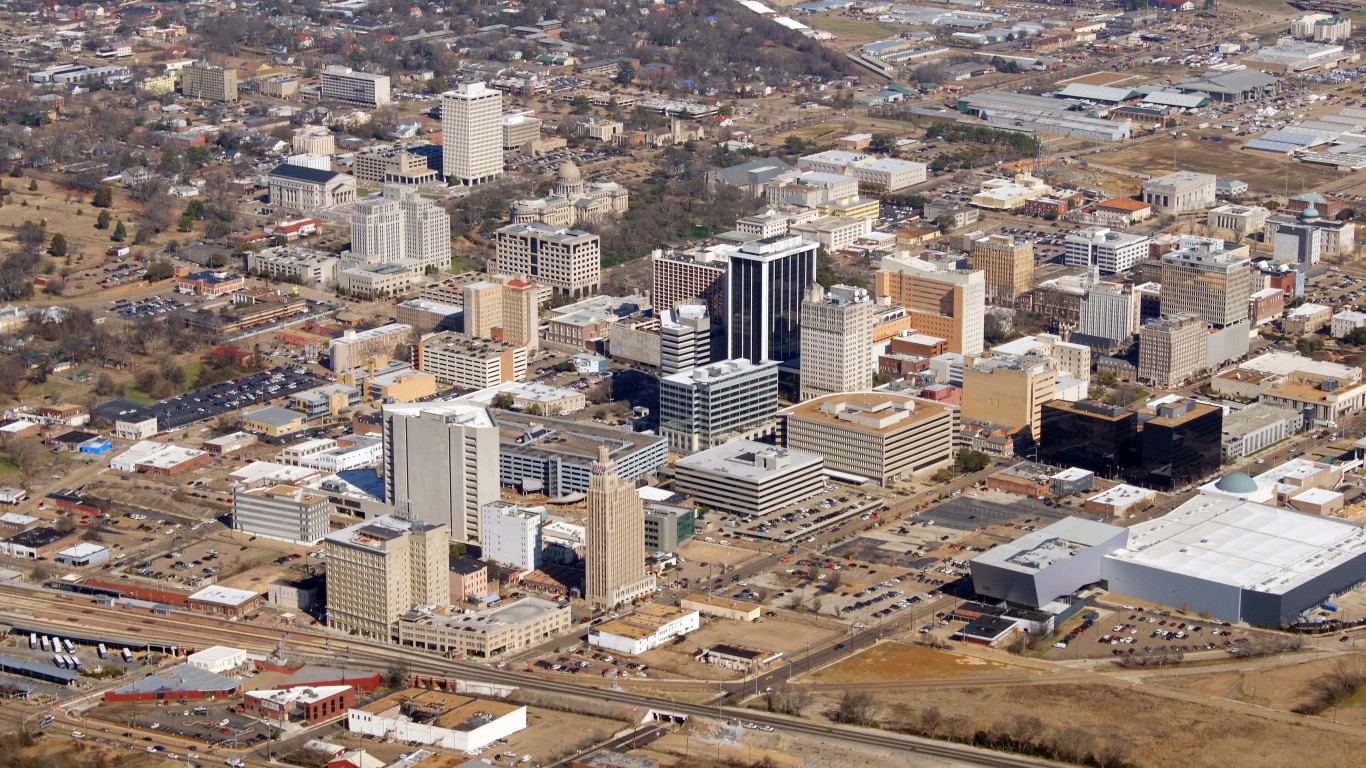
33. Jackson, Mississippi
> Obesity rate: 37.3% (US avg.: 29.0%)
> Adults who don’t exercise: 30.2% — 49th out of 384 (US avg.: 24.4%)
> Pop. over 20 with diabetes: 13.2% — 67th out of 384 (US avg.: 10.3%)
> Adults in poor or fair health: 20.2% — 74th out of 384 (US avg.: 17.2%)
> Median household income: $52,426 — 287th out of 384 (US avg.: $65,712)
> Population: 594,800
32. Cleveland, Tennessee
> Obesity rate: 37.4% (US avg.: 29.0%)
> Adults who don’t exercise: 32.4% — 17th out of 384 (US avg.: 24.4%)
> Pop. over 20 with diabetes: 16.7% — 7th out of 384 (US avg.: 10.3%)
> Adults in poor or fair health: 21.5% — 41st out of 384 (US avg.: 17.2%)
> Median household income: $52,178 — 292nd out of 384 (US avg.: $65,712)
> Population: 126,801
[in-text-ad-2]

31. St. Joseph, Missouri
> Obesity rate: 37.4% (US avg.: 29.0%)
> Adults who don’t exercise: 30.9% — 40th out of 384 (US avg.: 24.4%)
> Pop. over 20 with diabetes: 12.0% — 120th out of 384 (US avg.: 10.3%)
> Adults in poor or fair health: 19.7% — 86th out of 384 (US avg.: 17.2%)
> Median household income: $50,425 — 315th out of 384 (US avg.: $65,712)
> Population: 125,411
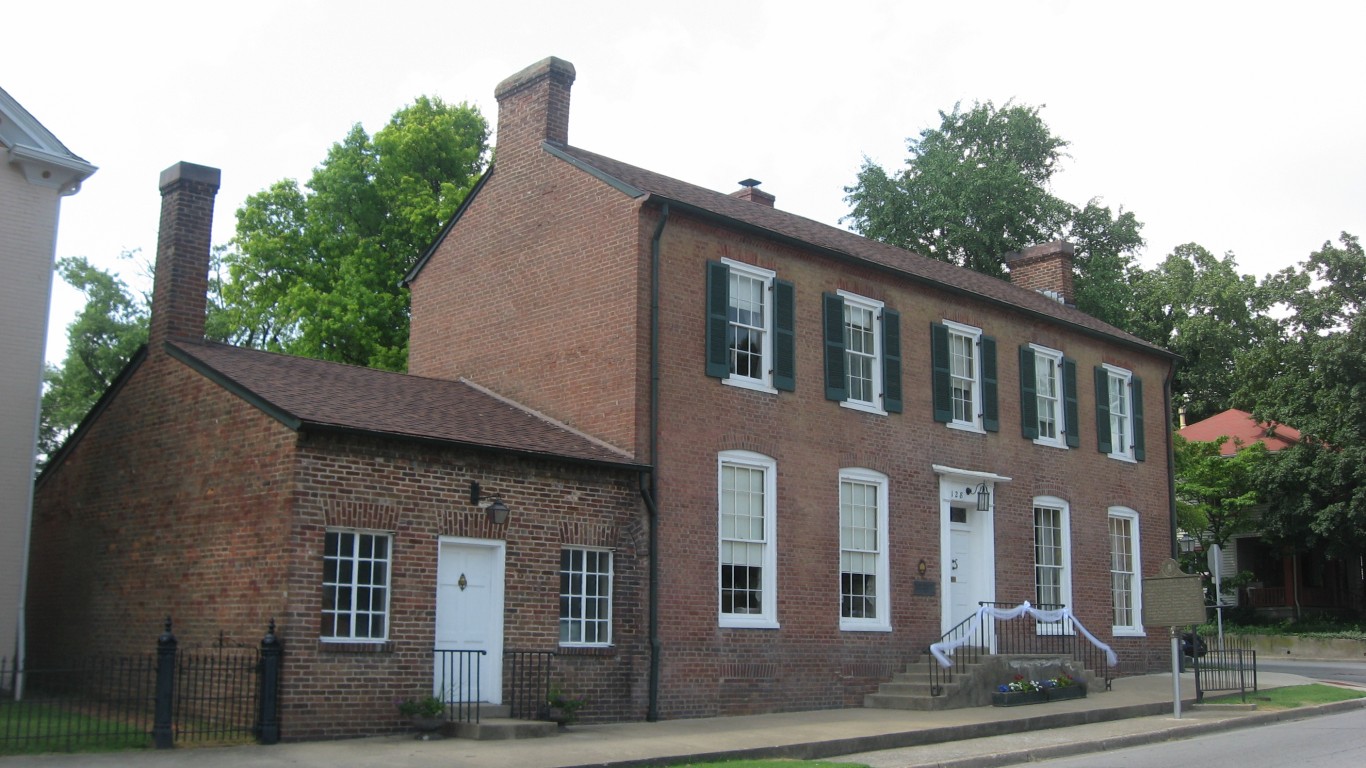
30. Elizabethtown-Fort Knox, Kentucky
> Obesity rate: 37.4% (US avg.: 29.0%)
> Adults who don’t exercise: 31.4% — 32nd out of 384 (US avg.: 24.4%)
> Pop. over 20 with diabetes: 13.0% — 78th out of 384 (US avg.: 10.3%)
> Adults in poor or fair health: 20.5% — 67th out of 384 (US avg.: 17.2%)
> Median household income: $55,246 — 255th out of 384 (US avg.: $65,712)
> Population: 154,713
[in-text-ad]

29. Monroe, Michigan
> Obesity rate: 37.5% (US avg.: 29.0%)
> Adults who don’t exercise: 28.2% — 89th out of 384 (US avg.: 24.4%)
> Pop. over 20 with diabetes: 10.7% — 189th out of 384 (US avg.: 10.3%)
> Adults in poor or fair health: 13.7% — 312th out of 384 (US avg.: 17.2%)
> Median household income: $62,839 — 128th out of 384 (US avg.: $65,712)
> Population: 150,500
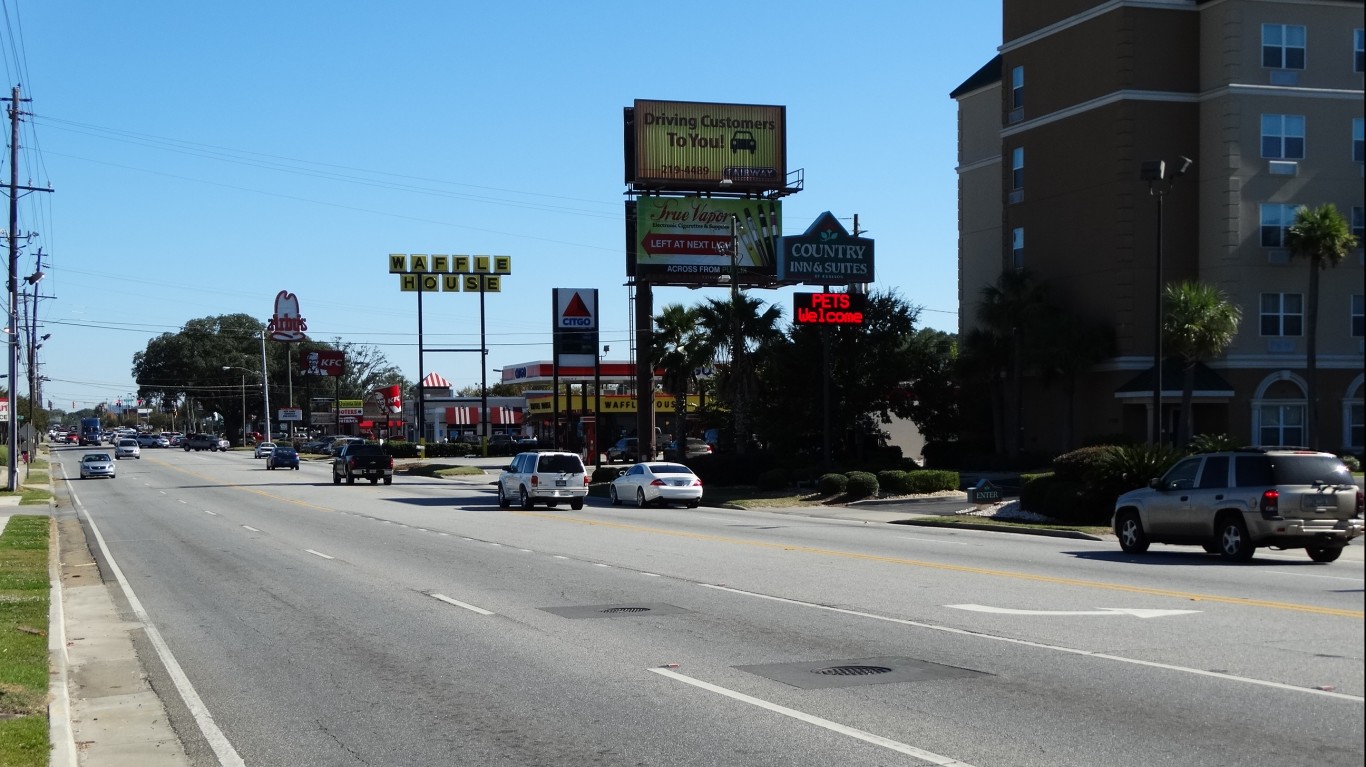
28. Valdosta, Georgia
> Obesity rate: 37.6% (US avg.: 29.0%)
> Adults who don’t exercise: 33.7% — 9th out of 384 (US avg.: 24.4%)
> Pop. over 20 with diabetes: 16.6% — 10th out of 384 (US avg.: 10.3%)
> Adults in poor or fair health: 21.2% — 47th out of 384 (US avg.: 17.2%)
> Median household income: $43,787 — 372nd out of 384 (US avg.: $65,712)
> Population: 145,738

27. Rome, Georgia
> Obesity rate: 37.7% (US avg.: 29.0%)
> Adults who don’t exercise: 28.4% — 85th out of 384 (US avg.: 24.4%)
> Pop. over 20 with diabetes: 14.4% — 40th out of 384 (US avg.: 10.3%)
> Adults in poor or fair health: 19.0% — 108th out of 384 (US avg.: 17.2%)
> Median household income: $50,880 — 307th out of 384 (US avg.: $65,712)
> Population: 98,498
[in-text-ad-2]
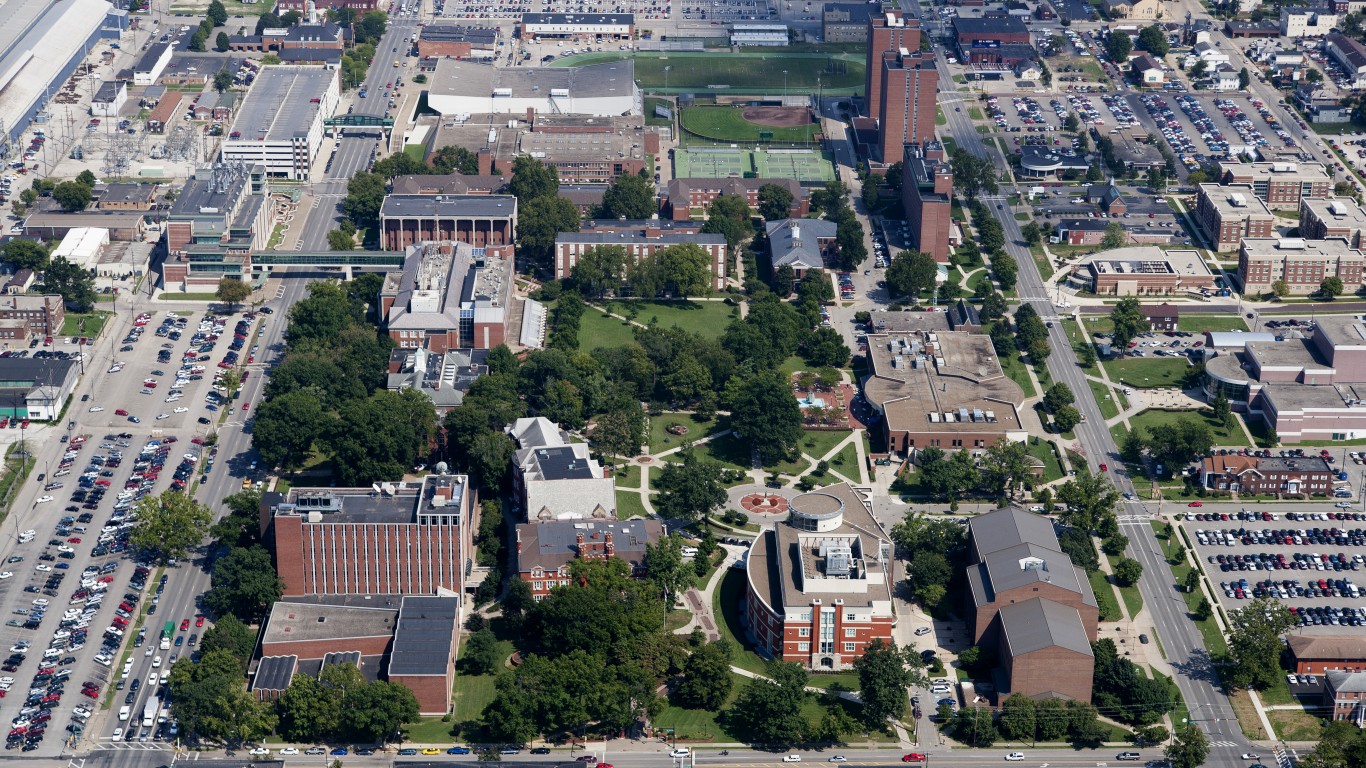
26. Huntington-Ashland, West Virginia
> Obesity rate: 37.7% (US avg.: 29.0%)
> Adults who don’t exercise: 31.4% — 33rd out of 384 (US avg.: 24.4%)
> Pop. over 20 with diabetes: 16.2% — 15th out of 384 (US avg.: 10.3%)
> Adults in poor or fair health: 22.9% — 16th out of 384 (US avg.: 17.2%)
> Median household income: $48,329 — 349th out of 384 (US avg.: $65,712)
> Population: 355,873
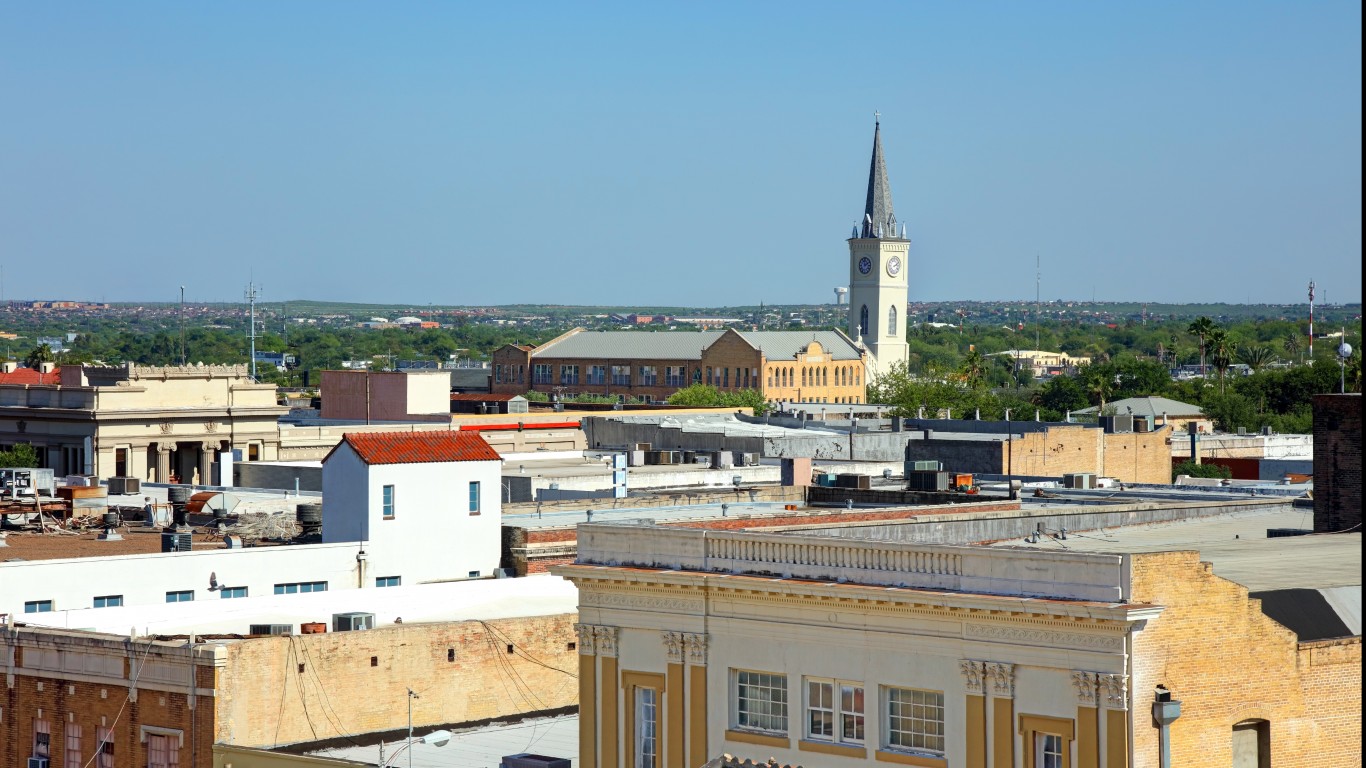
25. Laredo, Texas
> Obesity rate: 37.8% (US avg.: 29.0%)
> Adults who don’t exercise: 29.3% — 65th out of 384 (US avg.: 24.4%)
> Pop. over 20 with diabetes: 6.5% — 368th out of 384 (US avg.: 10.3%)
> Adults in poor or fair health: 34.8% — 1st out of 384 (US avg.: 17.2%)
> Median household income: $56,084 — 243rd out of 384 (US avg.: $65,712)
> Population: 276,652
[in-text-ad]
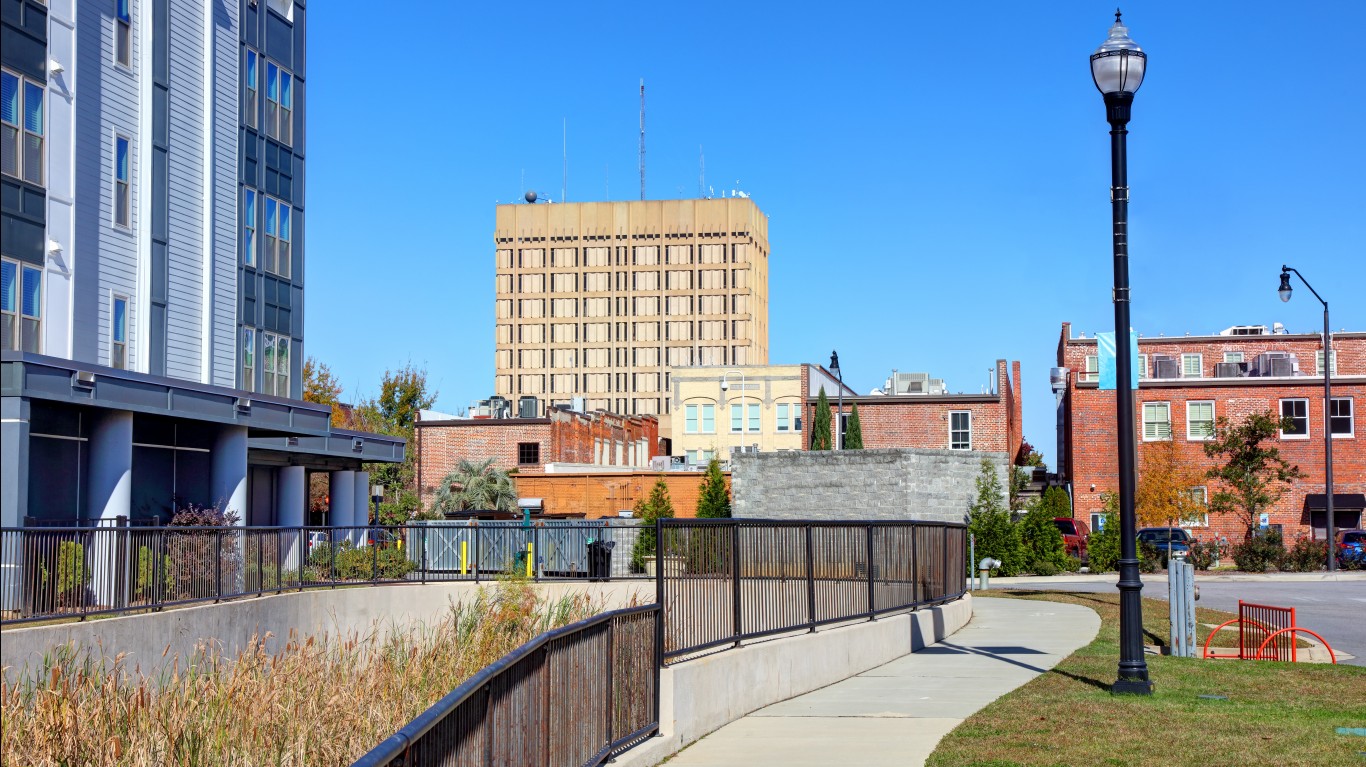
24. Florence, South Carolina
> Obesity rate: 37.9% (US avg.: 29.0%)
> Adults who don’t exercise: 32.0% — 23rd out of 384 (US avg.: 24.4%)
> Pop. over 20 with diabetes: 15.8% — 19th out of 384 (US avg.: 10.3%)
> Adults in poor or fair health: 21.0% — 53rd out of 384 (US avg.: 17.2%)
> Median household income: $48,547 — 344th out of 384 (US avg.: $65,712)
> Population: 204,911

23. Midland, Michigan
> Obesity rate: 38.0% (US avg.: 29.0%)
> Adults who don’t exercise: 21.0% — 286th out of 384 (US avg.: 24.4%)
> Pop. over 20 with diabetes: 12.3% — 108th out of 384 (US avg.: 10.3%)
> Adults in poor or fair health: 13.2% — 331st out of 384 (US avg.: 17.2%)
> Median household income: $69,872 — 75th out of 384 (US avg.: $65,712)
> Population: 83,156

22. Dothan, Alabama
> Obesity rate: 38.0% (US avg.: 29.0%)
> Adults who don’t exercise: 32.3% — 20th out of 384 (US avg.: 24.4%)
> Pop. over 20 with diabetes: 14.5% — 39th out of 384 (US avg.: 10.3%)
> Adults in poor or fair health: 20.9% — 56th out of 384 (US avg.: 17.2%)
> Median household income: $50,010 — 323rd out of 384 (US avg.: $65,712)
> Population: 149,358
[in-text-ad-2]
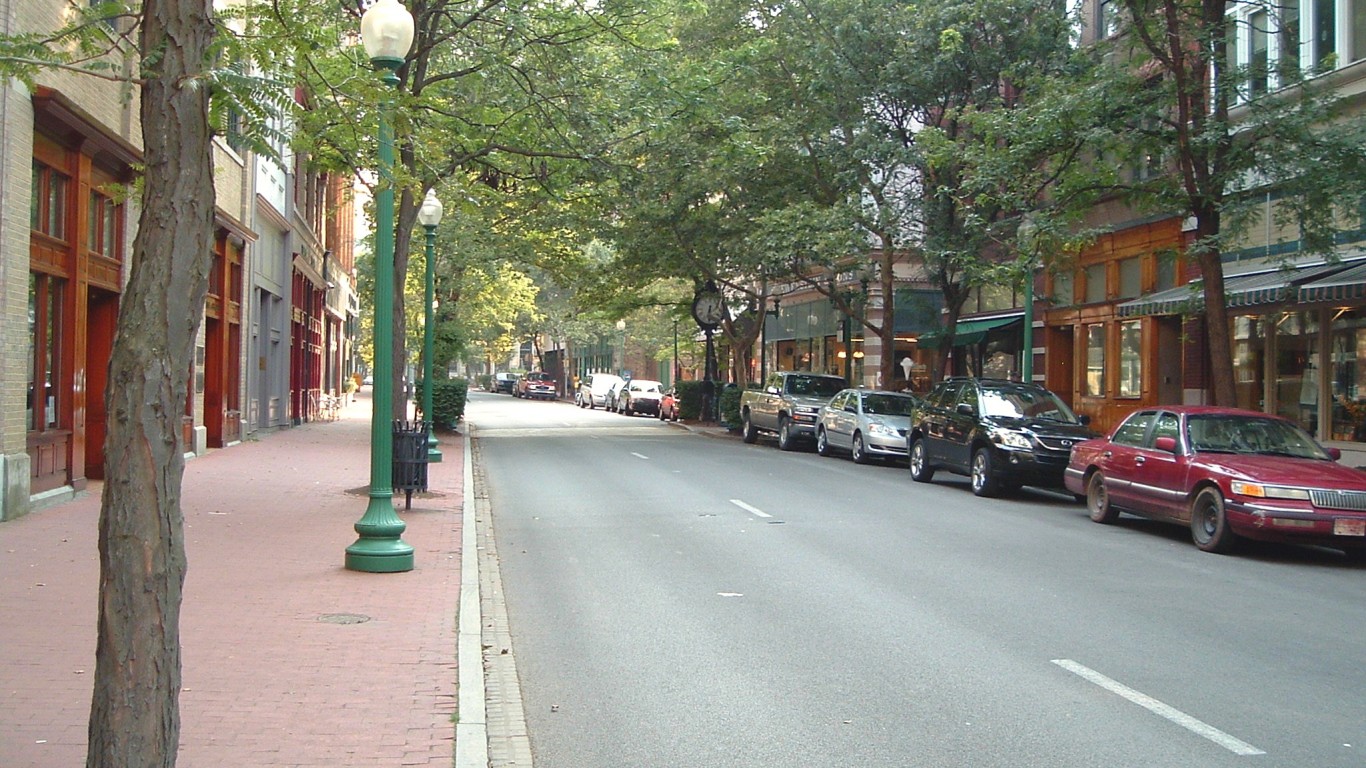
21. Charleston, West Virginia
> Obesity rate: 38.0% (US avg.: 29.0%)
> Adults who don’t exercise: 28.5% — 82nd out of 384 (US avg.: 24.4%)
> Pop. over 20 with diabetes: 16.6% — 9th out of 384 (US avg.: 10.3%)
> Adults in poor or fair health: 22.5% — 23rd out of 384 (US avg.: 17.2%)
> Median household income: $47,500 — 356th out of 384 (US avg.: $65,712)
> Population: 257,814
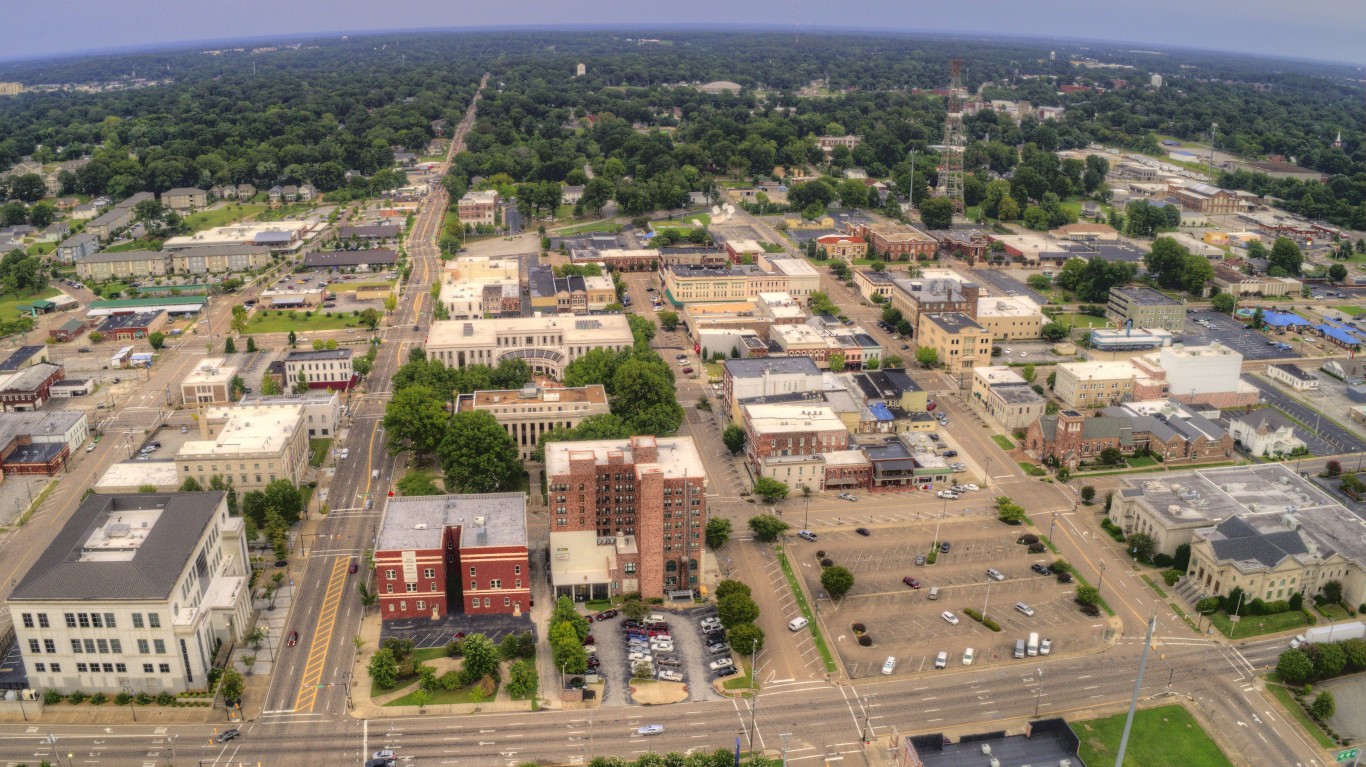
20. Jackson, Tennessee
> Obesity rate: 38.0% (US avg.: 29.0%)
> Adults who don’t exercise: 31.6% — 26th out of 384 (US avg.: 24.4%)
> Pop. over 20 with diabetes: 14.1% — 51st out of 384 (US avg.: 10.3%)
> Adults in poor or fair health: 23.1% — 14th out of 384 (US avg.: 17.2%)
> Median household income: $48,700 — 339th out of 384 (US avg.: $65,712)
> Population: 178,644
[in-text-ad]

18. Goldsboro, North Carolina
> Obesity rate: 38.1% (US avg.: 29.0%)
> Adults who don’t exercise: 28.3% — 87th out of 384 (US avg.: 24.4%)
> Pop. over 20 with diabetes: 16.7% — 6th out of 384 (US avg.: 10.3%)
> Adults in poor or fair health: 20.8% — 61st out of 384 (US avg.: 17.2%)
> Median household income: $44,596 — 370th out of 384 (US avg.: $65,712)
> Population: 123,131
18. Williamsport, Pennsylvania
> Obesity rate: 38.1% (US avg.: 29.0%)
> Adults who don’t exercise: 25.8% — 148th out of 384 (US avg.: 24.4%)
> Pop. over 20 with diabetes: 11.6% — 135th out of 384 (US avg.: 10.3%)
> Adults in poor or fair health: 16.2% — 217th out of 384 (US avg.: 17.2%)
> Median household income: $53,881 — 269th out of 384 (US avg.: $65,712)
> Population: 113,299

17. Sumter, South Carolina
> Obesity rate: 38.2% (US avg.: 29.0%)
> Adults who don’t exercise: 28.0% — 96th out of 384 (US avg.: 24.4%)
> Pop. over 20 with diabetes: 13.9% — 53rd out of 384 (US avg.: 10.3%)
> Adults in poor or fair health: 22.3% — 28th out of 384 (US avg.: 17.2%)
> Median household income: $49,263 — 333rd out of 384 (US avg.: $65,712)
> Population: 140,466
[in-text-ad-2]

16. Anniston-Oxford-Jacksonville, Alabama
> Obesity rate: 38.5% (US avg.: 29.0%)
> Adults who don’t exercise: 31.7% — 24th out of 384 (US avg.: 24.4%)
> Pop. over 20 with diabetes: 17.5% — 3rd out of 384 (US avg.: 10.3%)
> Adults in poor or fair health: 23.1% — 13th out of 384 (US avg.: 17.2%)
> Median household income: $48,156 — 351st out of 384 (US avg.: $65,712)
> Population: 113,605
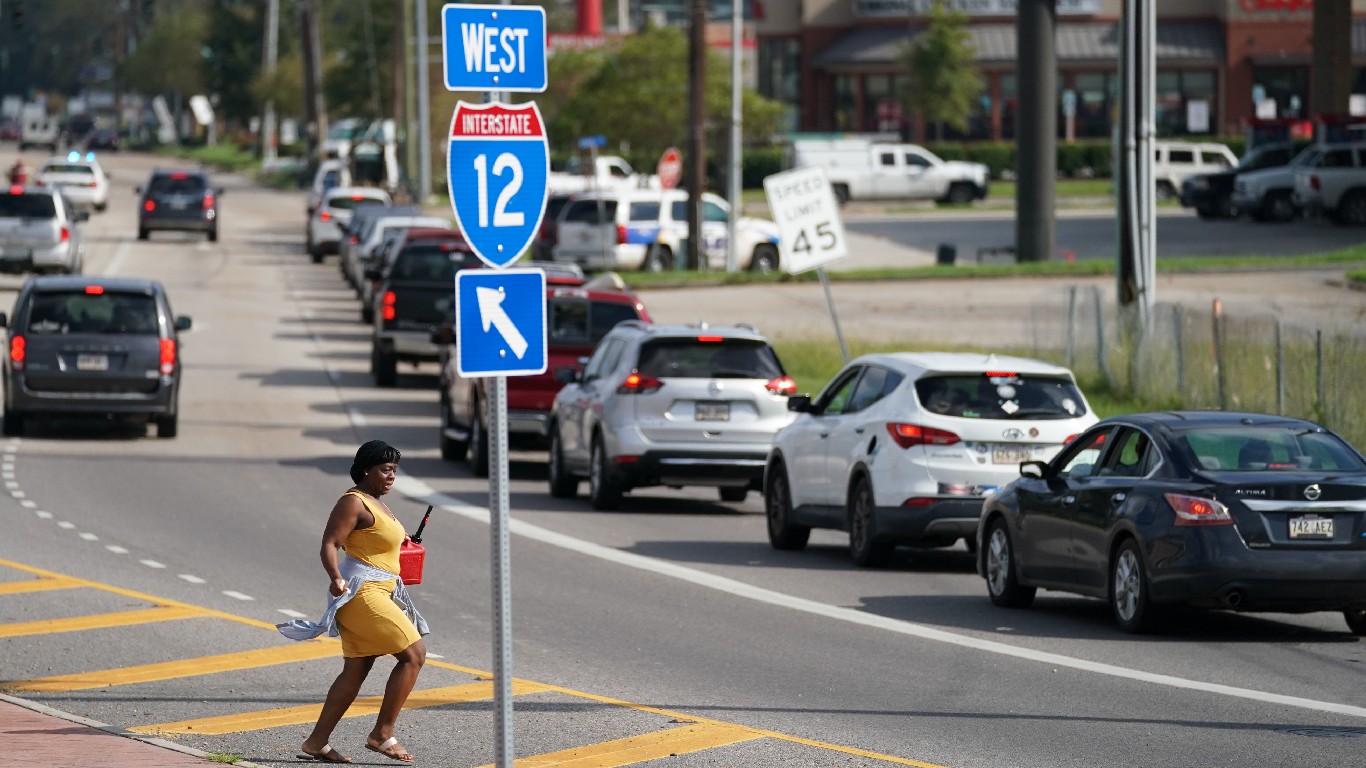
15. Hammond, Louisiana
> Obesity rate: 38.7% (US avg.: 29.0%)
> Adults who don’t exercise: 33.7% — 11th out of 384 (US avg.: 24.4%)
> Pop. over 20 with diabetes: 10.4% — 207th out of 384 (US avg.: 10.3%)
> Adults in poor or fair health: 22.1% — 29th out of 384 (US avg.: 17.2%)
> Median household income: $47,825 — 352nd out of 384 (US avg.: $65,712)
> Population: 134,758
[in-text-ad]
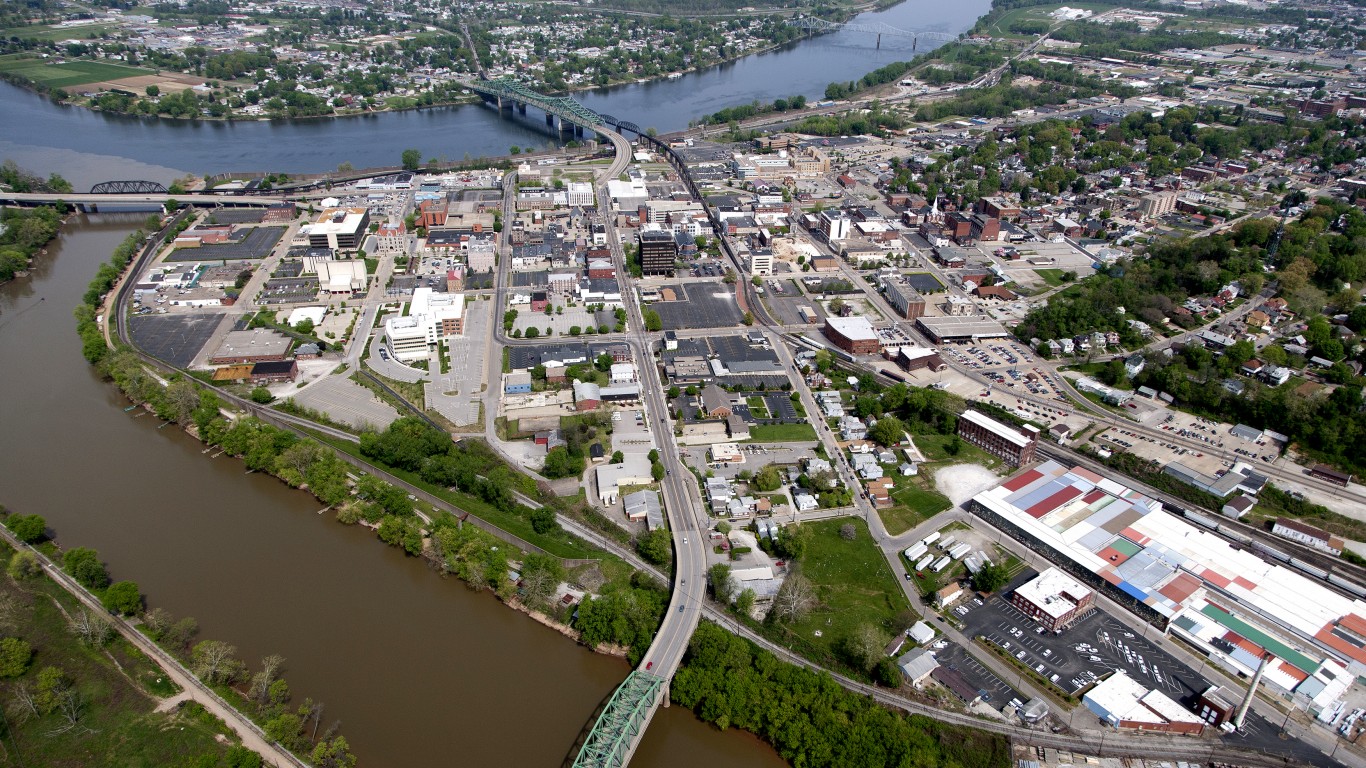
14. Parkersburg-Vienna, West Virginia
> Obesity rate: 38.8% (US avg.: 29.0%)
> Adults who don’t exercise: 28.2% — 89th out of 384 (US avg.: 24.4%)
> Pop. over 20 with diabetes: 17.4% — 5th out of 384 (US avg.: 10.3%)
> Adults in poor or fair health: 21.7% — 36th out of 384 (US avg.: 17.2%)
> Median household income: $48,680 — 341st out of 384 (US avg.: $65,712)
> Population: 89,676

13. Jonesboro, Arkansas
> Obesity rate: 38.9% (US avg.: 29.0%)
> Adults who don’t exercise: 35.2% — 3rd out of 384 (US avg.: 24.4%)
> Pop. over 20 with diabetes: 15.2% — 26th out of 384 (US avg.: 10.3%)
> Adults in poor or fair health: 22.9% — 15th out of 384 (US avg.: 17.2%)
> Median household income: $44,998 — 368th out of 384 (US avg.: $65,712)
> Population: 133,860
12. Pine Bluff, Arkansas
> Obesity rate: 39.3% (US avg.: 29.0%)
> Adults who don’t exercise: 34.9% — 4th out of 384 (US avg.: 24.4%)
> Pop. over 20 with diabetes: 15.9% — 17th out of 384 (US avg.: 10.3%)
> Adults in poor or fair health: 25.3% — 6th out of 384 (US avg.: 17.2%)
> Median household income: $41,541 — 376th out of 384 (US avg.: $65,712)
> Population: 89,437
[in-text-ad-2]

11. Beckley, West Virginia
> Obesity rate: 39.4% (US avg.: 29.0%)
> Adults who don’t exercise: 31.2% — 37th out of 384 (US avg.: 24.4%)
> Pop. over 20 with diabetes: 16.3% — 13th out of 384 (US avg.: 10.3%)
> Adults in poor or fair health: 24.6% — 9th out of 384 (US avg.: 17.2%)
> Median household income: $44,785 — 369th out of 384 (US avg.: $65,712)
> Population: 115,767

10. Columbus, Georgia
> Obesity rate: 39.4% (US avg.: 29.0%)
> Adults who don’t exercise: 30.5% — 43rd out of 384 (US avg.: 24.4%)
> Pop. over 20 with diabetes: 14.3% — 43rd out of 384 (US avg.: 10.3%)
> Adults in poor or fair health: 20.8% — 60th out of 384 (US avg.: 17.2%)
> Median household income: $49,013 — 336th out of 384 (US avg.: $65,712)
> Population: 322,103
[in-text-ad]

9. Warner Robins, Georgia
> Obesity rate: 39.5% (US avg.: 29.0%)
> Adults who don’t exercise: 29.0% — 72nd out of 384 (US avg.: 24.4%)
> Pop. over 20 with diabetes: 11.2% — 155th out of 384 (US avg.: 10.3%)
> Adults in poor or fair health: 19.1% — 106th out of 384 (US avg.: 17.2%)
> Median household income: $61,936 — 147th out of 384 (US avg.: $65,712)
> Population: 185,409

8. Monroe, Louisiana
> Obesity rate: 39.8% (US avg.: 29.0%)
> Adults who don’t exercise: 31.5% — 30th out of 384 (US avg.: 24.4%)
> Pop. over 20 with diabetes: 14.4% — 42nd out of 384 (US avg.: 10.3%)
> Adults in poor or fair health: 22.8% — 17th out of 384 (US avg.: 17.2%)
> Median household income: $40,136 — 380th out of 384 (US avg.: $65,712)
> Population: 200,261
7. Rocky Mount, North Carolina
> Obesity rate: 40.6% (US avg.: 29.0%)
> Adults who don’t exercise: 29.8% — 56th out of 384 (US avg.: 24.4%)
> Pop. over 20 with diabetes: 15.4% — 23rd out of 384 (US avg.: 10.3%)
> Adults in poor or fair health: 21.5% — 42nd out of 384 (US avg.: 17.2%)
> Median household income: $46,466 — 361st out of 384 (US avg.: $65,712)
> Population: 145,770
[in-text-ad-2]
6. Houma-Thibodaux, Louisiana
> Obesity rate: 40.7% (US avg.: 29.0%)
> Adults who don’t exercise: 31.5% — 27th out of 384 (US avg.: 24.4%)
> Pop. over 20 with diabetes: 12.3% — 107th out of 384 (US avg.: 10.3%)
> Adults in poor or fair health: 19.7% — 89th out of 384 (US avg.: 17.2%)
> Median household income: $49,874 — 325th out of 384 (US avg.: $65,712)
> Population: 208,075

5. Albany, Georgia
> Obesity rate: 40.9% (US avg.: 29.0%)
> Adults who don’t exercise: 29.9% — 55th out of 384 (US avg.: 24.4%)
> Pop. over 20 with diabetes: 19.2% — 1st out of 384 (US avg.: 10.3%)
> Adults in poor or fair health: 22.6% — 21st out of 384 (US avg.: 17.2%)
> Median household income: $40,625 — 379th out of 384 (US avg.: $65,712)
> Population: 147,384
[in-text-ad]
4. Danville, Illinois
> Obesity rate: 40.9% (US avg.: 29.0%)
> Adults who don’t exercise: 31.5% — 28th out of 384 (US avg.: 24.4%)
> Pop. over 20 with diabetes: 16.5% — 12th out of 384 (US avg.: 10.3%)
> Adults in poor or fair health: 17.9% — 144th out of 384 (US avg.: 17.2%)
> Median household income: $43,111 — 373rd out of 384 (US avg.: $65,712)
> Population: 75,758

3. Alexandria, Louisiana
> Obesity rate: 41.1% (US avg.: 29.0%)
> Adults who don’t exercise: 32.2% — 22nd out of 384 (US avg.: 24.4%)
> Pop. over 20 with diabetes: 15.4% — 24th out of 384 (US avg.: 10.3%)
> Adults in poor or fair health: 21.7% — 39th out of 384 (US avg.: 17.2%)
> Median household income: $50,553 — 312th out of 384 (US avg.: $65,712)
> Population: 152,037

2. Kankakee, Illinois
> Obesity rate: 41.2% (US avg.: 29.0%)
> Adults who don’t exercise: 36.5% — 2nd out of 384 (US avg.: 24.4%)
> Pop. over 20 with diabetes: 10.8% — 181st out of 384 (US avg.: 10.3%)
> Adults in poor or fair health: 16.4% — 207th out of 384 (US avg.: 17.2%)
> Median household income: $60,923 — 166th out of 384 (US avg.: $65,712)
> Population: 109,862
[in-text-ad-2]

1. Texarkana, Texas
> Obesity rate: 43.6% (US avg.: 29.0%)
> Adults who don’t exercise: 39.2% — 1st out of 384 (US avg.: 24.4%)
> Pop. over 20 with diabetes: 14.6% — 38th out of 384 (US avg.: 10.3%)
> Adults in poor or fair health: 20.5% — 69th out of 384 (US avg.: 17.2%)
> Median household income: $51,544 — 300th out of 384 (US avg.: $65,712)
> Population: 149,308
Travel Cards Are Getting Too Good To Ignore (sponsored)
Credit card companies are pulling out all the stops, with the issuers are offering insane travel rewards and perks.
We’re talking huge sign-up bonuses, points on every purchase, and benefits like lounge access, travel credits, and free hotel nights. For travelers, these rewards can add up to thousands of dollars in flights, upgrades, and luxury experiences every year.
It’s like getting paid to travel — and it’s available to qualified borrowers who know where to look.
We’ve rounded up some of the best travel credit cards on the market. Click here to see the list. Don’t miss these offers — they won’t be this good forever.
Thank you for reading! Have some feedback for us?
Contact the 24/7 Wall St. editorial team.
 24/7 Wall St.
 24/7 Wall St.
 24/7 Wall St.
 24/7 Wall St.
 24/7 Wall St.
 24/7 Wall St.

 24/7 Wall St.


