Every child is born to a unique set of circumstances. And it is these different social, familial, economic, environmental, and many other factors, that help shape who they become. While these conditions are countless, a handful of factors play an outsized role in a child’s development and likelihood for future success — including academic success.
Whether or not a child succeeds academically can depend considerably on school quality. A student who falls behind in one school district might have excelled academically in another. By no means limited to the classroom, many of the strongest influences on a child’s future are in the home environment, and the resources available or absent there.
Using data from the U.S. Census Bureau and the National Center for Education Statistics, 24/7 Wall St. developed an index of four measures to determine the school district that offers the worst chances for student success in every state. The index measures include: the child poverty rate, the teacher-to-student ratio, per-pupil spending on education, and the share of adults with a college education.
In our analysis, we also reviewed school district quality measures from education and community data clearing house, Niche. While favorable rankings in these measures do not alone ensure children’s chances for success during their school years, they can provide considerable advantages.
Half of the index used in 24/7 Wall St.’s ranking is related to the district’s school system itself. The student-teacher ratio — one of the metrics used — is an important indicator, as smaller class sizes allow for more individualized instruction and reduced likelihood of a student falling behind. Similarly, high annual education spending per pupil means more educational resources that can benefit students. It is important to note, however, that high education spending alone is not an assurance of improved academic outcomes. Here is a look at the states that pay their teachers the most (and the least).
The other half of the index — child poverty and the share of adults with a bachelor’s degree — is focused on key socioeconomic factors outside of the classroom. Children in households facing serious financial difficulties are less likely to succeed academically, while children raised by parents with a college education are statistically more likely to do well in school. This is the number of children living in poverty in your state.
Click here to see the worst school district in each state
Click here to see our methodology

Alabama: Eufaula City School District
> Location: Barbour County
> Annual per student spending: $5,298 (state: $10,077)
> Student-to-teacher ratio: 38:1 (state: 18:1)
> Child poverty rate: 37.1% (state: 20.7%)
The Eufaula City School District in Alabama’s Barbour County ranks as the worst school district in the state. A far larger than typical share of local students are at a considerable disadvantage, as the local child poverty rate of 37.1% is well above the 20.7% rate across Alabama. Students in households facing serious financial hardship are less likely to succeed academically than those in more financially secure environments.
Students in the district are also less likely to receive individualized attention and instruction as class sizes tend to be large. There are 38 students for every one teacher in the district, more than double the comparable ratio statewide of 18-to-1.
[in-text-ad]

Alaska: Lower Yukon School District
> Location: Kusilvak Census Area
> Annual per student spending: $31,575 (state: $18,394)
> Student-to-teacher ratio: 16:1 (state: 18:1)
> Child poverty rate: 36.1% (state: 11.9%)
Alaska’s Lower Yukon School District ranks as the worst in the state largely due to disadvantages outside of the classroom. Children raised by college-educated parents or guardians are more likely to succeed academically. But in the Lower Yukon district, only 3.8% of adults have a bachelor’s degree or higher compared to 29.2% of adults statewide. Additionally, the district’s child poverty rate is 36.1%, more than triple the 11.9% child poverty rate across the state. Such serious financial hardship presents a considerable hurdle to academic achievement for many students in the area.
The school system itself also gets low marks from school district and neighborhood review website Niche for academics and college prep.

Arizona: Gadsden School District 32
> Location: Yuma County
> Annual per student spending: $7,649 (state: $8,625)
> Student-to-teacher ratio: 36:1 (state: 24:1)
> Child poverty rate: 34.3% (state: 18.1%)
The Gadsden School District in southern Arizona ranks as the worst district in the state for student success. More than one-third of area children live below the poverty line, well above the 18.1% state child poverty rate.
Students are also less likely to have individualized instruction as the district has relatively large class sizes. There are 36 students for every one teacher in the district, more than double the ratio statewide of 24-to-1.
Arkansas: Forrest City School District
> Location: St. Francis County
> Annual per student spending: $11,655 (state: $10,388)
> Student-to-teacher ratio: 16:1 (state: 13:1)
> Child poverty rate: 39.2% (state: 19.9%)
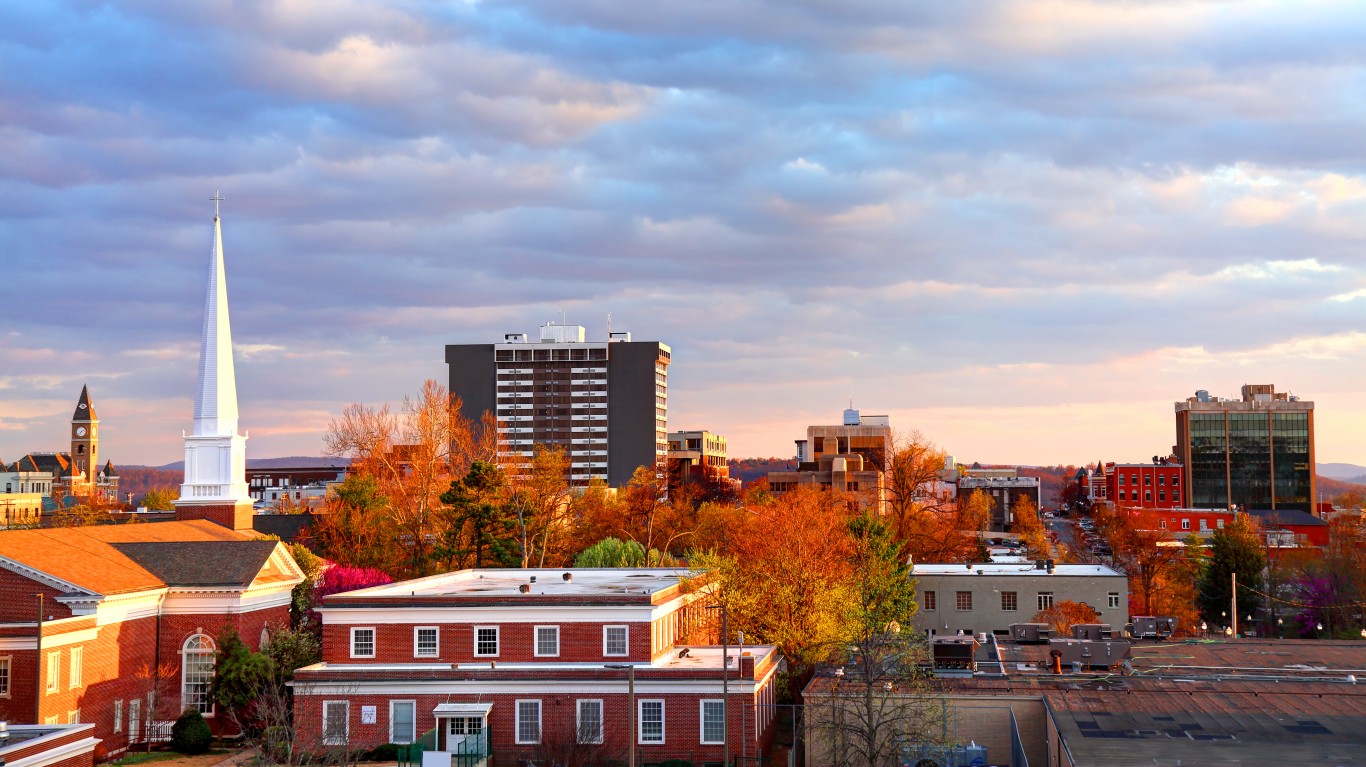
The Forrest City School District in eastern Arkansas ranks as the district where children are least likely to succeed in the state. Children living below the poverty line are more likely to struggle academically, and in the Forrest City district, nearly 40% of the under 18 population live in poverty, compared to less than 20% of children in the state.
Children raised by parents with a college degree are statistically more likely to succeed academically than those with parents with lower educational attainment. In the Forrest City district, just 10.2% of adults have a bachelor’s degree, less than half the 22.6% share of adults across Arkansas who do.
[in-text-ad-2]

California: Mendota Unified School District
> Location: Fresno County
> Annual per student spending: $12,746 (state: $14,035)
> Student-to-teacher ratio: N/A (state: 23:1)
> Child poverty rate: 42.7% (state: 15.2%)
Students in the Mendota Unified School District in central California face greater disadvantages to academic success than those in every other district in the state. At $12,746 a year, per-student spending in the district falls short of the statewide average of $14,035. Low spending likely partially explains why the district gets low marks for its resources and facilities from school district and neighborhood review website Niche.
Children of college-educated parents are more likely to succeed academically than those whose parents have lower educational attainment. In the Mendota Unified School District, only about one in every 50 adults have a bachelor’s degree, compared to about one in every three adults across California.

Colorado: Las Animas School District RE-1
> Location: Bent County
> Annual per student spending: $8,049 (state: $11,030)
> Student-to-teacher ratio: 60:1 (state: 17:1)
> Child poverty rate: 31.8% (state: 10.7%)
The Las Animas School District in southeastern Colorado has the worst odds for student success in the state. The district’s per pupil spending of $8,049 is about $3,000 below the average across Colorado. Likely partially as a result, class sizes are typically large, with an average of 60 students per teacher — more than triple the average size statewide. The district also gets low marks from school district and neighborhood review website Niche for academics and college prep.
Children of college-educated parents are more likely to succeed academically than those whose parents have lower educational attainment. In the Las Animas School District, only 9.7% adults have a bachelor’s degree, compared to 40.1% of adults across Colorado.
[in-text-ad]

Connecticut: Waterbury School District
> Location: New Haven County
> Annual per student spending: $18,110 (state: $21,310)
> Student-to-teacher ratio: 13:1 (state: 12:1)
> Child poverty rate: 33.9% (state: 12.9%)
The Waterbury School District in Connecticut has the worst odds for student success of any district in the state. Children in households with poverty-level incomes are less likely to succeed academically than those in more financially secure home environments. In the district, located in New Haven County, children are nearly three times more likely to live below the poverty line than children across the state as a whole.
While investment in education alone is no guarantee of better outcomes, higher school spending can improve the quality of education. Per pupil spending in the Waterbury district is just $18,110 a year, over $3,000 below the state average of $21,310.

Delaware: Woodbridge School District
> Location: Sussex County
> Annual per student spending: $15,027 (state: $16,315)
> Student-to-teacher ratio: 15:1 (state: 14:1)
> Child poverty rate: 29.0% (state: 15.2%)
The Woodbridge School District, centrally located on the Delmarva Peninsula, ranks as the worst district in Delaware. The district’s 29.0% child poverty rate is nearly double the 15.2% rate across the state. Such serious financial hardship presents a considerable hurdle to academic achievement for many students in the area.
Disadvantages are also present inside the classroom. According to school district review website Niche, the school system itself does not compare favorably in several important categories, including academics and college prep.

Florida: Hamilton County School District
> Location: Hamilton County
> Annual per student spending: $11,212 (state: $9,645)
> Student-to-teacher ratio: 20:1 (state: 17:1)
> Child poverty rate: 40.9% (state: 16.9%)
The Hamilton County School District, in Florida’s Hamilton County, ranks as the worst school district in the state. Many students in the district may be at a major disadvantage academically due to severe financial insecurity at home as poverty conditions can be a hurdle to academic success. An estimated 40.9% of area children live below the poverty line, more than double the 16.9% state child poverty rate.
The district itself gets low marks from school district and neighborhood review website Niche for academics and college prep.
[in-text-ad-2]

Georgia: Treutlen County School District
> Location: Treutlen County
> Annual per student spending: $10,631 (state: $11,228)
> Student-to-teacher ratio: 13:1 (state: 15:1)
> Child poverty rate: 49.5% (state: 18.6%)
Conditions in the Treutlen County School District, located about 100 miles west of Savannah, make it the school district in Georgia with the worst conditions for children’s academic success. School district and neighborhood review site Niche gives the district low scores for its resources and facilities, college prep, academics, and clubs and activities.
Economic conditions in the district, however, are perhaps the largest hindrance to academic success. Poverty is a predictor of poor academic performance, and about half of all children in the area live below the poverty line.
Hawaii: Hawaii Department of Education
> Location: Honolulu County
> Annual per student spending: $16,132 (state: $16,132)
> Student-to-teacher ratio: 15:1 (state: 15:1)
> Child poverty rate: 10.5% (state: 10.5%)
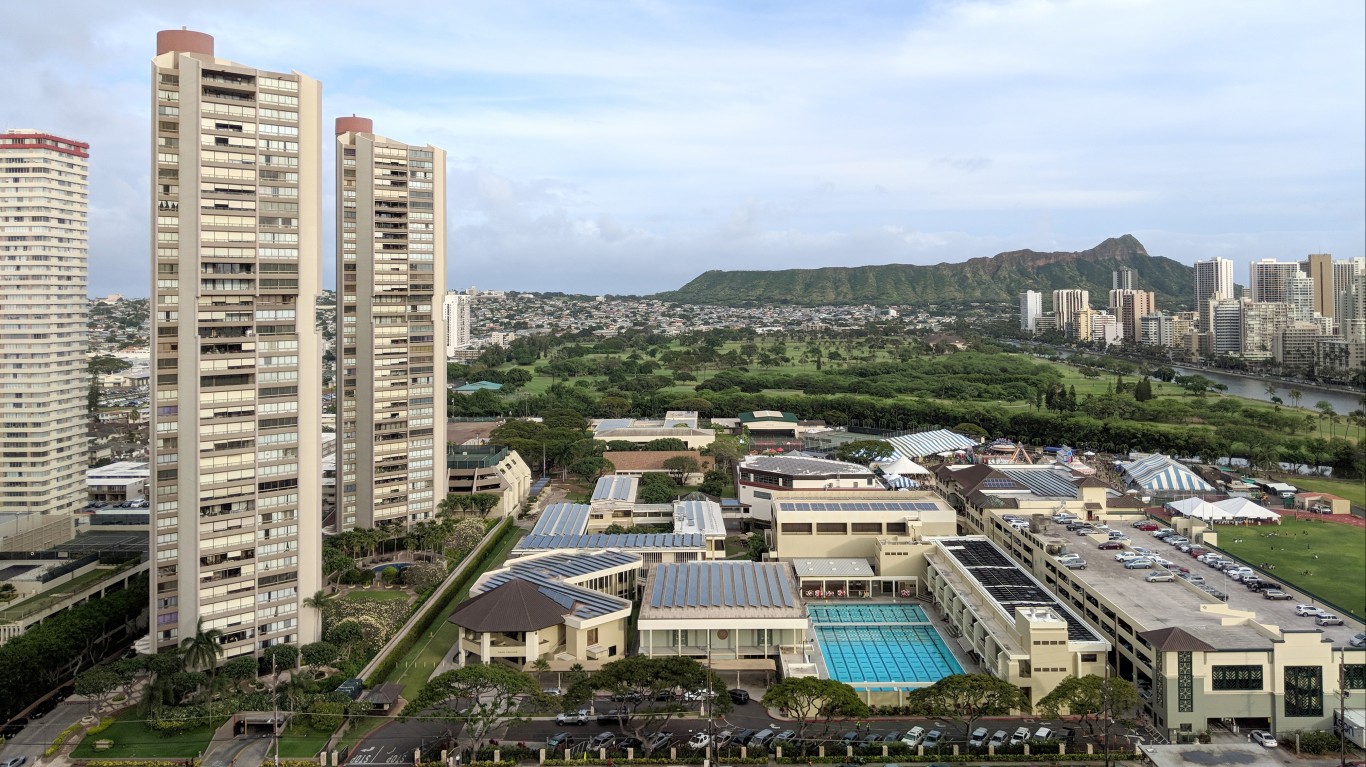
The whole of Hawaii is covered by a single school district, and as a result, the Hawaii Public School district, which manages nearly 300 schools and has over 180,000 students, ranks as the worst district in the state by default.
In fact, by some key measures, public school students in Hawaii are on better footing for success than most public school students nationwide. For example, there are an average of 15 students for every teacher in the district, one fewer than the national average. Additionally, Hawaii’s child poverty rate of 10.5% is well below the 15.8% national average.
[in-text-ad]

Idaho: Oneida County School District 351
> Location: Oneida County
> Annual per student spending: $5,345 (state: $7,985)
> Student-to-teacher ratio: 21:1 (state: 18:1)
> Child poverty rate: 12.3% (state: 11.2%)
The Oneida County School District is located near the southeast corner of Idaho. The district ranks as the worst in the state in part because of larger than average class sizes, which can make individualized instruction less likely. There are an average of 21 students for every teacher in the district, compared to 18 for every teacher across the state
The district’s large class sizes are attributable in part to relatively low investment. Per pupil spending in the district totals just $5,345 a year, well below the per pupil education spending statewide of $7,985 nationwide of $13,187.

Illinois: Prairie Hills Elementary School District 144
> Location: Cook County
> Annual per student spending: $13,082 (state: $16,227)
> Student-to-teacher ratio: 20:1 (state: 15:1)
> Child poverty rate: 31.6% (state: 14.6%)
The Prairie Hills Elementary School District 144, located just outside of Chicago, enrolls just under 3,000 students in grades PK-8. With a child poverty rate of 31.6%, the district ranks as having the worst conditions in the state for children’s academic success. Students in Prairie Hills are more than twice as likely to live below the poverty line as the typical student in Illinois as a whole, putting them at a possible considerable disadvantage academically as poverty can be a hurdle to academic success.
Class sizes are also larger than average in the district, with an average of 20 students per teacher — 25% more than the comparable average across the state.

Indiana: Union School Corporation
> Location: Randolph County
> Annual per student spending: $4,188 (state: $10,397)
> Student-to-teacher ratio: 22:1 (state: 17:1)
> Child poverty rate: 16.8% (state: 13.9%)
The Union School Corporation in east-central Indiana ranks as the worst district in the state. According to state test scores, 25% of students are proficient in reading and only 12% are proficient in math.
At just $4,188, annual per pupil spending in the district is less than half the statewide average. Partially as a result, class sizes are larger than average, meaning students are less likely to receive individualized instruction. There are 22 students for every teacher in the district, compared to the statewide ratio of 17-to-1.
[in-text-ad-2]

Iowa: Clayton Ridge Community School District
> Location: Clayton County
> Annual per student spending: $9,536 (state: $11,907)
> Student-to-teacher ratio: 26:1 (state: 14:1)
> Child poverty rate: 10.4% (state: 11.7%)
Clayton Ridge Community School District located in eastern Iowa ranks as the worst district in the state. Small class sizes can improve chances for academic success, but in Clayton Ridge, classes are large. There are an average of 26 students for every teacher in the district, well above the student-teacher ratio of 14:1 across the state.
According to neighborhood and school district review site Niche, Clayton Ridge ranks poorly for college prep, academics, and clubs and activities.

Kansas: Humboldt Unified School District 258
> Location: Allen County
> Annual per student spending: $9,187 (state: $11,926)
> Student-to-teacher ratio: 22:1 (state: 14:1)
> Child poverty rate: 14.3% (state: 12.9%)
The Humboldt Unified School District 258 in eastern Kansas ranks as the worst district in the state. Per pupil spending in the distinct totals just $9,187 a year, well below the $11,926 average spending statewide. While higher investment in education is no guarantee of improved outcomes, it can translate to certain advantages, such as small class sizes. In the Humboldt district, there are 22 students per teacher, well above the student-teacher ratio of 14:1 across the state.
According to neighborhood and school district review site Niche, Humboldt compares poorly to other districts in the state in college prep, academics, clubs and activities, and resources and facilities.
[in-text-ad]
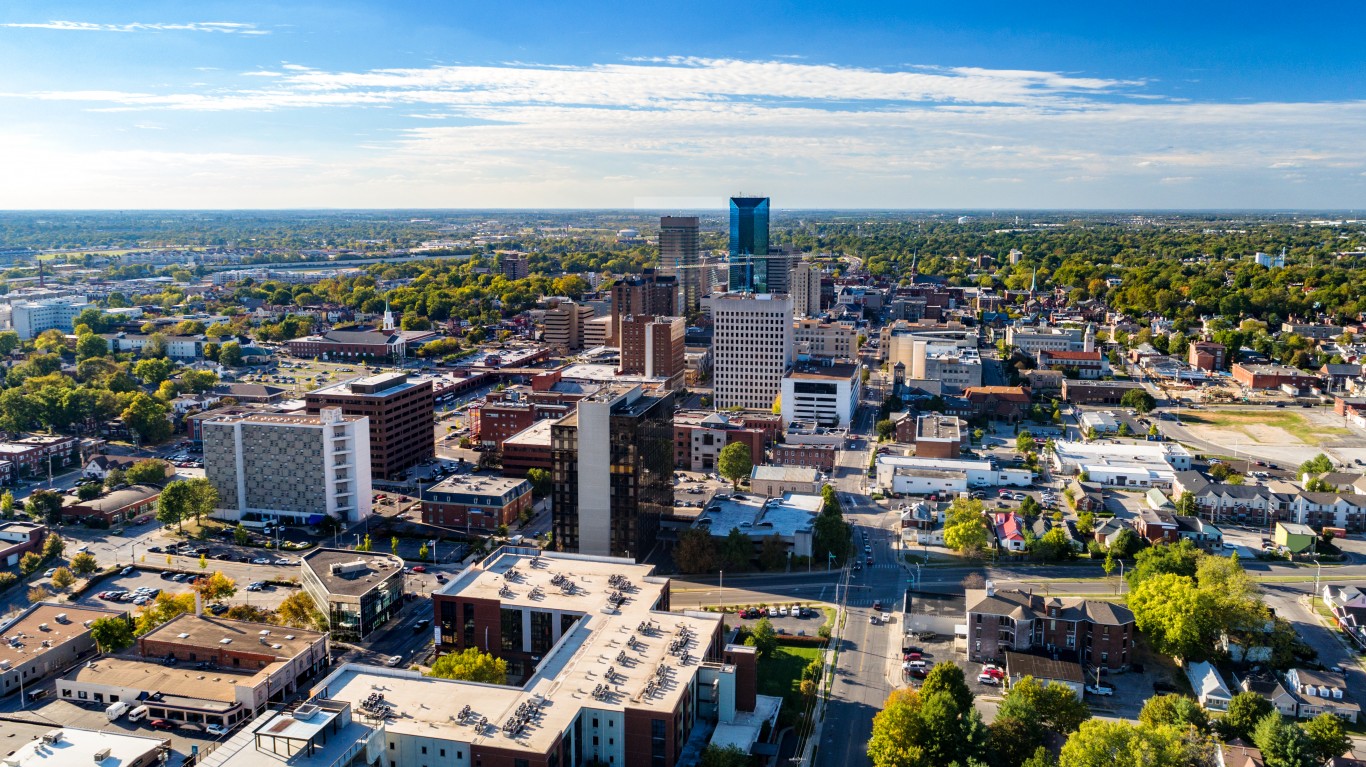
Kentucky: McCreary County School District
> Location: McCreary County
> Annual per student spending: $11,066 (state: $11,291)
> Student-to-teacher ratio: 17:1 (state: 16:1)
> Child poverty rate: 38.7% (state: 19.2%)
Children growing up in financially insecure households face greater hurdles to academic achievement than those in more financially secure environments. In Kentucky’s McCreary County School District, the district with the worst conditions in the state, 38.7% of children live below the poverty line, nearly double the 19.2% state child poverty rate.
Additionally, children who are raised by college-educated parents or guardians are more likely to succeed in school than those who are not. In the McCreary County district, only 7.2% of adults have a bachelor’s degree, less than a third of the statewide share of 23.6%.

Louisiana: Madison Parish School District
> Location: Madison Parish
> Annual per student spending: $12,457 (state: $11,755)
> Student-to-teacher ratio: 21:1 (state: 18:1)
> Child poverty rate: 54.2% (state: 25.4%)
The Madison Parish School District is located in northeastern Louisiana. Ranking as the worst district in the state, Madison has larger than average class sizes and performs poorly in a range of important measures related to academics, college prep, and clubs and activities, according to school district and neighborhood review site, Niche.
Economic conditions in the district are perhaps the largest hindrance to academic success, however. Poverty is a predictor of poor academic performance, and over half of all children in the area live below the poverty line.

Maine: School Administrative District 68
> Location: Piscataquis County
> Annual per student spending: $4,451 (state: $14,614)
> Student-to-teacher ratio: 20:1 (state: 12:1)
> Child poverty rate: 16.7% (state: 12.5%)
Maine School Administrative District 68 is a small district of about 1,000 students in central Maine. Per pupil spending in the distinct totals just $4,451 a year, about a third of the $14,614 average per pupil spending statewide. While higher investment in education is no guarantee of improved outcomes, it can translate to certain advantages, such as small class sizes. In Maine’s District 68, there are 20 students per teacher, well above the student-teacher ratio of 12:1 across the state.
[in-text-ad-2]

Maryland: Baltimore City Public Schools
> Location: Baltimore city
> Annual per student spending: $15,888 (state: $15,148)
> Student-to-teacher ratio: 16:1 (state: 15:1)
> Child poverty rate: 30.7% (state: 11.9%)
Baltimore City Public Schools, a massive district with nearly 80,000 students, ranks as the worst school district in Maryland. Children growing up in financially insecure households face greater challenges to academic success than those in more stable households, and across the Baltimore City district, 30.7% of children live in poverty, nearly triple the 11.9% statewide child poverty rate.
According to neighborhood and school district review site Niche, Baltimore city schools district also compares poorly for college prep, academics, and resources and facilities.

Massachusetts: Chelsea School District
> Location: Suffolk County
> Annual per student spending: $15,676 (state: $17,748)
> Student-to-teacher ratio: 15:1 (state: 13:1)
> Child poverty rate: 28.1% (state: 11.5%)
The Chelsea School District, located just north of Boston, ranks as the worst district in Massachusetts. The reduced likelihood of success in the district is due largely to conditions outside the classroom. Children growing up in financially insecure households face greater challenges to academic success than those in more stable households, and across the district, 28.1% of children live in poverty, well above the 11.5% statewide child poverty rate.
Children with college-educated parents are more likely to do well in school than those with parents with lower educational attainment. In the Chelsea district, just 18.5% of adults have a bachelor’s degree or higher, compared to 42.9% of adults across Massachusetts.
[in-text-ad]

Michigan: River Rouge School District
> Location: Wayne County
> Annual per student spending: $11,349 (state: $12,756)
> Student-to-teacher ratio: 26:1 (state: 18:1)
> Child poverty rate: 46.0% (state: 16.3%)
Michigan’s River Rouge School District, located just south of Detroit, ranks as the worst district in the state. Neighborhood and school district review site Niche gives River Rouge low marks for its academics and college prep.
Economic conditions in the district are perhaps the largest hindrance to academic success, however. Poverty is a predictor of poor academic performance, and 46.0% of all children in the area live below the poverty line, compared to the child poverty rate of 16.3% across the state.

Minnesota: Worthington Public School District
> Location: Nobles County
> Annual per student spending: $10,566 (state: $13,387)
> Student-to-teacher ratio: 22:1 (state: 16:1)
> Child poverty rate: 14.3% (state: 10.4%)
The Worthington Public School District, located in southwestern Minnesota, ranks as the worst district in the state. Per pupil spending in the distinct totals just $10,566 a year, well below the $13,387 state average. While greater investment in education is no guarantee of improved outcomes, it can translate to certain advantages, such as small class sizes. In the Worthington district, there are 22 students per teacher, which is well above the student-teacher ratio of 16:1 across the state.
The district also gets low marks from school district and neighborhood review website Niche for academics and resources and facilities.

Mississippi: North Bolivar Consolidated School District
> Location: Bolivar County
> Annual per student spending: $10,199 (state: $9,284)
> Student-to-teacher ratio: 15:1 (state: 15:1)
> Child poverty rate: 59.7% (state: 26.4%)
The North Bolivar Consolidated School District ranks as the worst school district in Mississippi. The reduced likelihood of success in the district is due largely to conditions outside the classroom. Children growing up in financially insecure households face greater challenges to academic success than those in more financially stable households, and across the district, 59.7% of children live in poverty, well above the 26.4% statewide child poverty rate.
The district also gets low marks from school district and neighborhood review website Niche for academics, college prep, clubs and activities, and resources and facilities.
[in-text-ad-2]

Missouri: Hayti R-II School District
> Location: Pemiscot County
> Annual per student spending: $9,945 (state: $11,200)
> Student-to-teacher ratio: 13:1 (state: 13:1)
> Child poverty rate: 43.8% (state: 15.9%)
Hayti R-II is a small school district of fewer than 700 students in Missouri’s southeastern corner. According to state standardized test scores, just 22% of students in the district are proficient in reading, and only 12% are proficient in math. According to school district review site Niche, the district lags in important measures indicative of academic quality and preparing students for college.
Other disadvantages in the district are outside of the classroom. Students living in poverty are less likely to succeed academically than those in more financially secure households, and in the Hayti district, 43.8% of children live below poverty line, more than double the 15.9% state poverty rate.

Montana: Browning H S Dist 9
> Location: Glacier County
> Annual per student spending: $12,462 (state: $11,988)
> Student-to-teacher ratio: 16:1 (state: 14:1)
> Child poverty rate: 31.7% (state: 14.2%)
Certain conditions in Montana’s Browning H S Dist 9 make it the worst district in the state. Children growing up in financially insecure households can face greater academic challenges, and in the Browning district, 31.7% of children live below the poverty line, more than double the 14.2% share of children across the state who do.
Disadvantages are evident in student outcomes. Of the just over 600 students enrolled in grades 9-12 in the district, only 5% are proficient in math and 5% proficient in reading, according to state standardized testing.
[in-text-ad]

Nebraska: Lexington Public Schools
> Location: Dawson County
> Annual per student spending: $11,971 (state: $12,743)
> Student-to-teacher ratio: 15:1 (state: 14:1)
> Child poverty rate: 13.7% (state: 10.3%)
The Lexington Public School district, located in south-central Nebraska, ranks as the worst district in the state. Children with college-educated parents or guardians are more likely to succeed academically than children with less educated parents, and in the Lexington district, only 12.5% of adults have a bachelor’s degree, less than half the 31.3% share of adults across Nebraska.
While the relationship between school spending and academic outcomes is complicated, greater investment can provide students with considerable advantages. In Lexington, however, per pupil spending totals just $11,971 a year, about $800 less than the state average.

Nevada: White Pine County School District
> Location: White Pine County
> Annual per student spending: $10,543 (state: $9,344)
> Student-to-teacher ratio: 28:1 (state: 20:1)
> Child poverty rate: 15.0% (state: 16.5%)
The White Pine County School District in eastern Nevada ranks as the worst district in the state. Smaller class sizes can result in more individualized instruction for students, and ultimately improved outcomes. In White Pine, however, there are 28 students for every teacher, compared to a statewide average student-teacher ratio of 20-to-1.
The district also gets low marks from school district and neighborhood review website Niche for academics, college prep, clubs and activities, and resources and facilities.

New Hampshire: Berlin School District
> Location: Coos County
> Annual per student spending: $17,739 (state: $17,462)
> Student-to-teacher ratio: 12:1 (state: 12:1)
> Child poverty rate: 19.9% (state: 7.5%)
Children growing up in financially insecure households face greater hurdles to academic achievement than those in more financially secure environments. In New Hampshire’s Berlin School District, the worst district in the state, 19.9% of children live below the poverty line, more than double the 7.5% state child poverty rate.
Additionally, children who are raised by college-educated parents or guardians are more likely to succeed in school than those who are not. In the Berlin district, only 12.4% of adults have a bachelor’s degree, less than a third of the statewide share of 36.5%.
[in-text-ad-2]

New Jersey: Trenton City School District
> Location: Mercer County
> Annual per student spending: $16,791 (state: $20,512)
> Student-to-teacher ratio: 16:1 (state: 12:1)
> Child poverty rate: 31.7% (state: 11.5%)
New Jersey’s Trenton City School District ranks as the worst district in the state. Children growing up in financially insecure households can face academic challenges, and in the Trenton district, 31.7% of children live below the poverty line, nearly triple the 11.5% share of children across the state who do. The district also gets low marks from school district and neighborhood review website Niche for academics, college prep, clubs and activities, and resources and facilities.
These disadvantages are evident in academic outcomes. Only 20% of district students are proficient in reading and just 10% are proficient in math, according to state standardized testing results.

New Mexico: West Las Vegas Public Schools
> Location: San Miguel County
> Annual per student spending: $12,455 (state: $10,177)
> Student-to-teacher ratio: 16:1 (state: 15:1)
> Child poverty rate: 38.1% (state: 22.4%)
The West Las Vegas school district, located in northern New Mexico just east of Santa Fe, ranks as the worst district in the state. According to school district review website Niche, the school district does not rank favorably in a number of important categories, including academics, college prep, and clubs and activities.
Other disadvantages are outside of the classroom. Children raised by parents or guardians with a college education are more likely to succeed academically than those who are not. In the West Las Vegas district, only 13.9% of adults have a bachelor’s degree, half the statewide share of 27.1%.
[in-text-ad]

New York: Niagara Falls City School District
> Location: Niagara County
> Annual per student spending: $18,524 (state: $25,139)
> Student-to-teacher ratio: 20:1 (state: 12:1)
> Child poverty rate: 31.4% (state: 17.2%)
The Niagara Falls City School District, located in western New York, ranks as the worst district in the state. Per pupil spending in the distinct totals $18,524 a year, well below the $25,139 state average. While higher investment in education is no guarantee of improved outcomes, it can translate to certain advantages, such as small class sizes. In the Niagara Falls district, there are 20 students per teacher, well above the student-teacher ratio of 12:1 across the state.
Outside of the classroom, many students are disadvantaged by financial insecurity. An estimated 31.4% of children in the district live below the poverty line, compared to 17.2% of children across New York.

North Carolina: Robeson County Schools
> Location: Robeson County
> Annual per student spending: $9,979 (state: $9,857)
> Student-to-teacher ratio: 16:1 (state: 15:1)
> Child poverty rate: 44.6% (state: 18.1%)
North Carolina’s Robeson County School district, located along the state’s southern border, ranks as the worst in the state. Children growing up in financially insecure households can face more struggles academically, and in the Robeson district, 44.6% of children live below the poverty line, more than double the 18.1% share of children across the state who do. The district also gets low marks from Niche for academics, college prep, and resources and facilities.
These disadvantages are evident in academic outcomes. Only 26% of district students are proficient in reading and just 23% are proficient in math, according to state standardized testing results.

North Dakota: Williams County School District 8
> Location: Williams County
> Annual per student spending: $10,227 (state: $14,004)
> Student-to-teacher ratio: 26:1 (state: 13:1)
> Child poverty rate: 4.9% (state: 10.2%)
The Williams County School District 8, located in western North Dakota, ranks as the worst district in the state. Per pupil spending in the distinct totals $10,227 a year, well below the $14,004 state average. While higher investment in education is no guarantee of improved outcomes, it can translate to certain advantages, such as small class sizes. In the Williams County district, there are 26 students per teacher, double the student-teacher ratio of 13:1 across the state.
As of July 1, 2021, the district merged with nearby Williston Basin School District #1, another district with relatively low per student spending but with class sizes closer in line with the state average.
[in-text-ad-2]

Ohio: Clearview Local School District
> Location: Lorain County
> Annual per student spending: $9,770 (state: $13,538)
> Student-to-teacher ratio: 20:1 (state: 16:1)
> Child poverty rate: 30.0% (state: 16.6%)
Children growing up in financially insecure households are less likely to succeed academically, and in Ohio’s Clearview Local School District, 30.0% of children live below the poverty line, nearly double the state’s 16.6% child poverty rate. Partially as a result, Clearview ranks as the worst district in the state.
Class sizes are also larger than average in the district, with 20 students per teacher compared to Ohio’s average student-teacher ratio of 16-to-1. Class sizes could be reduced in the district with greater investment in schools. Currently, spending totals just $9,770 per pupil annually, well below the comparable state spending of $13,538.

Oklahoma: Carnegie Public Schools
> Location: Caddo County
> Annual per student spending: $11,060 (state: $9,323)
> Student-to-teacher ratio: 14:1 (state: 16:1)
> Child poverty rate: 45.1% (state: 18.4%)
Carnegie Public School District, located near the center of Oklahoma, ranks as the worst district in the state largely due to circumstances outside of the classroom. Children with college-educated parents are more likely to do well in school than those with parents with lower educational attainment. In the Carnegie district, just 14.4% of adults have a bachelor’s degree or higher, compared to 25.2% of adults across Oklahoma.
Other disadvantages are economic. Children growing up in financially insecure households may struggle more academically, and in the Carnegie district, 45.1% of children live below the poverty line, more than double the 18.4% share of children across the state who do.
[in-text-ad]

Oregon: Marcola School District
> Location: Lane County
> Annual per student spending: $9,521 (state: $12,450)
> Student-to-teacher ratio: 38:1 (state: 20:1)
> Child poverty rate: 6.9% (state: 12.8%)
The Marcola School District, located in east-central Oregon, ranks as the worst district in the state. According to school district review website Niche, the school system does not compare favorably in a number of important categories, including academics, college prep, and clubs and activities.
Class sizes are also larger than average in the district, with 38 students per teacher, compared to Oregon’s average student-teacher ratio of 20-to-1. Class sizes in the district could be reduced with greater investment in schools. Currently, spending totals just $9,521 per pupil annually, below the comparable state spending of $12,450.

Pennsylvania: Greater Johnstown School District
> Location: Cambria County
> Annual per student spending: $13,558 (state: $16,864)
> Student-to-teacher ratio: 15:1 (state: 14:1)
> Child poverty rate: 42.7% (state: 15.9%)
The Greater Johnstown School District, located in the southwestern section of Pennsylvania, ranks as the worst district in the state. School district review site Niche gives the district low marks for academics and college prep. Additionally, according to standardized test scores, 31% of local students are proficient in reading, and only 15% are proficient in math.
Many students also face considerable disadvantages outside of the classroom. Children growing up in financially insecure households are less likely to succeed academically, and in the Johnstown district, 42.7% of children live below the poverty line, more than double the 15.9% share of children across the state who do.

Rhode Island: Central Falls School District
> Location: Providence County
> Annual per student spending: $17,432 (state: $16,750)
> Student-to-teacher ratio: 14:1 (state: 13:1)
> Child poverty rate: 28.6% (state: 15.4%)
The Central Falls School District enrolls some 2,700 students just north of Providence near the Massachusetts border. The worst district in the state, only 13% of students are proficient in reading and just 8% are proficient in math, according to standardized test scores. School district review site Niche gives the district low marks for academics and college prep.
Outside of the classroom, children are more likely to grow up below the poverty line and less likely to be raised by adults with a bachelor’s degree than children across the state as a whole. These socioeconomic indicators are tied with greater chance of poor academic performance.
[in-text-ad-2]

South Carolina: Dillon School District 4
> Location: Dillon County
> Annual per student spending: $9,510 (state: $11,140)
> Student-to-teacher ratio: 17:1 (state: 15:1)
> Child poverty rate: 32.7% (state: 19.0%)
Dillon School District, located in northeastern South Carolina, ranks as the worst district in the state partially because of circumstances outside of the classroom. Children with college-educated parents are more likely to do well in school than those with parents with lower educational attainment. In the Dillon district, just 10.5% of adults have a bachelor’s degree or higher, compared to 27.4% of adults across South Carolina.
Class sizes are also larger than average in the district, with 17 students per teacher, compared to South Carolina’s average student-teacher ratio of 15-to-1. Class sizes in the district could be reduced with greater investment in schools. Currently, spending totals just $9,510 per pupil annually, below the comparable state spending of $11,140.

South Dakota: Todd County School District 66-1
> Location: Todd County
> Annual per student spending: $13,485 (state: $10,139)
> Student-to-teacher ratio: 13:1 (state: 14:1)
> Child poverty rate: 43.8% (state: 13.6%)
The Todd County School District enrolls some 2,100 students in south-central South Dakota. The worst district in the state, only 9% of students are proficient in reading and just 4% are proficient in math, according to state test scores. School district review site Niche gives the district low marks for academics and college prep.
Students in the district are more likely than most to face disadvantages outside of the classroom. Poverty can reduce the likelihood of academic success for any student, and in the Todd County district, 43.8% of children live below the poverty line, more than triple the 13.6% state child poverty rate.
[in-text-ad]

Tennessee: Union County School District
> Location: Union County
> Annual per student spending: $7,852 (state: $9,868)
> Student-to-teacher ratio: 20:1 (state: 16:1)
> Child poverty rate: 25.9% (state: 18.0%)
The Union County School District, located in eastern Tennessee, ranks as the worst district in the state. According to school district review website Niche, the school district does not rank favorably in a number of important categories, including academics, college prep, resources and facilities, and clubs and activities.
Class sizes are also larger than average in the district, with 20 students per teacher, compared to Tennessee’s average student-teacher ratio of 16-to-1. Class sizes in the district could be reduced with greater investment in schools. Currently, spending totals just $7,852 per pupil annually, below the comparable state spending of $9,868.

Texas: Edgewood Independent School District
> Location: Bexar County
> Annual per student spending: $9,922 (state: $9,827)
> Student-to-teacher ratio: 16:1 (state: 15:1)
> Child poverty rate: 35.9% (state: 18.0%)
Texas’ Edgewood Independent School District, located in San Antonio, ranks as the worst in the state largely due to disadvantages outside of the classroom. Children raised by college-educated parents or guardians are more likely to succeed academically. But in the Edgewood district, only 4.6% of adults have a bachelor’s degree or higher, compared to 29.3% of adults statewide.
Additionally, the district has a 35.9% child poverty rate, which is nearly double the 18.0% rate across the state. Such serious financial hardship presents a considerable hurdle to academic achievement for many students in the area.

Utah: Uintah School District
> Location: Uintah County
> Annual per student spending: $8,365 (state: $8,014)
> Student-to-teacher ratio: 24:1 (state: 23:1)
> Child poverty rate: 11.1% (state: 8.7%)
Uintah School District, located in eastern Utah, ranks as the worst district in the state partially because of circumstances outside of the classroom. Children with college-educated parents are more likely to do well in school than those with parents with lower educational attainment. In the Uintah district, just 15.8% of adults have a bachelor’s degree or higher, less than half the 33.3% share of adults across Utah who do.
According to school district review website Niche, the school system itself does not compare favorably in a number of important categories, including academics, resources and facilities, and clubs and activities.
[in-text-ad-2]
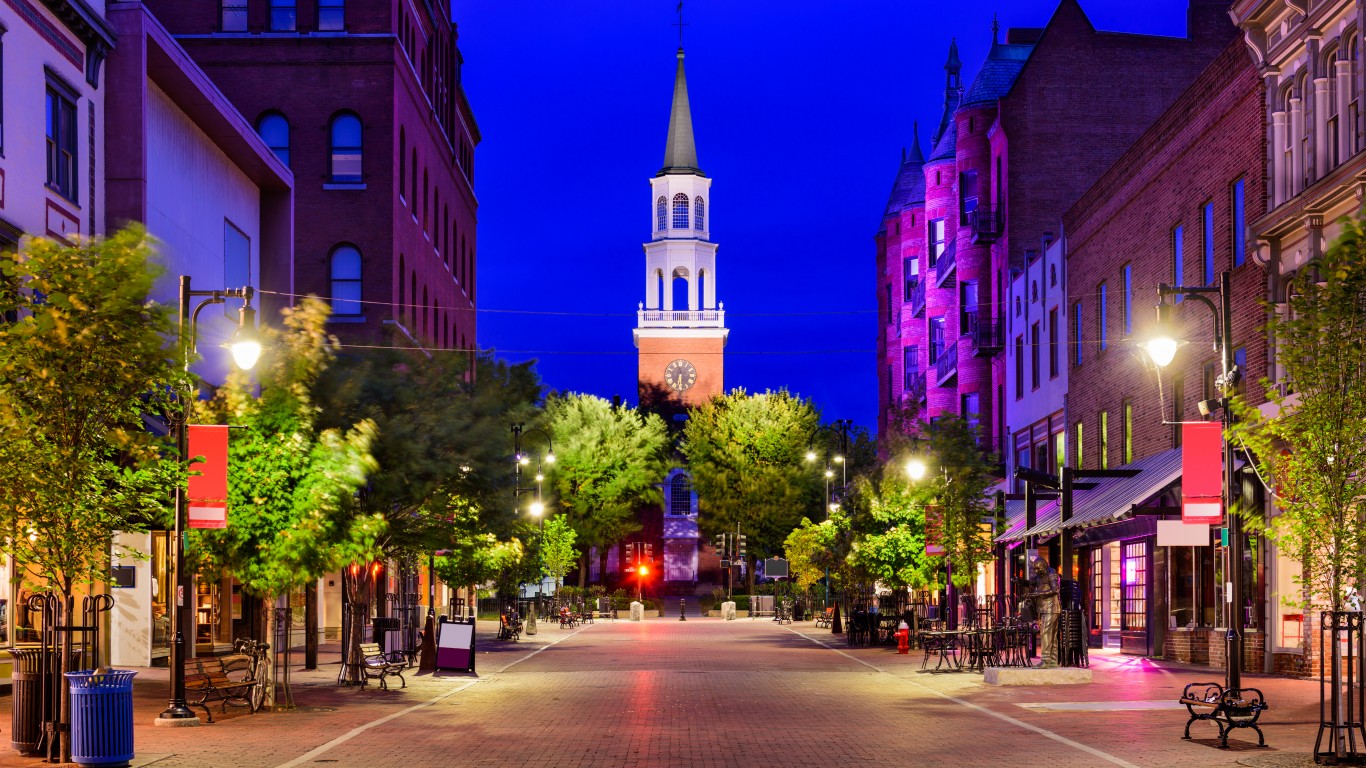
Vermont: St. Johnsbury Town School District
> Location: Caledonia County
> Annual per student spending: $13,187 (state: $20,315)
> Student-to-teacher ratio: 23:1 (state: 11:1)
> Child poverty rate: 20.6% (state: 9.8%)
The St. Johnsbury Town School District in northeastern Vermont ranks as the worst school district in the state. Per pupil spending in the distinct totals $13,187 a year, well below the $20,315 state average. While greater investment in education is no guarantee of improved outcomes, it can translate to certain advantages, such as small class sizes. In the St. Johnsbury district, there are 23 students per teacher, well above the student-teacher ratio of 11:1 across the state.
Outside the classroom, a relatively large share of local students are disadvantaged by financial hardship — which can negatively impact academic performance. An estimated 20.6% of children in the area live below the poverty line, more than double Vermont’s child poverty rate of 9.8%.

Virginia: Colonial Beach Public Schools
> Location: Westmoreland County
> Annual per student spending: $11,289 (state: $12,641)
> Student-to-teacher ratio: 17:1 (state: 15:1)
> Child poverty rate: 37.1% (state: 12.5%)
The Colonial Beach school district, located in eastern Virginia along the Potomac River, ranks as the worst district in the state. According to school district review website Niche, the school system does not compare favorably in a number of important categories, including academics, college prep, and clubs and activities.
Outside the classroom, a relatively large share of local students are disadvantaged by financial hardship — which can negatively impact academic performance. An estimated 37.1% of children in the area live below the poverty line, nearly three times the child poverty rate of 12.5% across Virginia.
[in-text-ad]

Washington: Mary M. Knight School District
> Location: Mason County
> Annual per student spending: $10,469 (state: $14,223)
> Student-to-teacher ratio: 39:1 (state: 18:1)
> Child poverty rate: 25.2% (state: 11.2%)
The Mary M. Knight School District enrolls some 1,700 students in Mason County in western Washington. The district ranks as the worst in the state partially because of its large class sizes. There are an average of 39 students for every teacher in the district, more than double the 18-to-1 statewide student-teacher ratio.
Outside the classroom, a relatively large share of local students are disadvantaged by financial hardship — which can negatively impact academic performance. An estimated 25.2% of children in the area live below the poverty line, more than double the child poverty rate of 11.2% across Washington.

West Virginia: McDowell County School District
> Location: McDowell County
> Annual per student spending: $13,070 (state: $12,010)
> Student-to-teacher ratio: 13:1 (state: 14:1)
> Child poverty rate: 40.9% (state: 19.6%)
The McDowell County School District in southern West Virginia ranks as the worst in the state. School district review site Niche gives the district low marks for academics, clubs and activities, and college prep.
Outside of the classroom, children are more likely to grow up below the poverty line and less likely to be raised by adults with a bachelor’s degree than children across the state as a whole. Both these socioeconomic indicators are tied with a reduced likelihood of academic success.

Wisconsin: Milwaukee School District
> Location: Milwaukee County
> Annual per student spending: $14,145 (state: $12,598)
> Student-to-teacher ratio: 17:1 (state: 14:1)
> Child poverty rate: 30.0% (state: 12.7%)
The Milwaukee School District is by far the largest in Wisconsin, with total enrollment exceeding 75,000. It also ranks as the worst school district in the state. Just 18% of students are proficient in reading, and only 15% are proficient in math, according to state test scores. School review site Niche gives the district low marks for academics, college prep, and resources and facilities.
The reduced likelihood of student success in the district may also be due to slightly larger than average class sizes. There are 17 students per teacher in the district, compared to only 14 per teacher across the state as a whole, on average.
[in-text-ad-2]
Wyoming: Niobrara County School District 1
> Location: Niobrara County
> Annual per student spending: $14,656 (state: $16,304)
> Student-to-teacher ratio: 13:1 (state: 13:1)
> Child poverty rate: 19.6% (state: 10.1%)
The Niobrara County School District 1 ranks as the worst school district in Wyoming. The district, located in eastern Wyoming, has a 19.6% child poverty rate, which is nearly double the 10.1% rate across the state. Such serious financial hardship presents a considerable hurdle to academic achievement for many students in the area.
Disadvantages are also present inside the classroom. According to school district review website Niche, the school district itself does not compare favorably in important categories like academics and college prep.
Methodology:
To determine the worst school district in every state, 24/7 Wall St. developed an index based on various measures of school finance, student success, and other socioeconomic measures, specifically: the child poverty rate, the teacher-to-student ratio, per-pupil spending on education, and the share of adults with a college education. Data on per pupil spending in 2019 came from the U.S. Census Bureau’s Annual Survey of School System Finances. Data on the ratio of students to teachers in the 2019-2020 school year came from the National Center for Education Statistics. Data on the percentage of children aged 5 to 17 living in poverty in 2019 came from the U.S. Census Bureau’s Small Area Income and Poverty Estimates program. Finally, five-year data on the percentage of adults 25 and over with at least a bachelor’s degree by school district in 2019 came from the U.S. Census Bureau’s American Community Survey. Only school districts with at least 500 students and at least three of four index data points were considered.
We excluded any school district with an overall rating of B- or higher on school district and neighborhood review site Niche. Districts in which most students attend classes online were also excluded.
Travel Cards Are Getting Too Good To Ignore (sponsored)
Credit card companies are pulling out all the stops, with the issuers are offering insane travel rewards and perks.
We’re talking huge sign-up bonuses, points on every purchase, and benefits like lounge access, travel credits, and free hotel nights. For travelers, these rewards can add up to thousands of dollars in flights, upgrades, and luxury experiences every year.
It’s like getting paid to travel — and it’s available to qualified borrowers who know where to look.
We’ve rounded up some of the best travel credit cards on the market. Click here to see the list. Don’t miss these offers — they won’t be this good forever.
Thank you for reading! Have some feedback for us?
Contact the 24/7 Wall St. editorial team.
 24/7 Wall St.
 24/7 Wall St.
 24/7 Wall St.
 24/7 Wall St.

