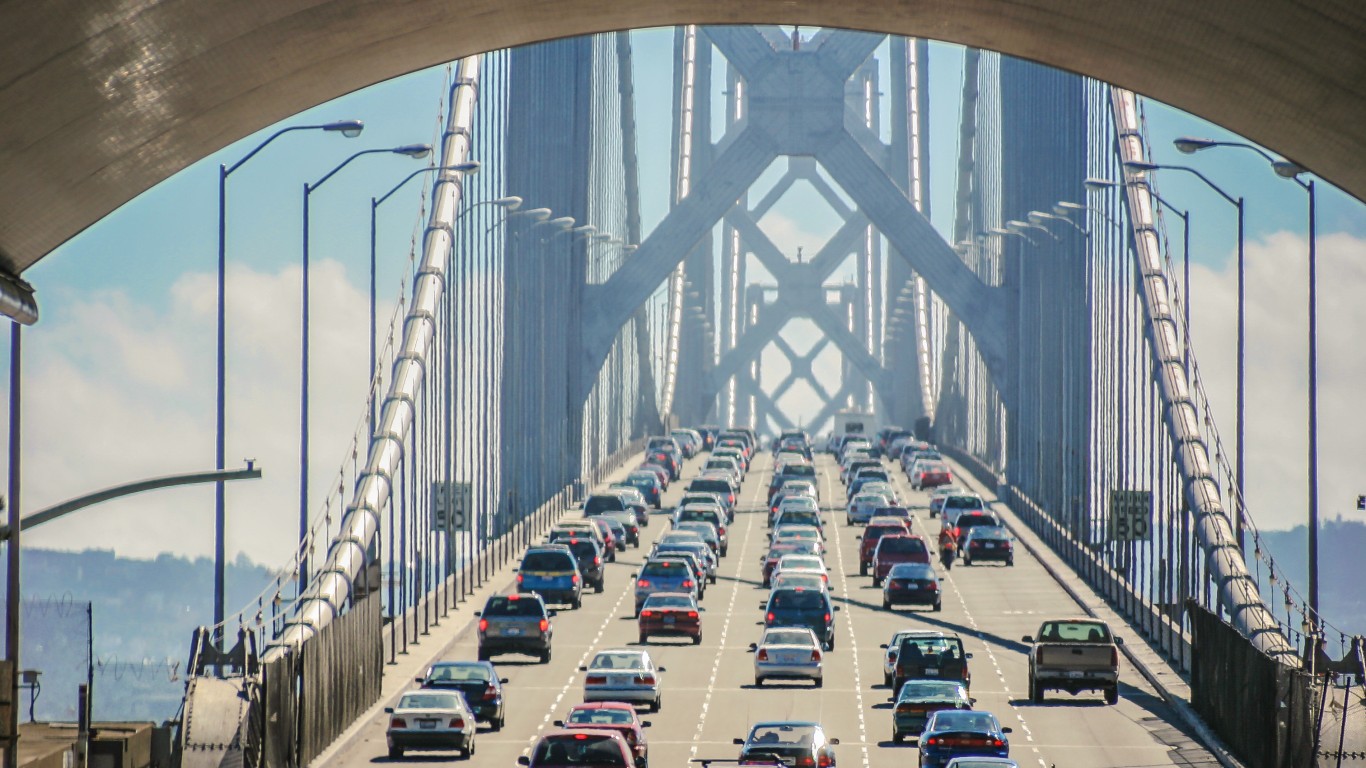
As most people who commute by car know, rush hour is often anything but speedy. The times of the day when people are most likely driving to and from work is also when you’re most likely to be stuck in gridlock, trapped in a merge lane, or rolling along at a bicycle’s pace in a mile-long backup of vehicles.
According to Tom Vanderbilt, author of the 2008 book “Traffic,” the main cause of traffic congestion has less to do with poor road conditions but rather with drivers themselves, who fail to maintain steady speeds, ignore better vehicle-merging techniques, and opt to tolerate congestion instead of using mass transit when that option is available to them. And building more roads isn’t the solution: Numerous studies have shown that expanding road capacity encourages more people to drive, leading to no discernible improvement in traffic flow. In some cases, widening roads has actually led to slower traffic.
Whatever the causes of congestion may be, the time drivers lose to traffic tends to correlate with population density. So, it’s no surprise that drivers in the largest metro areas in the United States – New York and Los Angeles – experience the most time-wasting traffic congestion. But more surprising is that smaller cities can have worse traffic than larger ones. For example, drivers in Baton Rouge, Louisiana, a city with a population of about 224,000, waste more time in gridlock than drivers in Houston, a city of 2.3 million. (These are America’s 50 worst cities to drive in.)
Time lost to traffic congestion can be measured by comparing the added time it takes to travel a distance during peak driving times to “free flow” drive times when there is little or no congestion, which typically occurs at night. (These are the safest cities for driving.)
Click here to see the cities where people lost the most time driving each year
To find the 26 U.S. cities with the most time lost to driving each year, 24/7 Tempo reviewed data from the TomTom Traffic Index, which tracks urban congestion in 404 cities across 58 countries. Average commute time (five-year data) and population density come from the U.S. Census Bureau 2019 American Community Survey. The data is for the city proper in all cases except for Honolulu, where it covers the Urban Honolulu metro area.
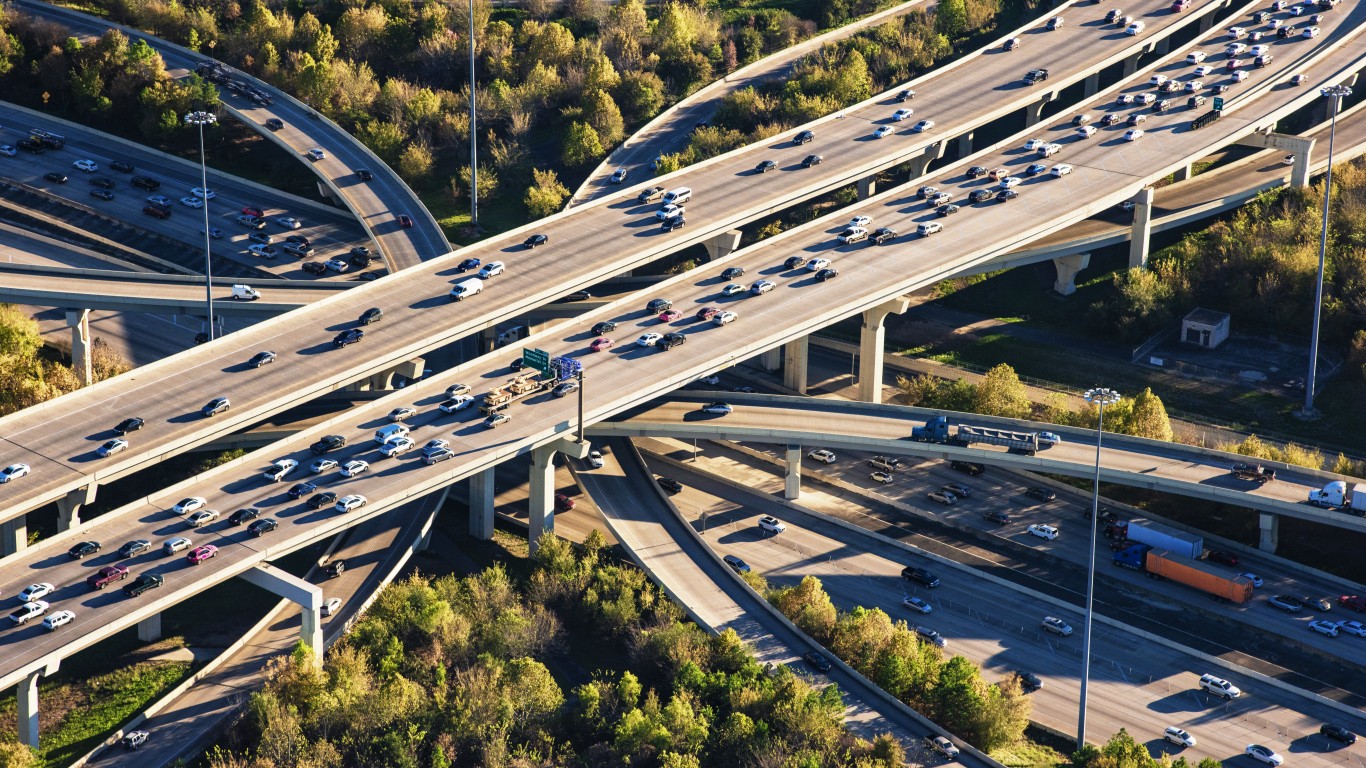
16. Houston, TX
> Time lost to traffic per year: 46 hours
> Congestion level, 2021: 20%
> Avg. commute time: 27.7 minutes
> Population density: 3,598 per sq mile
[in-text-ad]
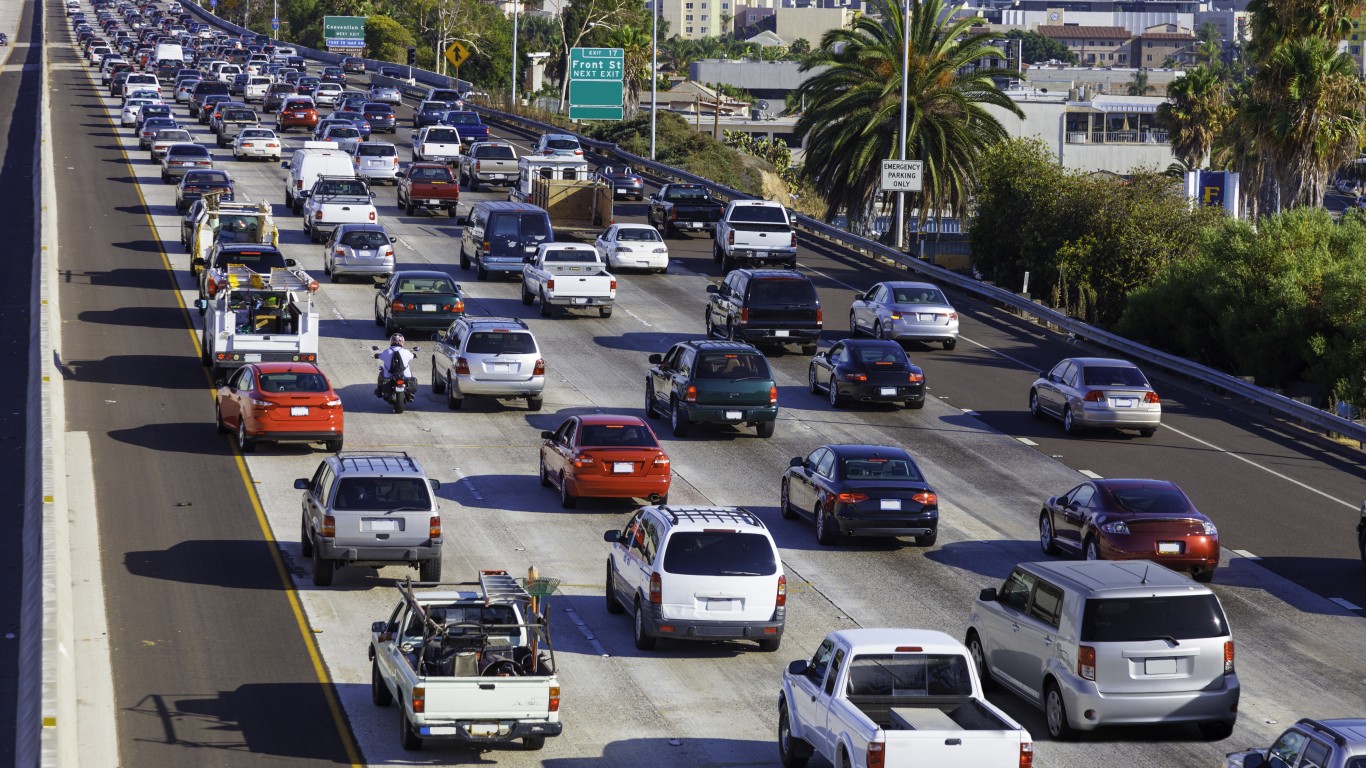
16. San Diego, CA
> Time lost to traffic per year: 46 hours
> Congestion level, 2021: 20%
> Avg. commute time: 24.5 minutes
> Population density: 4,256 per sq mile

16. Fresno, CA
> Time lost to traffic per year: 46 hours
> Congestion level, 2021: 20%
> Avg. commute time: 22.2 minutes
> Population density: 4,689 per sq mile
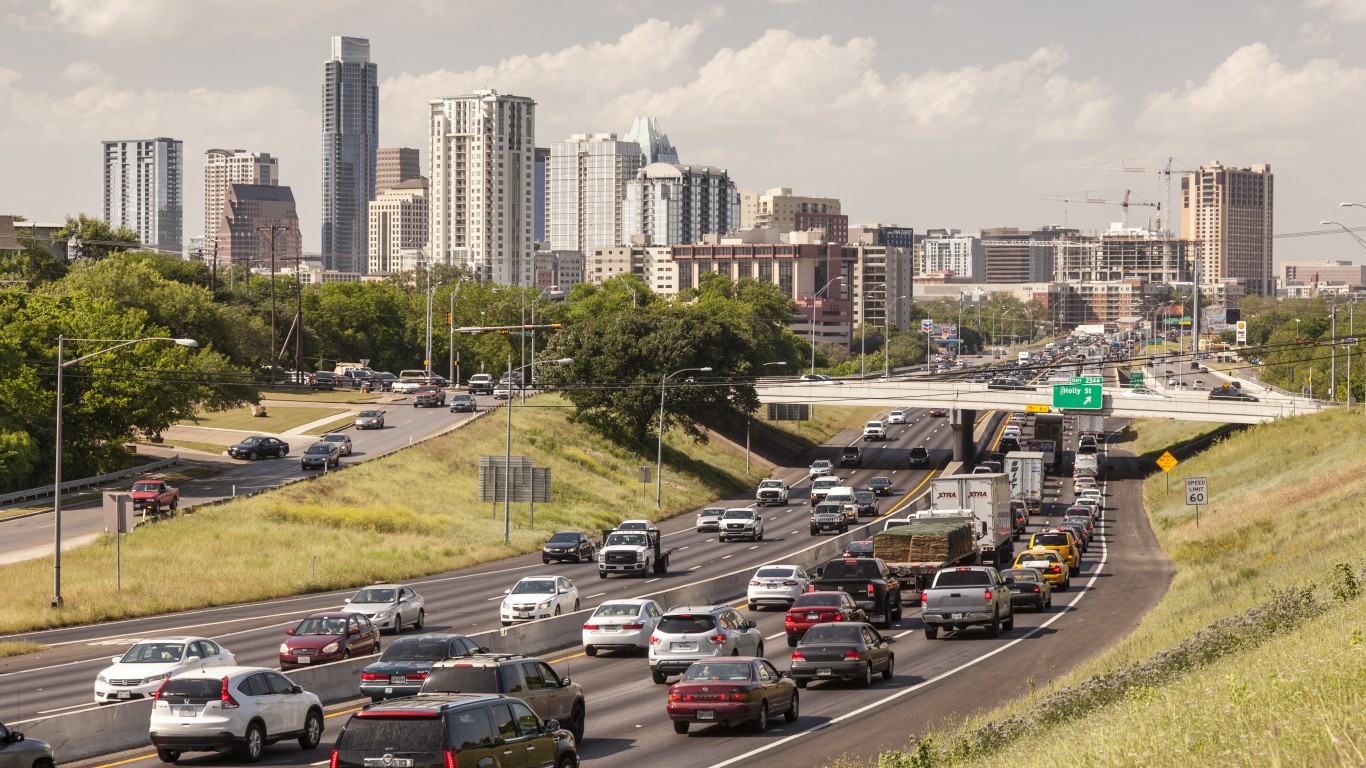
16. Austin, TX
> Time lost to traffic per year: 46 hours
> Congestion level, 2021: 20%
> Avg. commute time: 24.5 minutes
> Population density: 3,006 per sq mile
[in-text-ad-2]
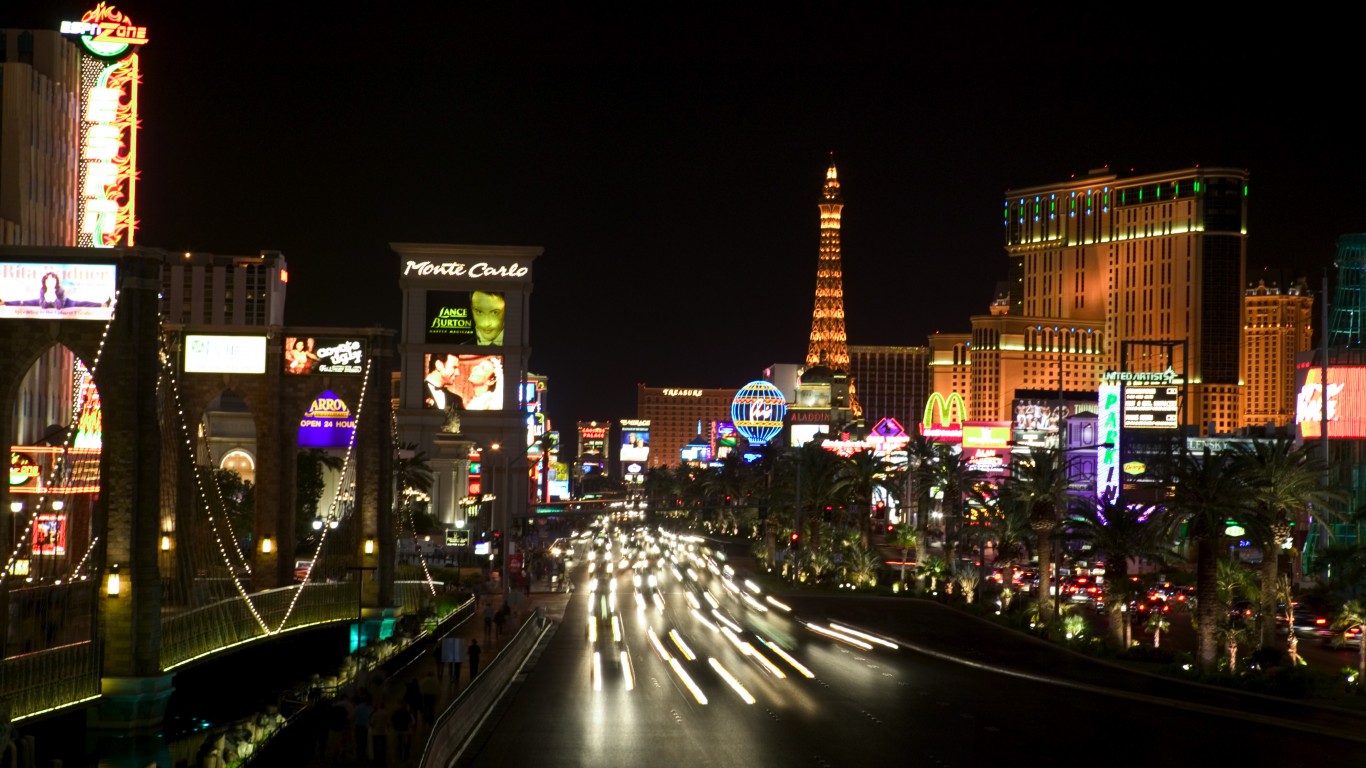
16. Las Vegas, NV
> Time lost to traffic per year: 46 hours
> Congestion level, 2021: 20%
> Avg. commute time: 26.1 minutes
> Population density: 4,526 per sq mile
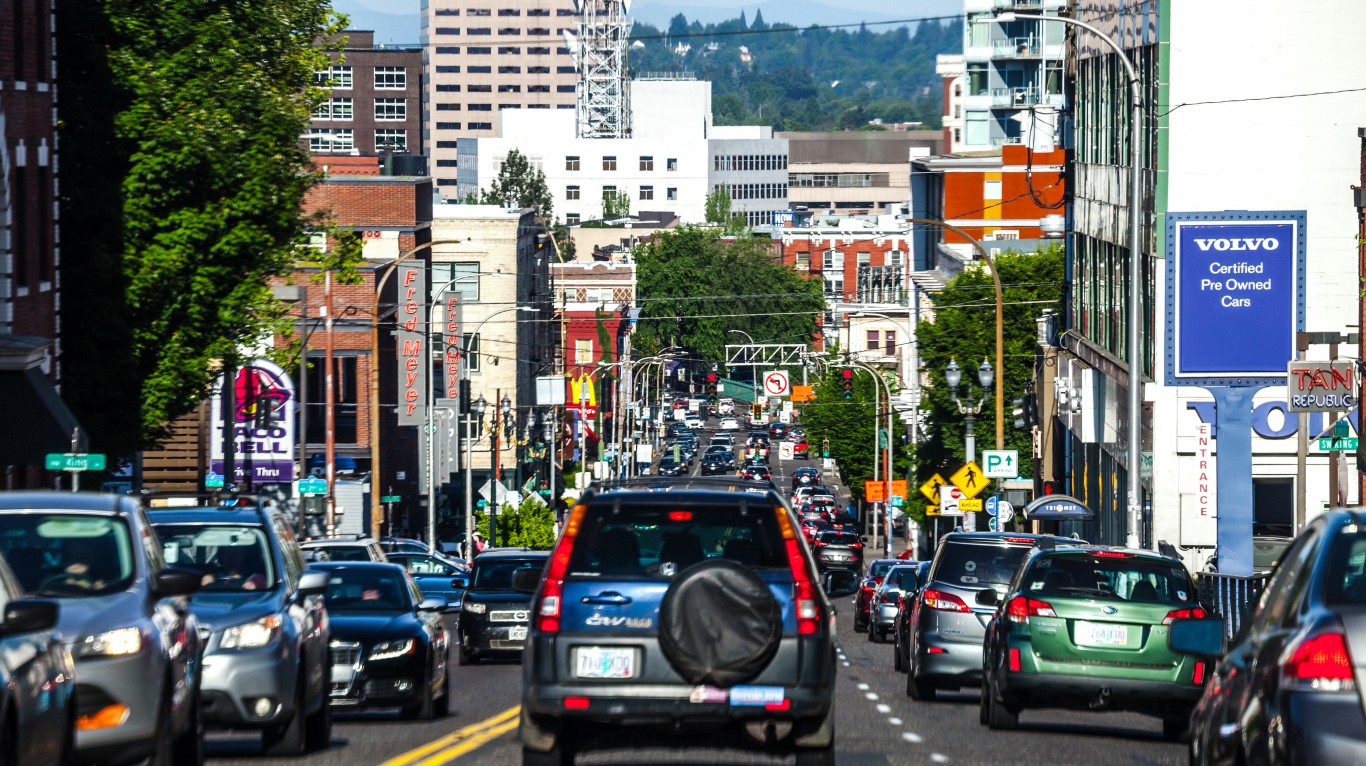
16. Portland, OR
> Time lost to traffic per year: 46 hours
> Congestion level, 2021: 20%
> Avg. commute time: 26.5 minutes
> Population density: 4,889 per sq mile
[in-text-ad]
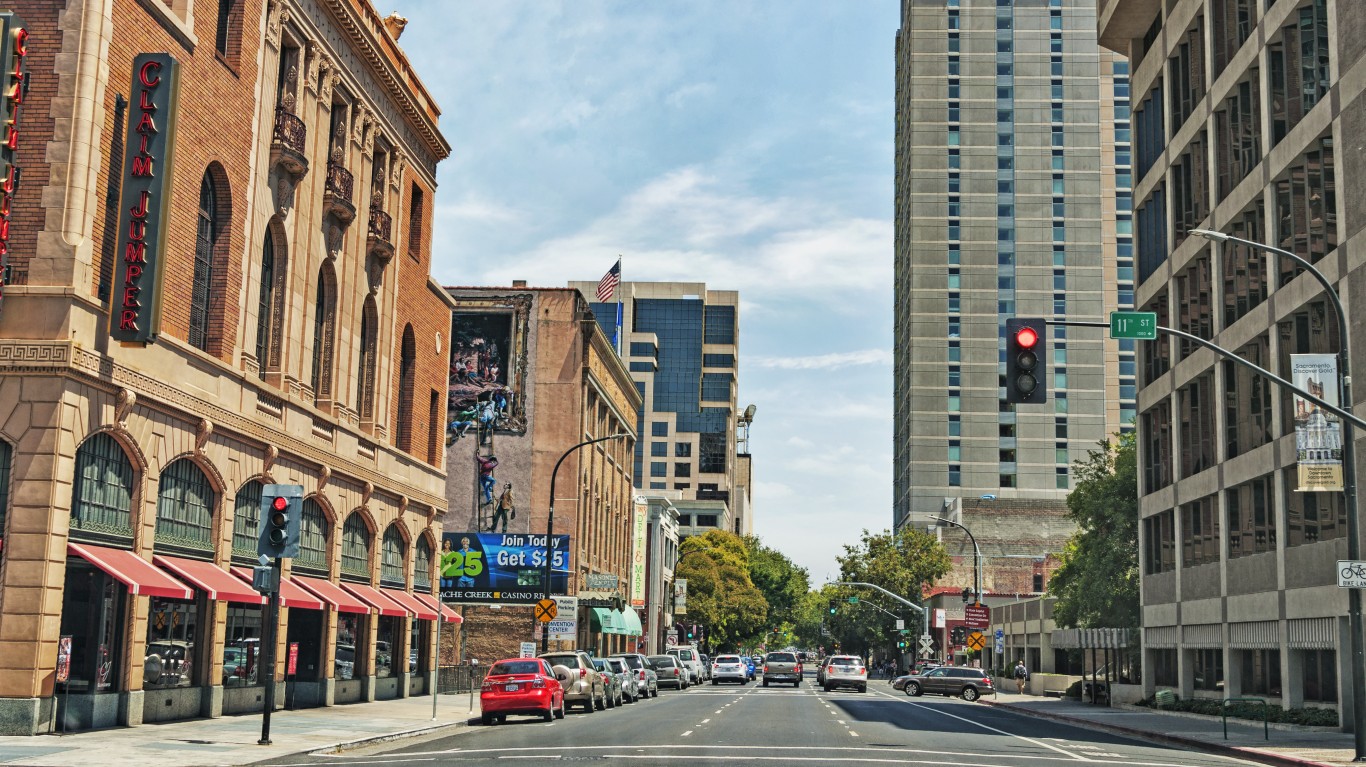
16. Sacramento, CA
> Time lost to traffic per year: 46 hours
> Congestion level, 2021: 20%
> Avg. commute time: 26.2 minutes
> Population density: 5,323 per sq mile
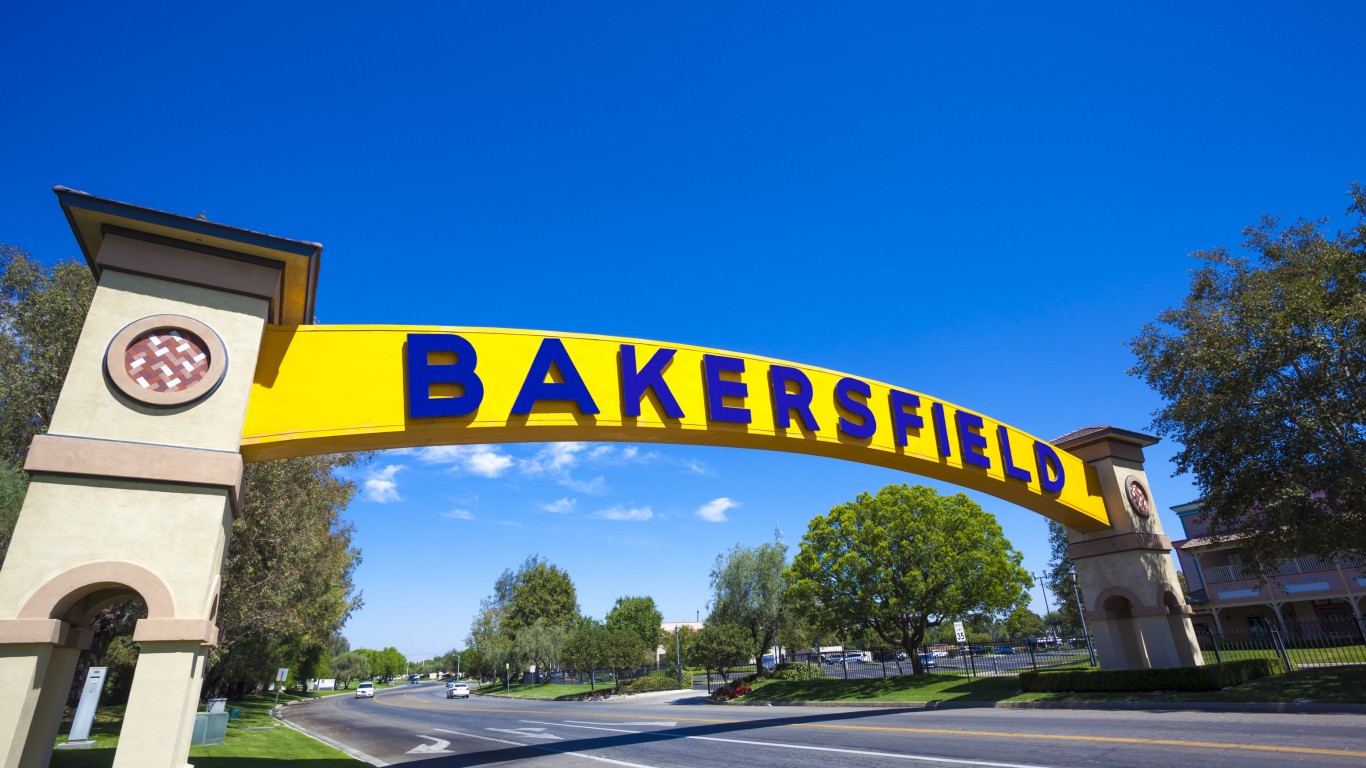
16. Bakersfield, CA
> Time lost to traffic per year: 46 hours
> Congestion level, 2021: 20%
> Avg. commute time: 23.0 minutes
> Population density: 2,693 per sq mile
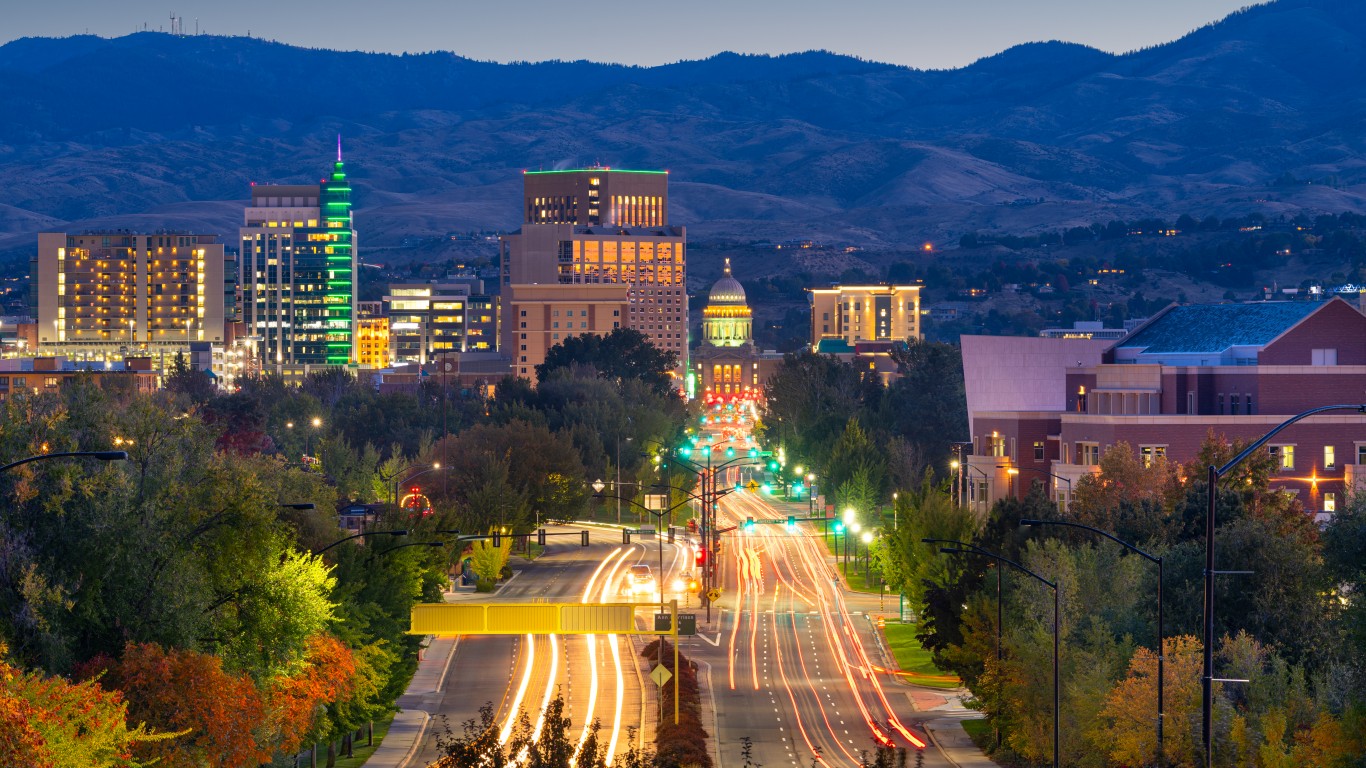
16. Boise, ID
> Time lost to traffic per year: 46 hours
> Congestion level, 2021: 20%
> Avg. commute time: 18.5 minutes
> Population density: 2,804 per sq mile
[in-text-ad-2]
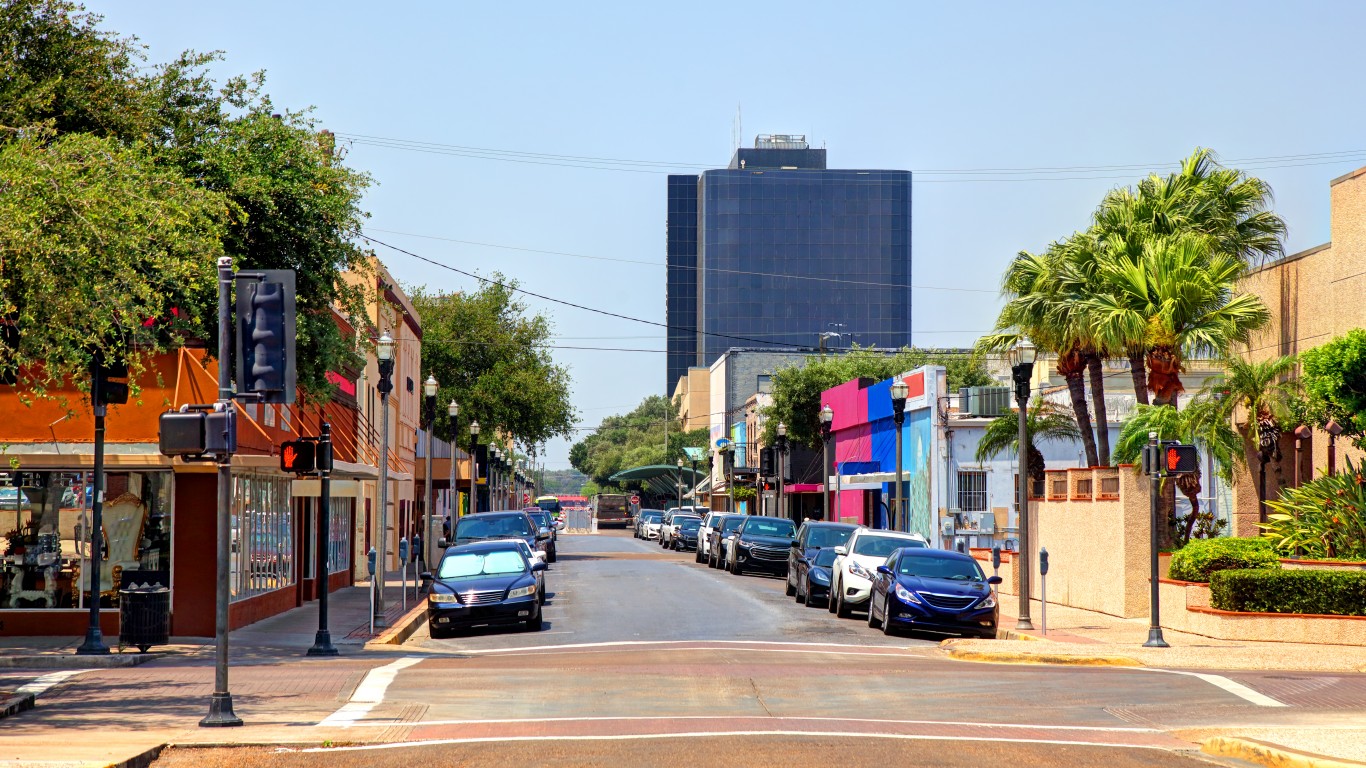
16. McAllen, TX
> Time lost to traffic per year: 46 hours
> Congestion level, 2021: 20%
> Avg. commute time: 19.5 minutes
> Population density: 2,282 per sq mile
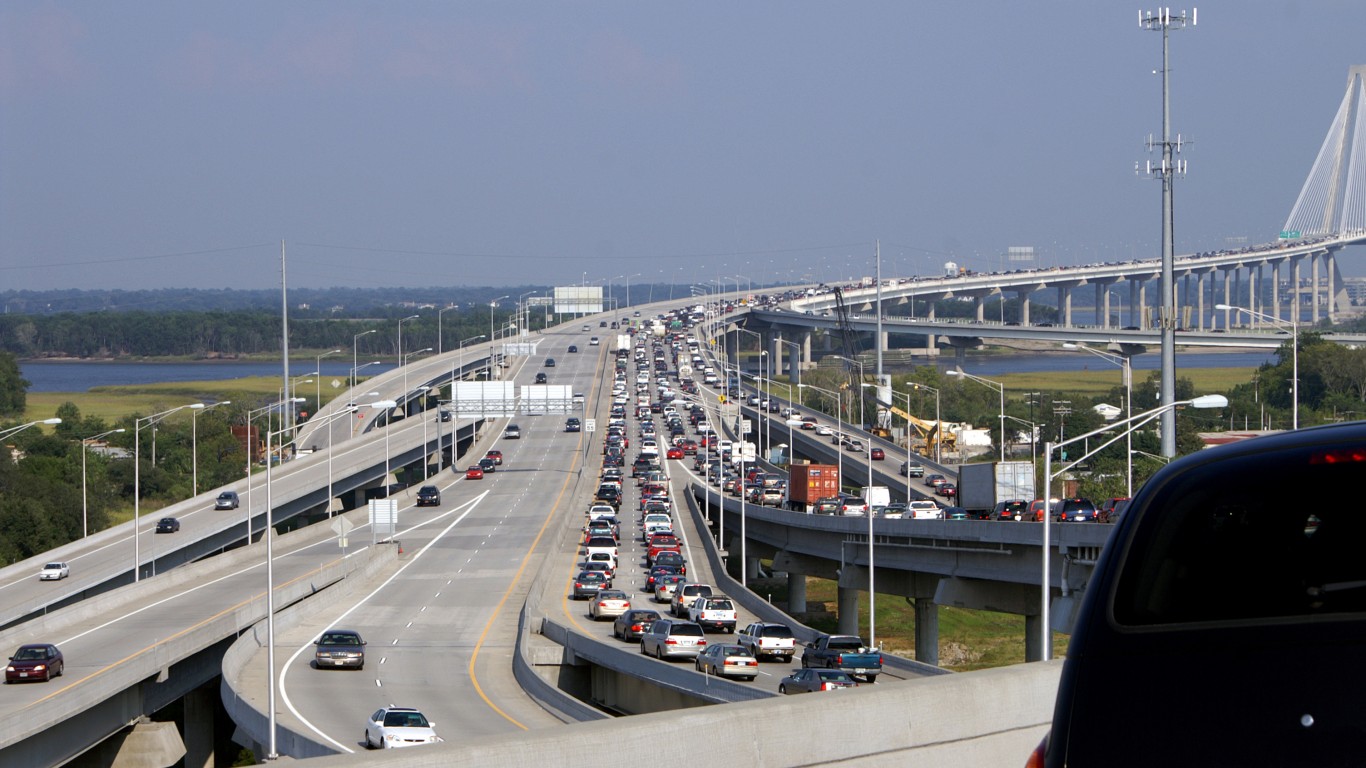
16. Charleston, SC
> Time lost to traffic per year: 46 hours
> Congestion level, 2021: 20%
> Avg. commute time: 22.8 minutes
> Population density: 1,309 per sq mile
[in-text-ad]
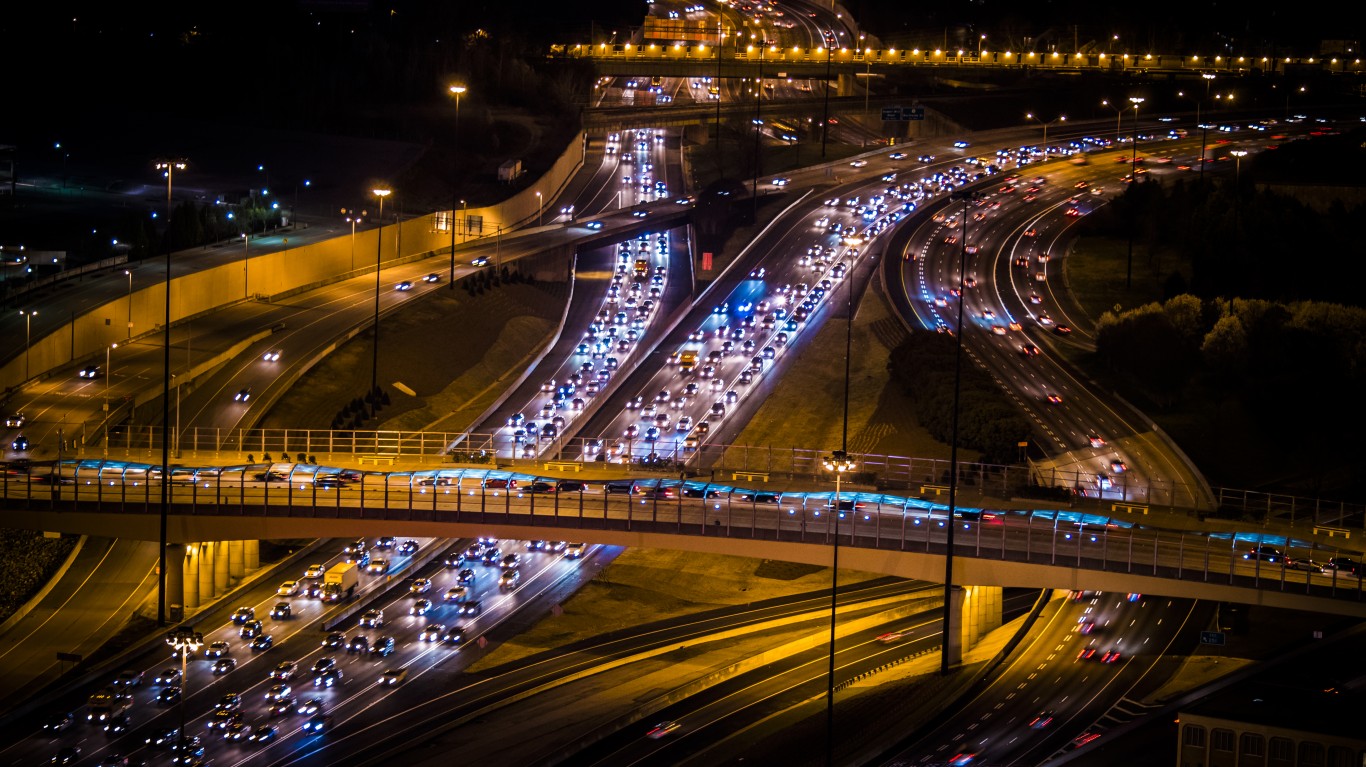
11. Atlanta, GA
> Time lost to traffic per year: 48 hours
> Congestion level, 2021: 21%
> Avg. commute time: 27.2 minutes
> Population density: 3,685 per sq mile

11. Washington, D.C.
> Time lost to traffic per year: 48 hours
> Congestion level, 2021: 21%
> Avg. commute time: 30.8 minutes
> Population density: 11,281 per sq mile
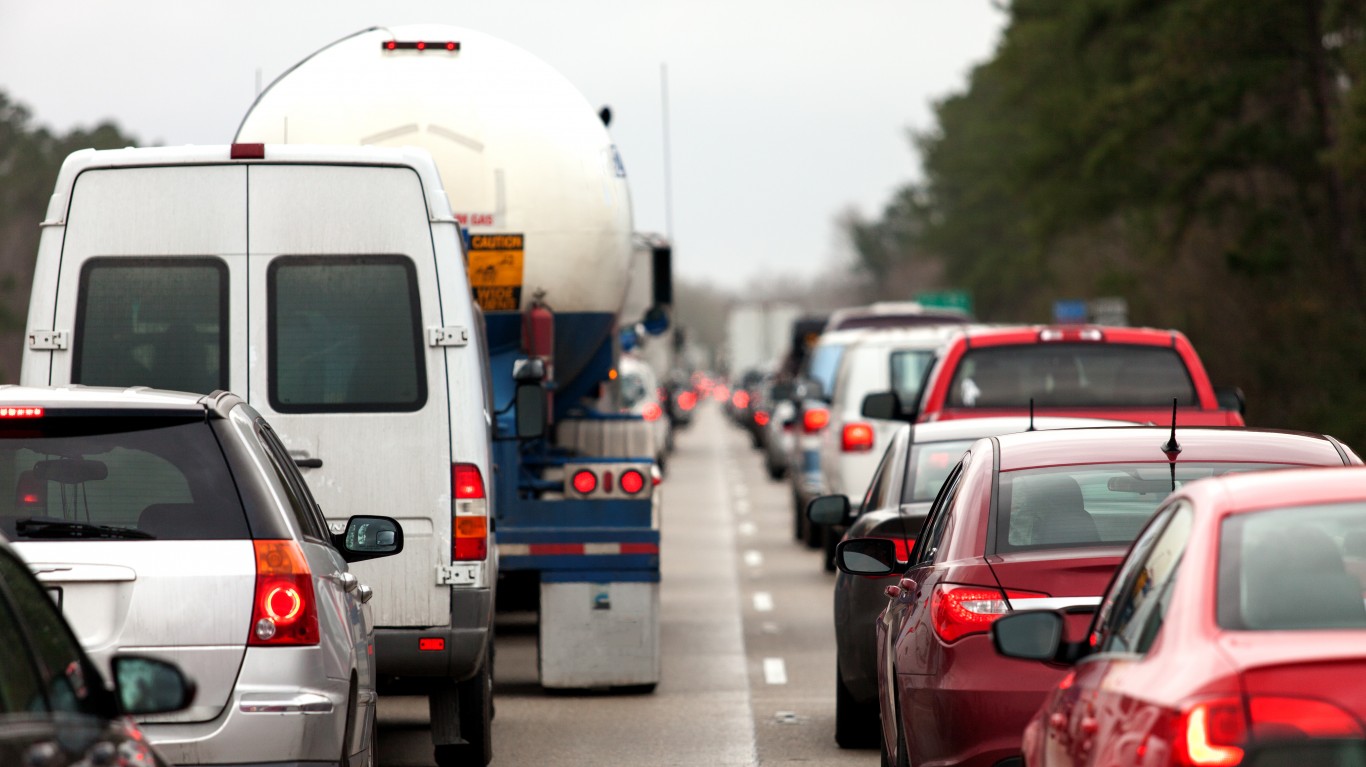
11. New Orleans, LA
> Time lost to traffic per year: 48 hours
> Congestion level, 2021: 21%
> Avg. commute time: 24.2 minutes
> Population density: 2,265 per sq mile
[in-text-ad-2]
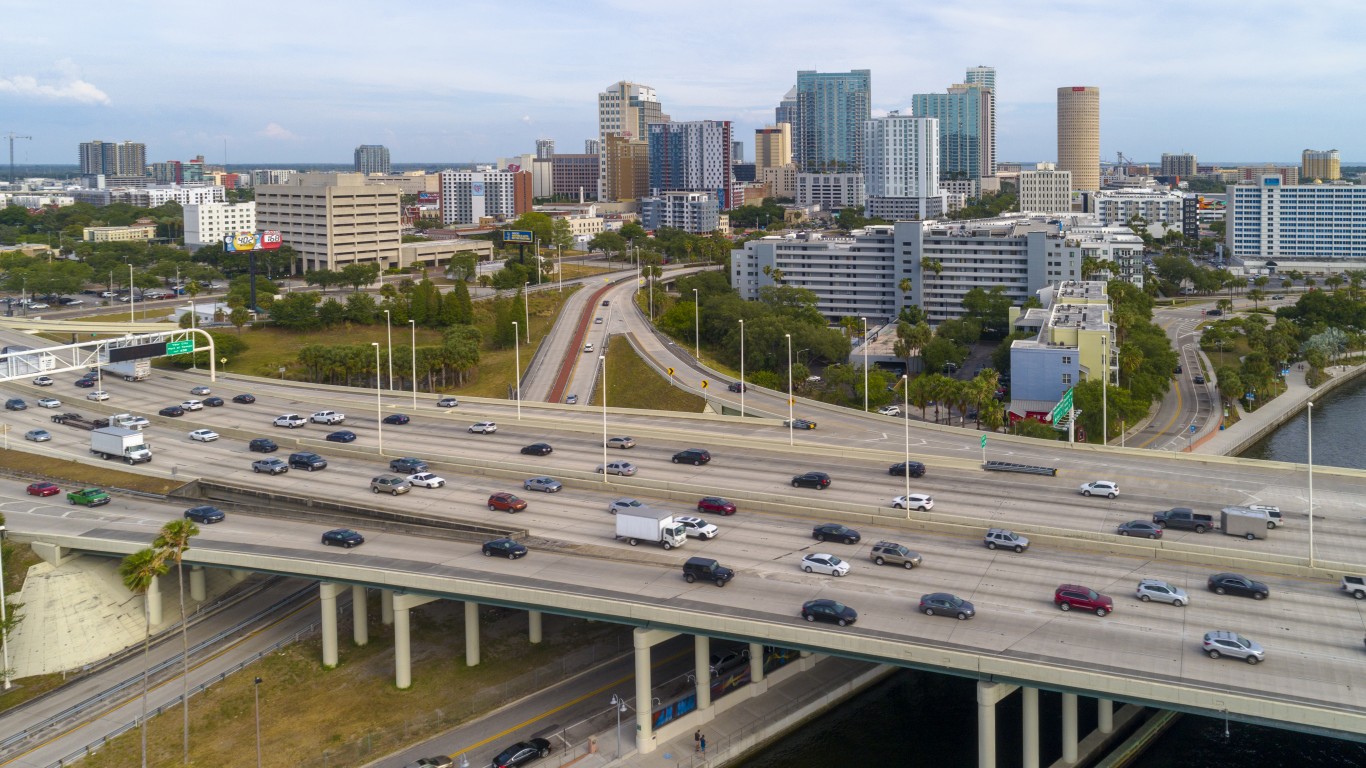
11. Tampa, FL
> Time lost to traffic per year: 48 hours
> Congestion level, 2021: 21%
> Avg. commute time: 24.6 minutes
> Population density: 3,376 per sq mile
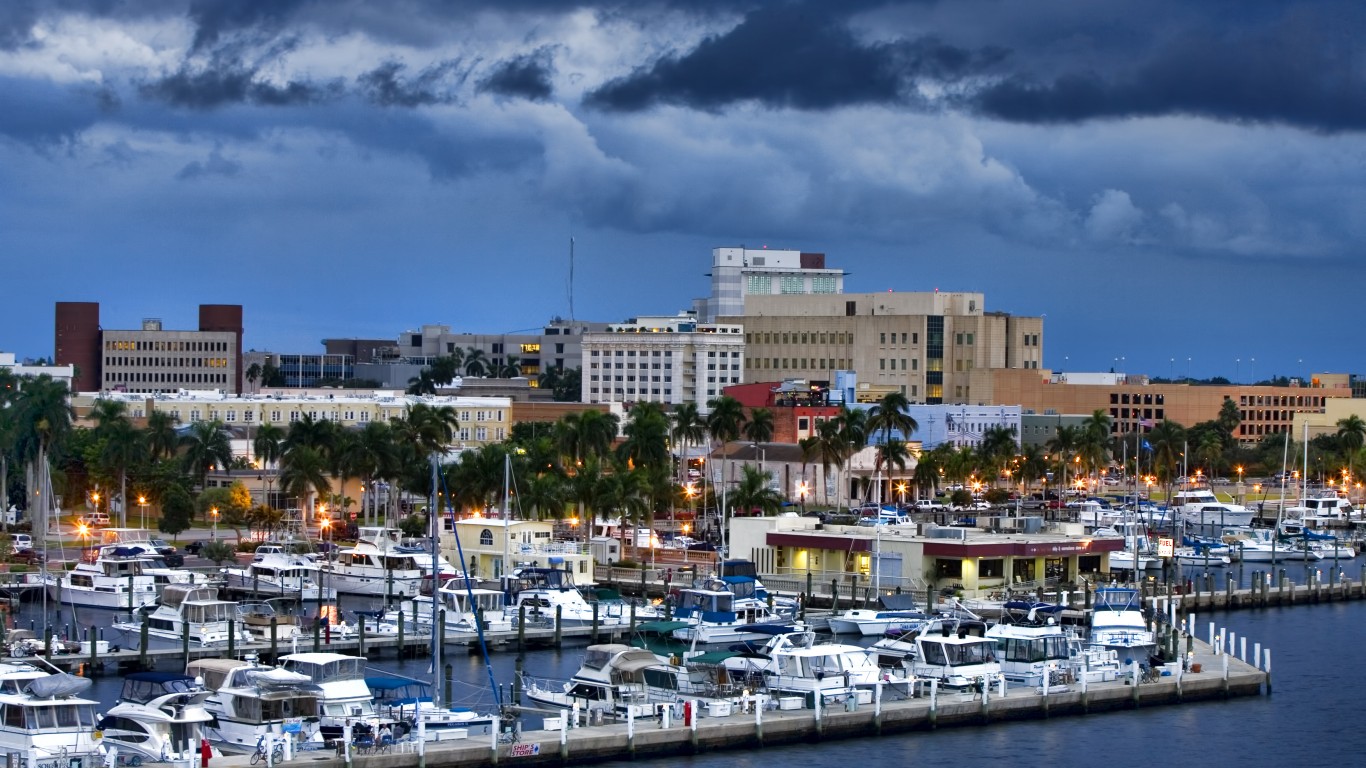
11. Cape Coral-Fort Myers, FL
> Time lost to traffic per year: 48 hours
> Congestion level, 2021: 21%
> Avg. commute time: 27.5 minutes
> Population density: 974 per sq mile
[in-text-ad]
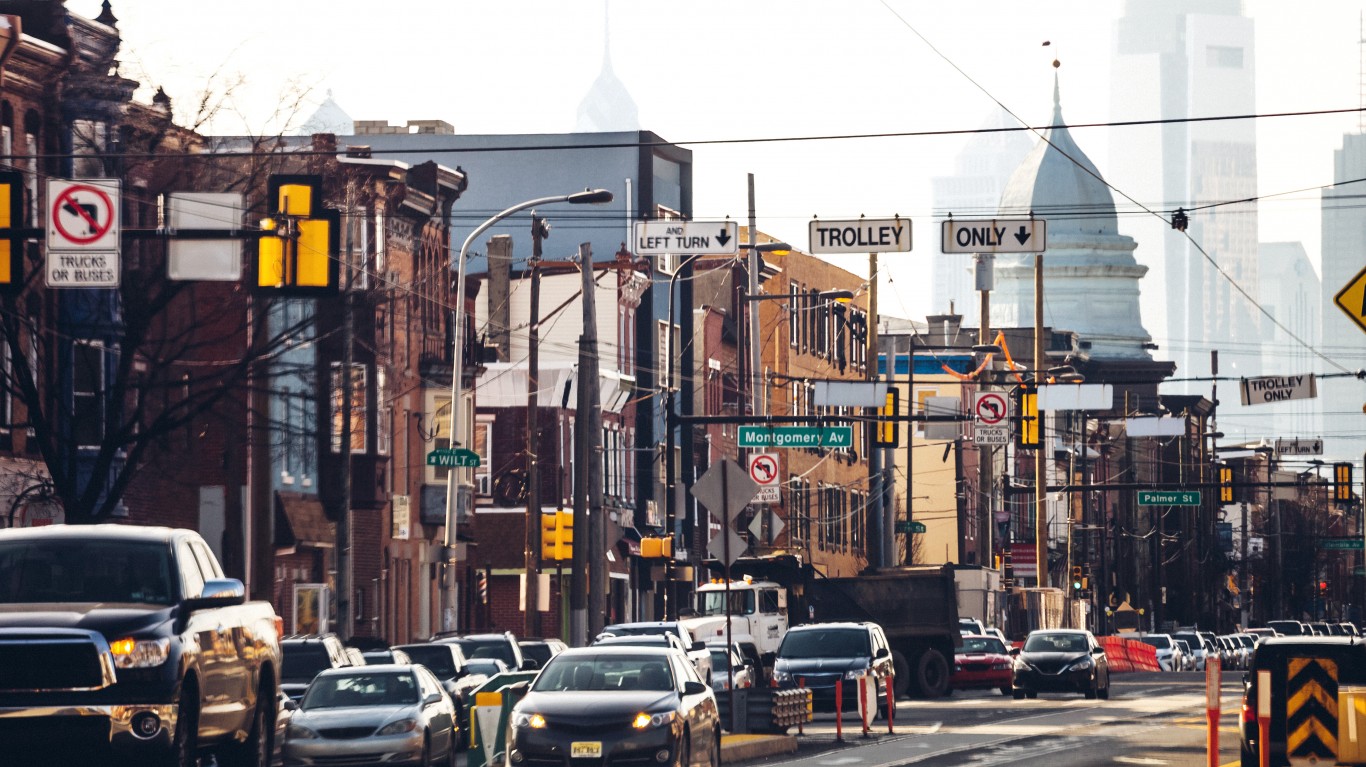
10. Philadelphia, PA
> Time lost to traffic per year: 50 hours
> Congestion level, 2021: 22%
> Avg. commute time: 33.6 minutes
> Population density: 11,937 per sq mile
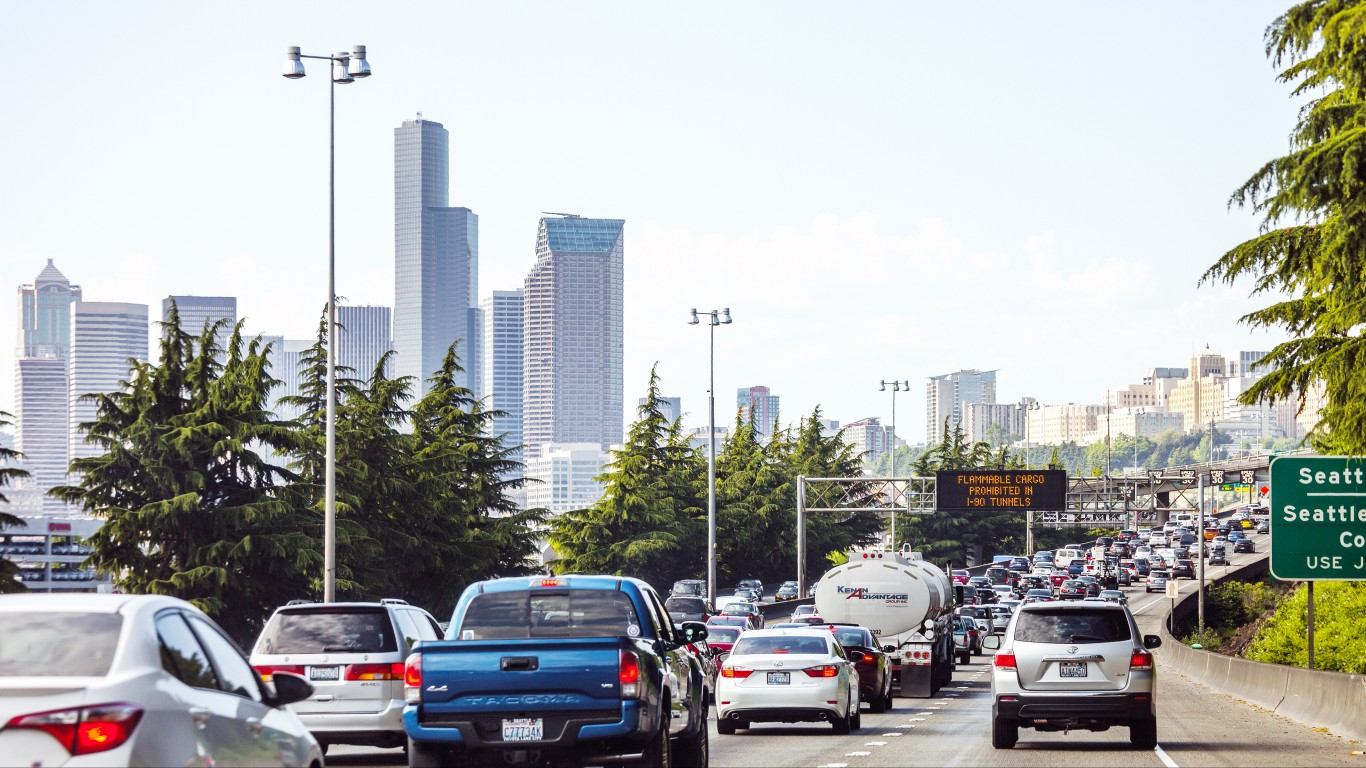
7. Seattle, WA
> Time lost to traffic per year: 52 hours
> Congestion level, 2021: 23%
> Avg. commute time: 27.9 minutes
> Population density: 8,787 per sq mile
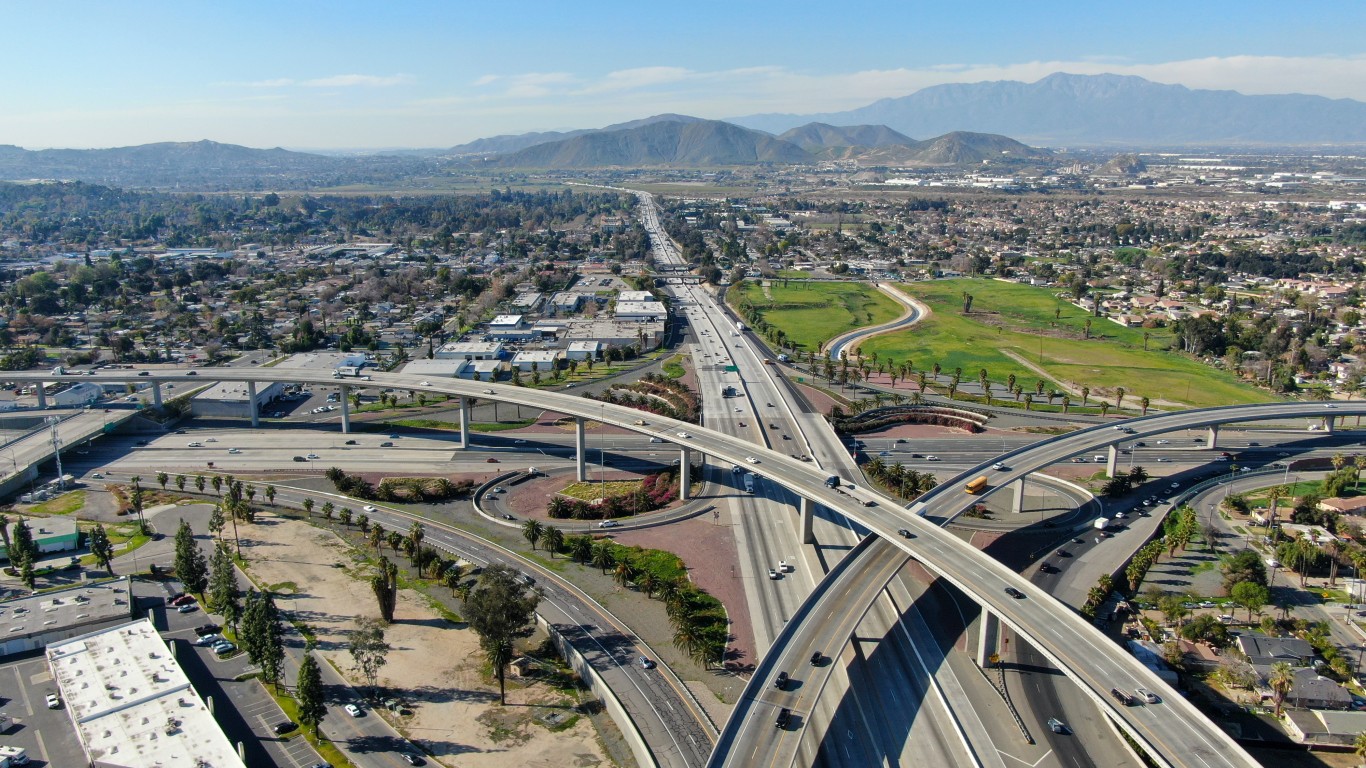
7. Riverside, CA
> Time lost to traffic per year: 52 hours
> Congestion level, 2021: 23%
> Avg. commute time: 31.4 minutes
> Population density: 3,878 per sq mile
[in-text-ad-2]
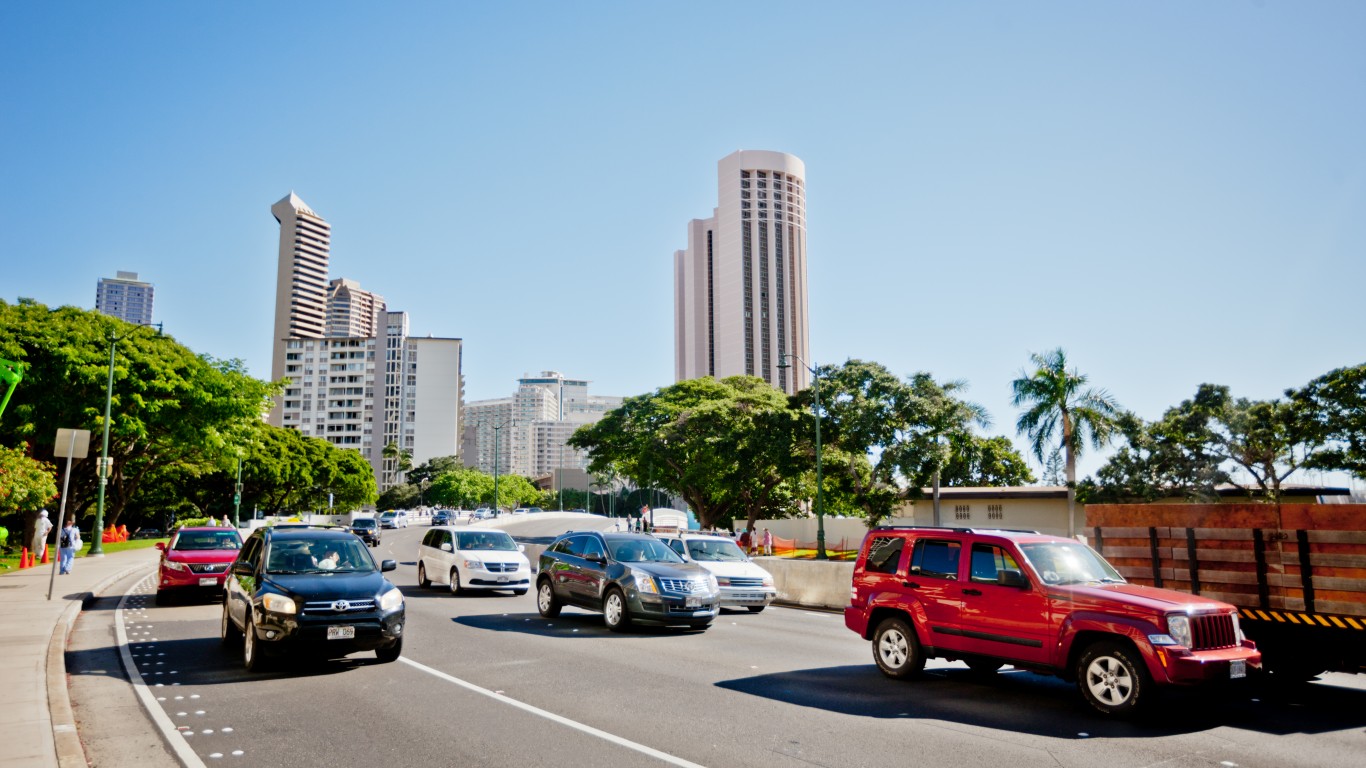
7. Honolulu, HI
> Time lost to traffic per year: 52 hours
> Congestion level, 2021: 23%
> Avg. commute time: 29.1 minutes
> Population density: 1,692 per sq mile
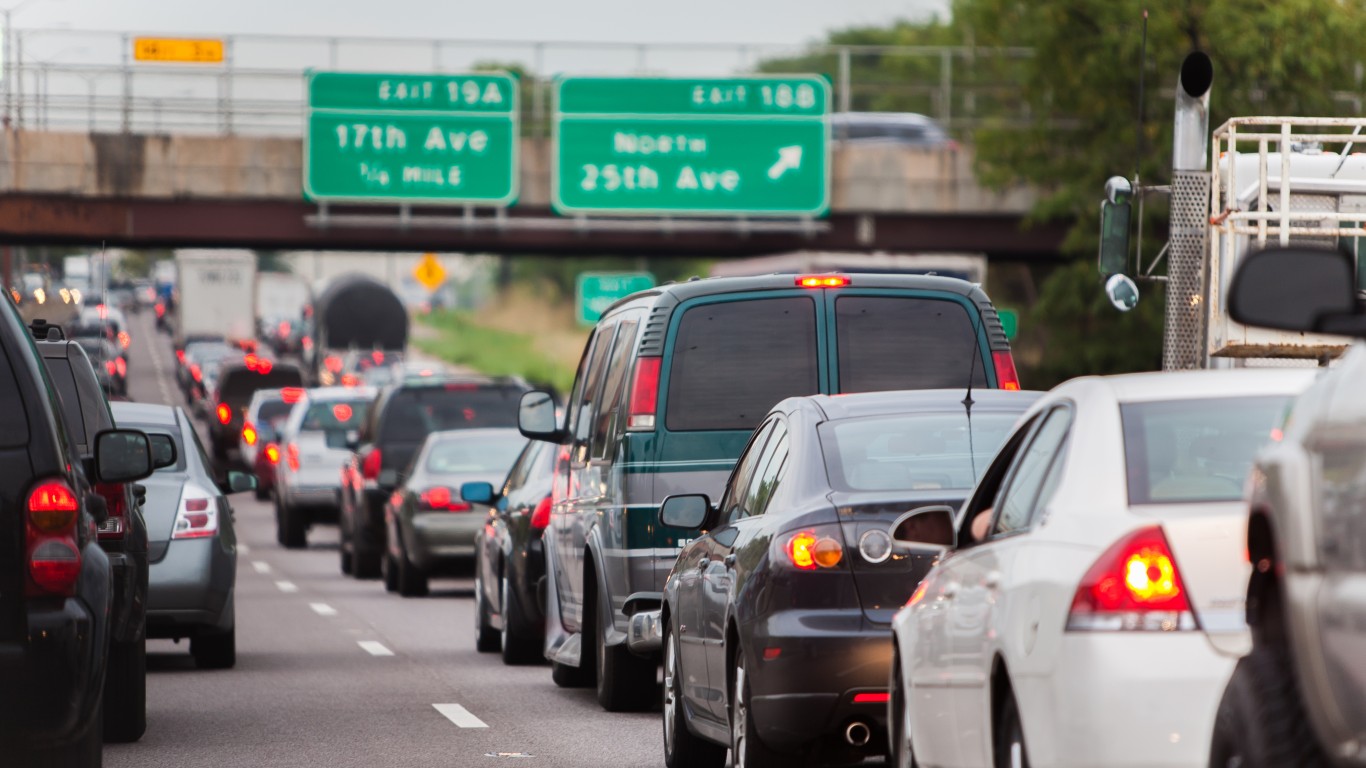
6. Chicago, IL
> Time lost to traffic per year: 55 hours
> Congestion level, 2021: 24%
> Avg. commute time: 35.1 minutes
> Population density: 12,060 per sq mile
[in-text-ad]

5. San Francisco, CA
> Time lost to traffic per year: 59 hours
> Congestion level, 2021: 26%
> Avg. commute time: 33.8 minutes
> Population density: 18,629 per sq mile

4. Baton Rouge, LA
> Time lost to traffic per year: 62 hours
> Congestion level, 2021: 27%
> Avg. commute time: 21.3 minutes
> Population density: 2,635 per sq mile
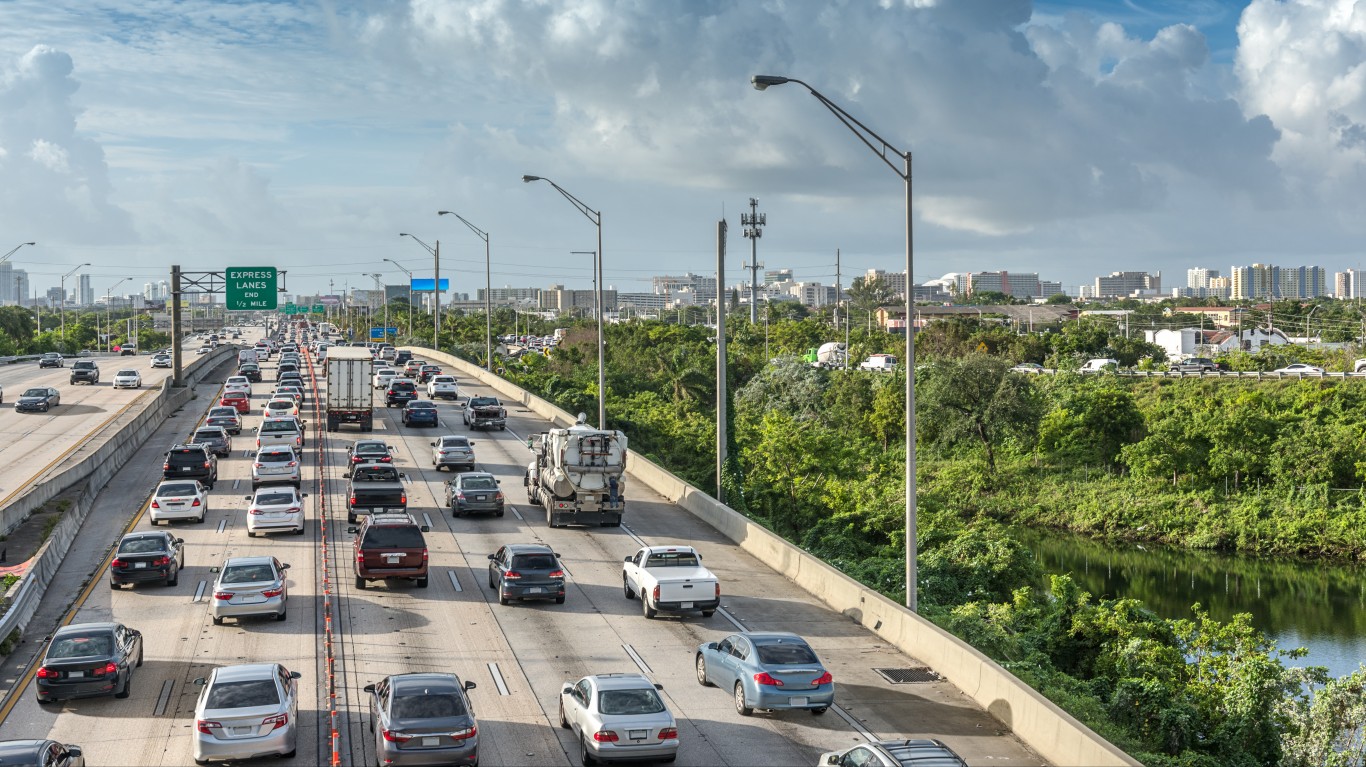
3. Miami, FL
> Time lost to traffic per year: 64 hours
> Congestion level, 2021: 28%
> Avg. commute time: 29.3 minutes
> Population density: 12,286 per sq mile
[in-text-ad-2]
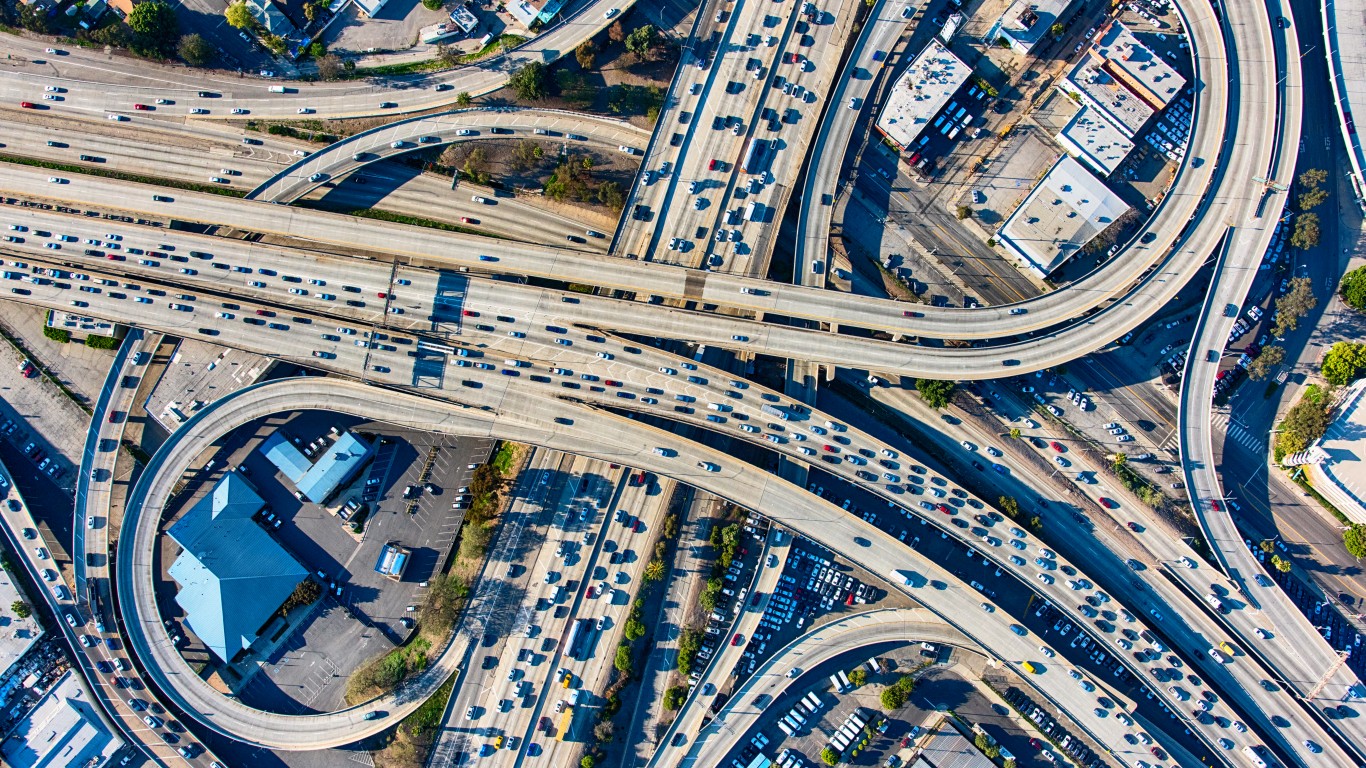
2. Los Angeles, CA
> Time lost to traffic per year: 75 hours
> Congestion level, 2021: 33%
> Avg. commute time: 32.0 minutes
> Population density: 8,304 per sq mile
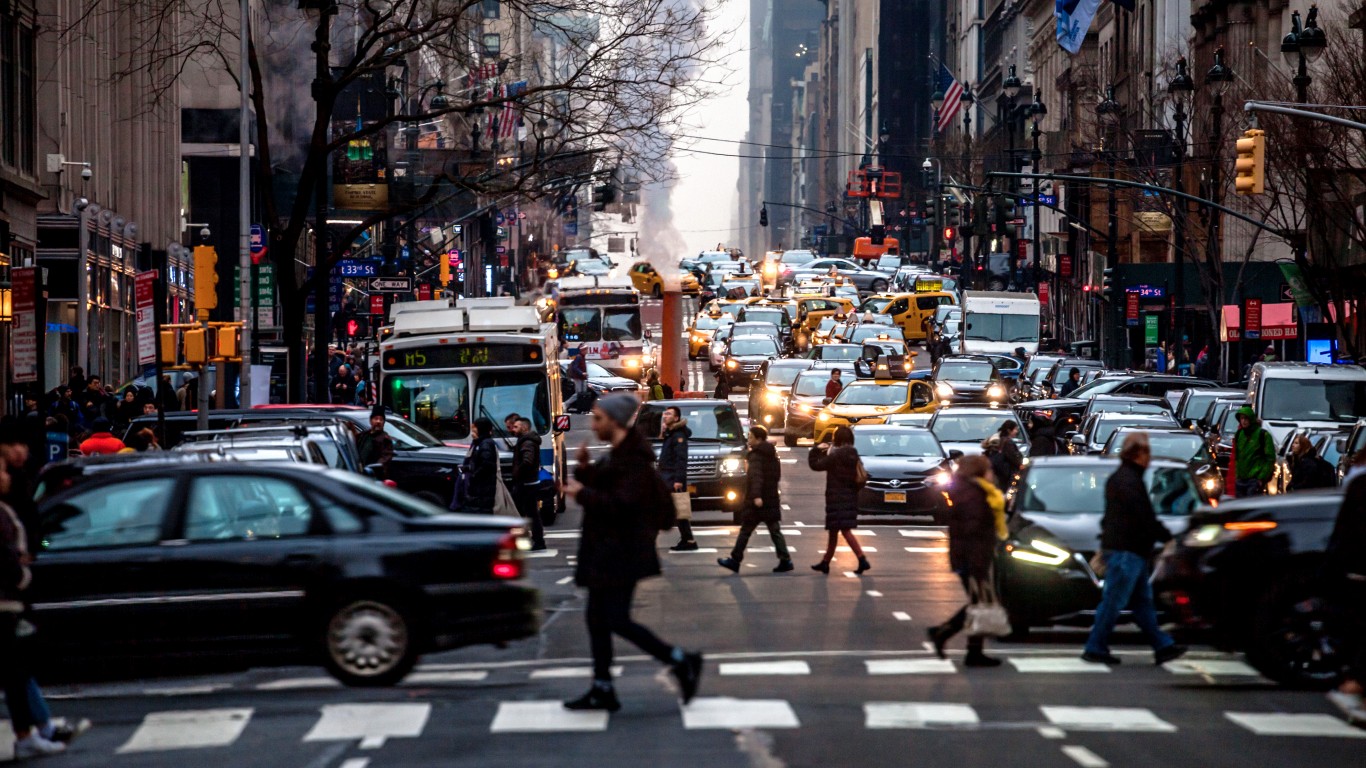
1. New York, NY
> Time lost to traffic per year: 80 hours
> Congestion level, 2021: 35%
> Avg. commute time: 41.5 minutes
> Population density: 29,303 per sq mile
Is Your Money Earning the Best Possible Rate? (Sponsor)
Let’s face it: If your money is just sitting in a checking account, you’re losing value every single day. With most checking accounts offering little to no interest, the cash you worked so hard to save is gradually being eroded by inflation.
However, by moving that money into a high-yield savings account, you can put your cash to work, growing steadily with little to no effort on your part. In just a few clicks, you can set up a high-yield savings account and start earning interest immediately.
There are plenty of reputable banks and online platforms that offer competitive rates, and many of them come with zero fees and no minimum balance requirements. Click here to see if you’re earning the best possible rate on your money!
Thank you for reading! Have some feedback for us?
Contact the 24/7 Wall St. editorial team.
 24/7 Wall St.