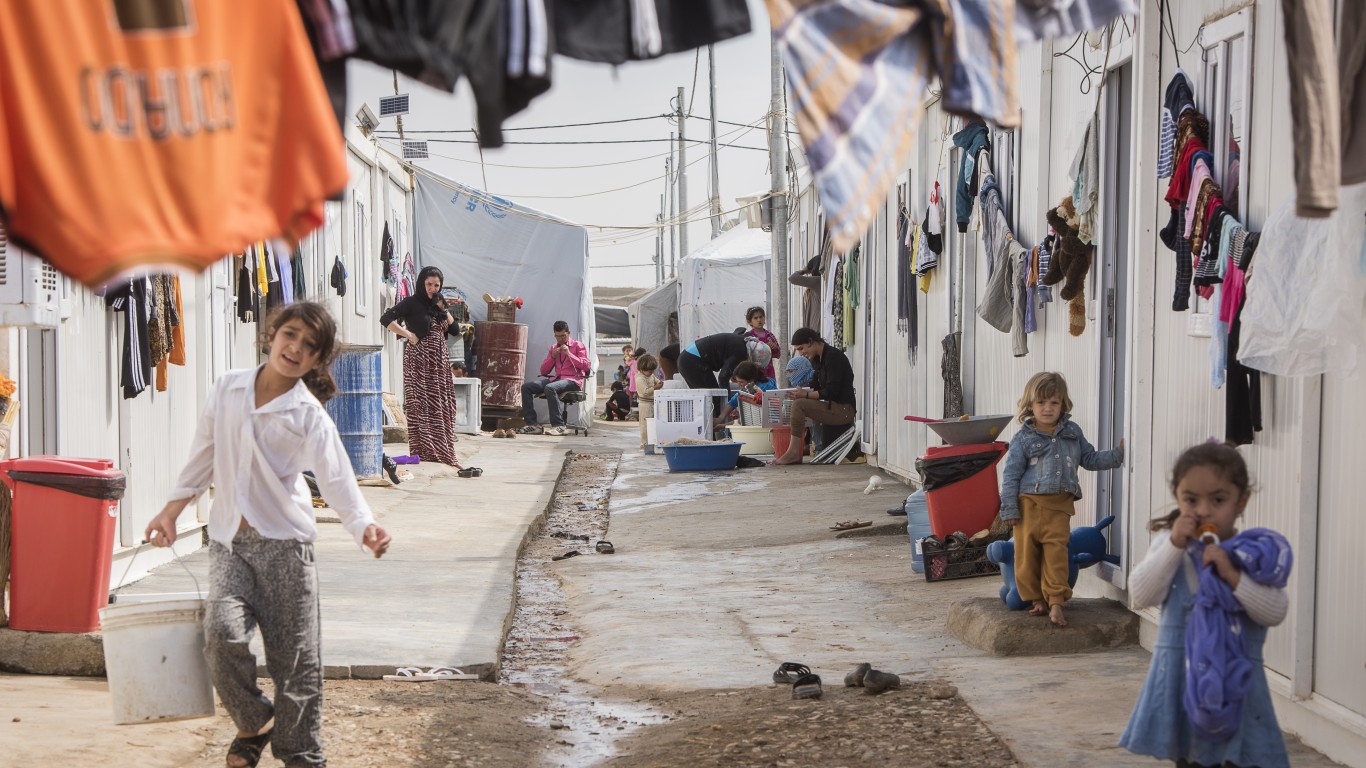
With Russia invading Ukraine, some U.S. lawmakers have called on President Joe Biden to issue short-term visas to Ukrainians fleeing the violence. An estimated 1 million Ukrainians have already fled the country, according to the United Nations.
If the U.S. indeed accepts Ukrainian refugees and immigrants, where should they resettle? Often, many immigrants choose to resettle where an already large community of immigrants from the same background lives. Others might consider other factors. And some major U.S. metro areas stand out as especially good places for foreign-born residents to begin a new life in the U.S.
To determine the 25 best cities for immigrants, 24/7 Wall St. developed an index based on various socioeconomic disparities among the native and foreign-born populations in all U.S. metropolitan statistical areas using five-year data from the Census Bureau’s 2019 American Community Survey.
Most of the best cities for immigrants have a relatively high share of residents that were born outside of the country. Nationally, 13.6% of U.S. residents were born outside of the country, yet in most of the cities, the share of the population that is foreign-born is over 18%.
A majority of the best cities for immigrants are located in coastal states. California and Florida each have five major metro areas among the 25 best cities for immigrants, and New York, Connecticut, and Hawaii have two apiece.
Though the numbers fluctuate by the year, around 1 million immigrants have gained legal resident status each year over the last few decades. Additionally, tens of thousands more refugees arrive in the U.S. annually, with many receiving refugee status. This is the number of legal immigrants coming to the U.S. each year since 1990.
Click here to see the best cities for immigrants
Click here to read our detailed methodology
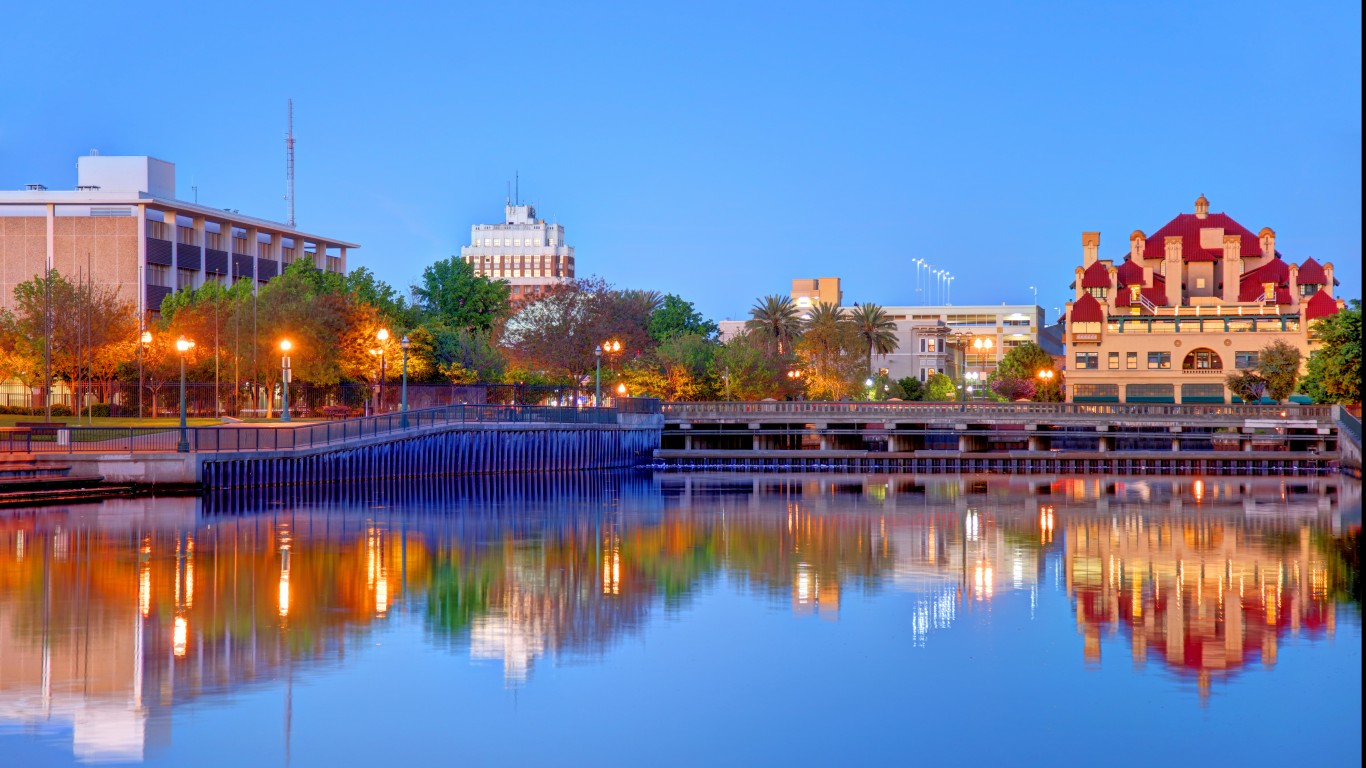
25. Stockton, CA
> Foreign-born population: 23.3%
> Median income of foreign-born households: $58,305 (86.4% of native-born)
> Foreign-born unemployment rate: 7.0% (1.1 ppts less than native-born)
> Foreign-born population who are naturalized U.S. citizens: 49.6%
> Total population: 742,603
Stockton in Central California ranks as one of the best cities for immigrants, one of five California cities among the top 25. Of the nearly 750,000 Stockton residents, 23.3% are foreign-born, compared to 13.6% of all Americans.
Nationwide, the poverty rate for foreign-born residents is 15.4%, which is 2.3 percentage points higher than the native-born poverty rate. In Stockton, 14.8% of foreign-born residents live below the poverty line. The city’s native-born population has a 14.4% poverty rate. Stockton is one of just two of the best cities for immigrants in which the foreign-born population declined from 2015 to 2019, though the decline was very small.
[in-text-ad]
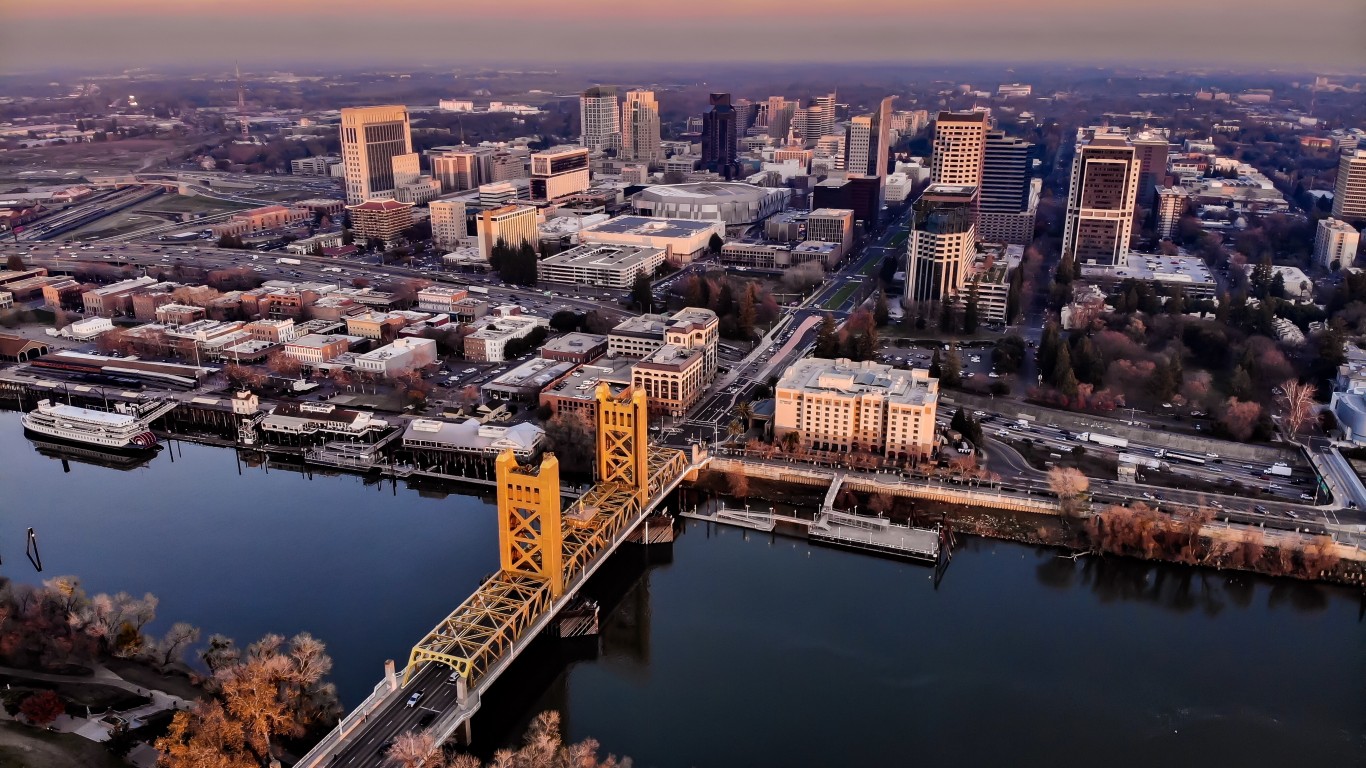
24. Sacramento-Roseville-Folsom, CA
> Foreign-born population: 18.6%
> Median income of foreign-born households: $59,883 (79.5% of native-born)
> Foreign-born unemployment rate: 5.1% (1.2 ppts less than native-born)
> Foreign-born population who are naturalized U.S. citizens: 57.0%
> Total population: 2,315,980
In California’s capital of Sacramento, 18.6% of the 2.3 million residents were born outside of the U.S. – 5 percentage points higher than the U.S. share of the population that is foreign-born. An estimated 57.0% of foreign-born residents are naturalized citizens, above the national rate of 49.6%.
The foreign-born population in the area has increased by 0.6% from 2015 to 2019, slightly above the 0.4% increase in the immigrant population nationwide during that time. The median income of nearly $60,000 of foreign-born Sacramento household is slightly higher than the median income of foreign-born households nationwide
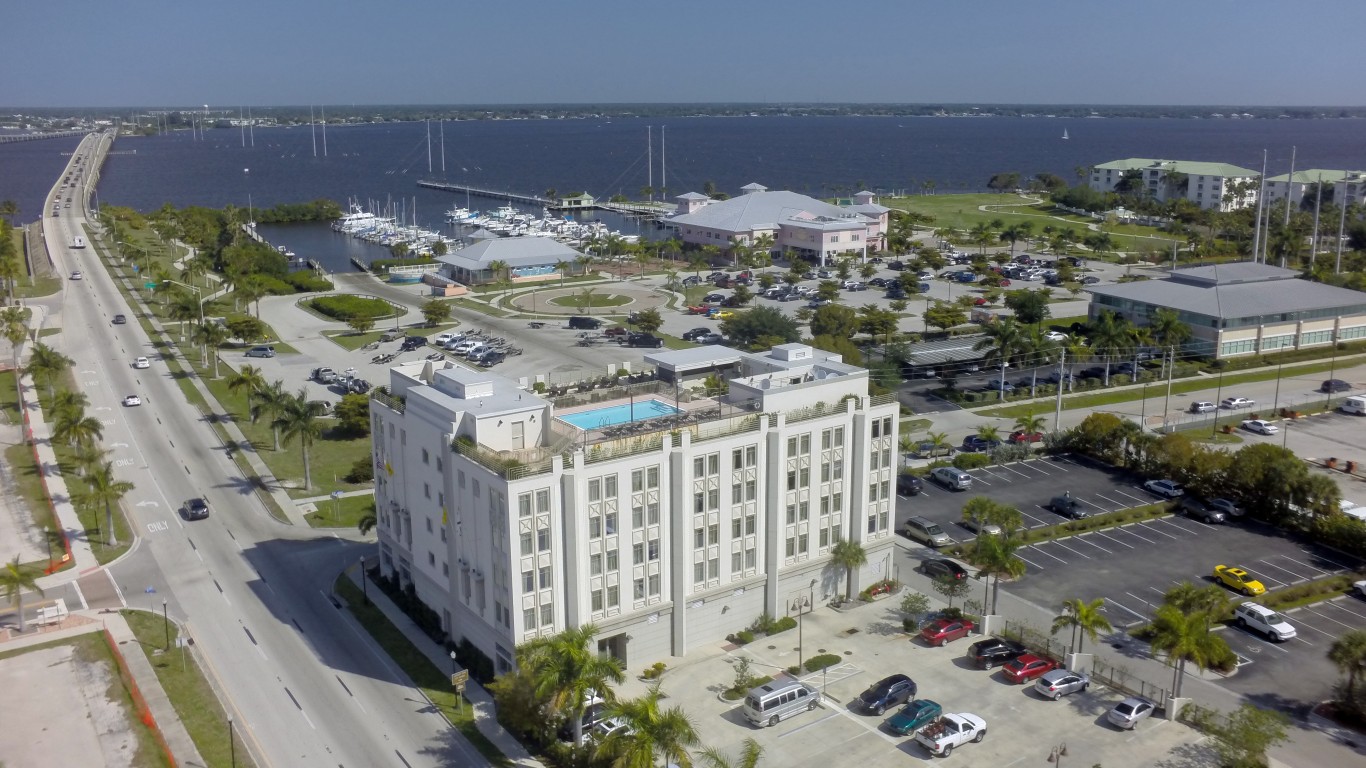
23. Punta Gorda, FL
> Foreign-born population: 10.9%
> Median income of foreign-born households: $37,651 (70.7% of native-born)
> Foreign-born unemployment rate: 4.6% (1.4 ppts less than native-born)
> Foreign-born population who are naturalized U.S. citizens: 60.6%
> Total population: 181,067
When foreign-born residents become naturalized citizens, they gain a number of benefits, including the ability to vote. Across the country, slightly less than half of foreign-born residents, 49.6%, are naturalized citizens. Yet in the Punta Gorda area, more than 60% of foreign-born residents are.
Homeownership is one of the best ways to build wealth, and the homeownership rate among Punta Gorda area foreign-born residents is 78.0%. This is the third-highest rate among all major metro areas and well above the national foreign-born homeownership rate of 52.5%.
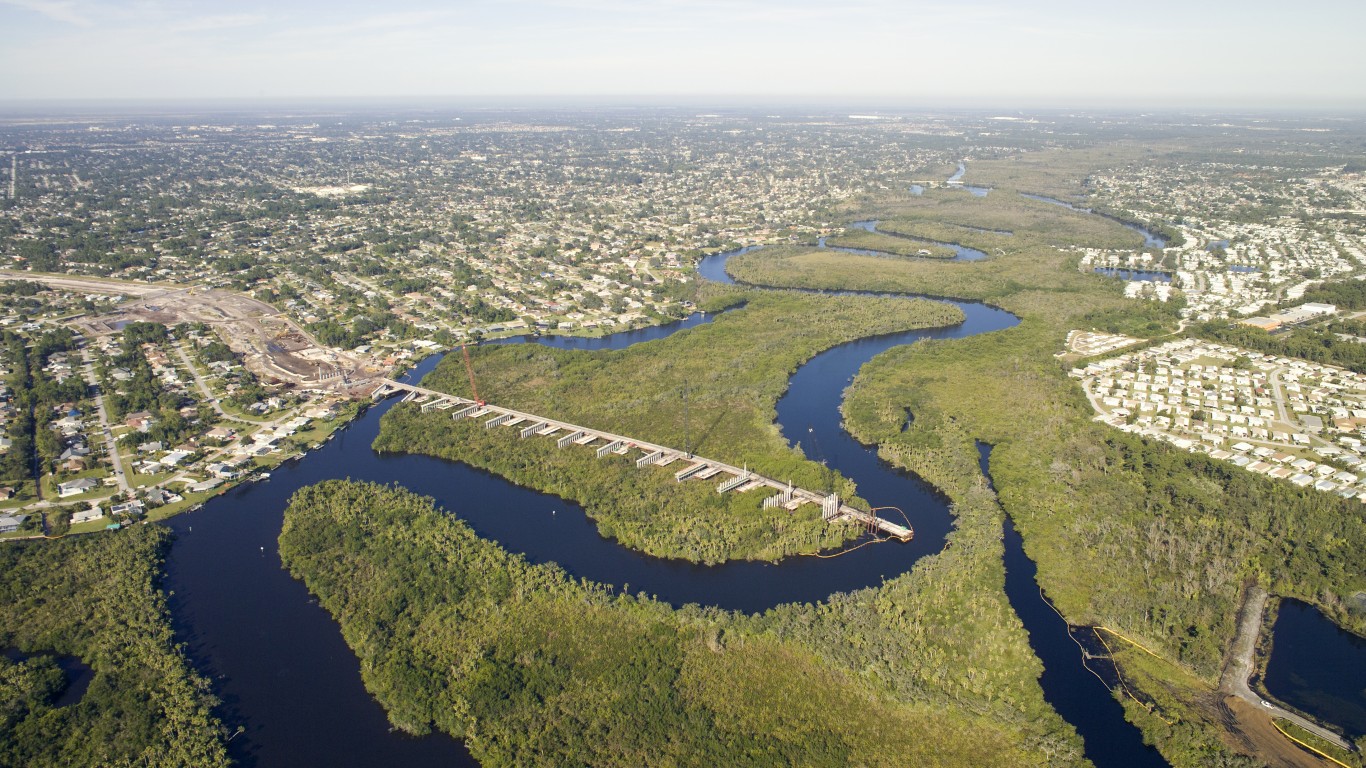
22. Port St. Lucie, FL
> Foreign-born population: 14.5%
> Median income of foreign-born households: $49,597 (88.1% of native-born)
> Foreign-born unemployment rate: 5.4% (0.1 ppts more than native-born)
> Foreign-born population who are naturalized U.S. citizens: 56.8%
> Total population: 472,012
Port St. Lucie, Florida, has one of the fastest-growing populations of immigrants anywhere in the U.S. The total number of foreign-born residents increased by 1.0% from 2015 to 2019, more than double the national growth rate of the immigrant population.
Across the country, 15.4% of immigrants live below the poverty line compared to 13.1% of native-born Americans. In Port St. Lucie, the foreign-born poverty rate is 13.7%. Not only is this relatively low, but it is also relatively close to the native-born poverty rate of 11.9%.
[in-text-ad-2]
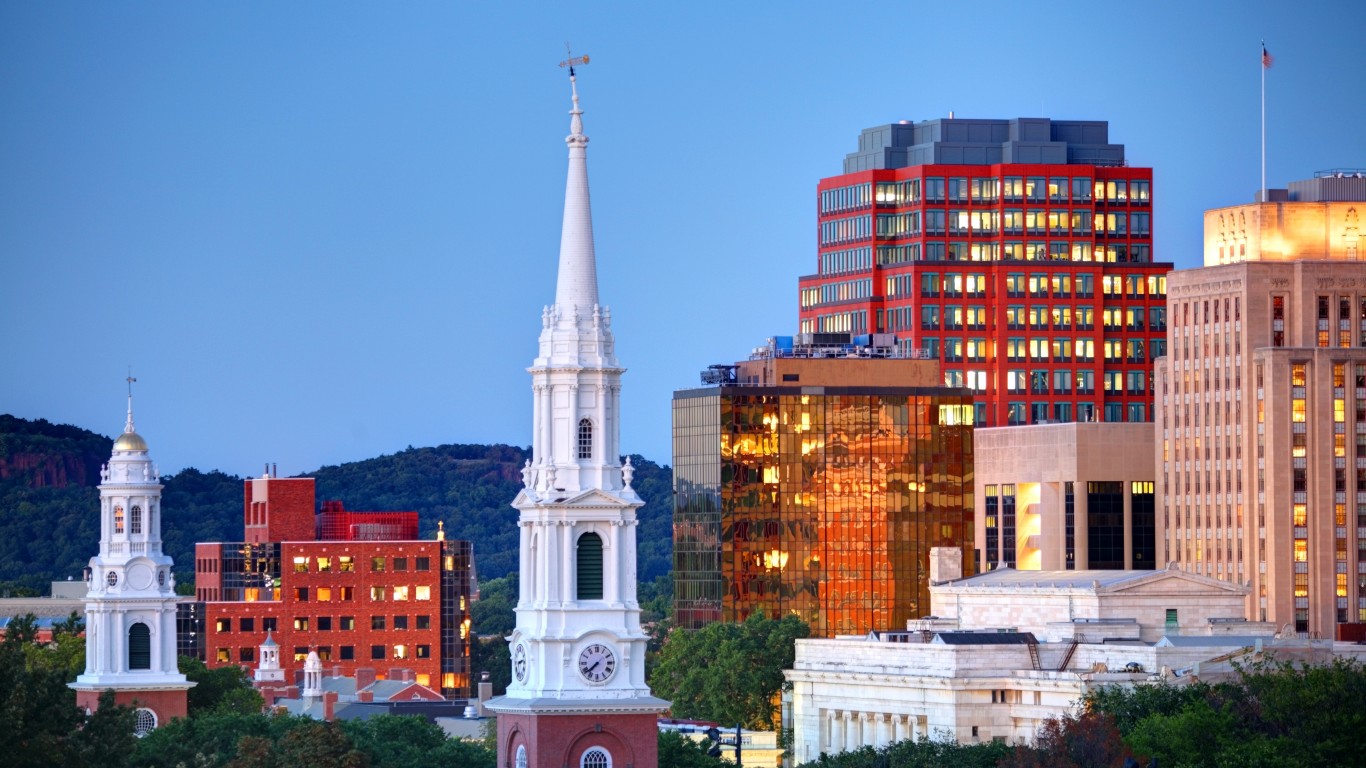
21. New Haven-Milford, CT
> Foreign-born population: 12.7%
> Median income of foreign-born households: $60,292 (84.3% of native-born)
> Foreign-born unemployment rate: 6.6% (0.2 ppts more than native-born)
> Foreign-born population who are naturalized U.S. citizens: 52.1%
> Total population: 857,513
Though the New Haven-Milford, Connecticut, metro area ranks as one of the best cities for immigrants, it has a relatively low foreign-born population. Just 12.7% of area residents were born abroad compared to 13.6% of all U.S. residents.
Education can be an important aspect of life in helping foreign-born residents attain financial stability, and New Haven area immigrants have among the best educational attainment rates in the country. Nationwide, 72.4% of foreign-born residents 25 and older hold at least a high school diploma, but in New Haven, that share is 81.0%. Also, 35.6% of foreign-born residents hold at least a bachelor’s degree, a higher share than the native-born residents’ bachelor’s degree attainment rate of 34.9%. Across the country, 32.3% of native-born and 31.3% of foreign-born residents of that age have at least a bachelor’s degree.
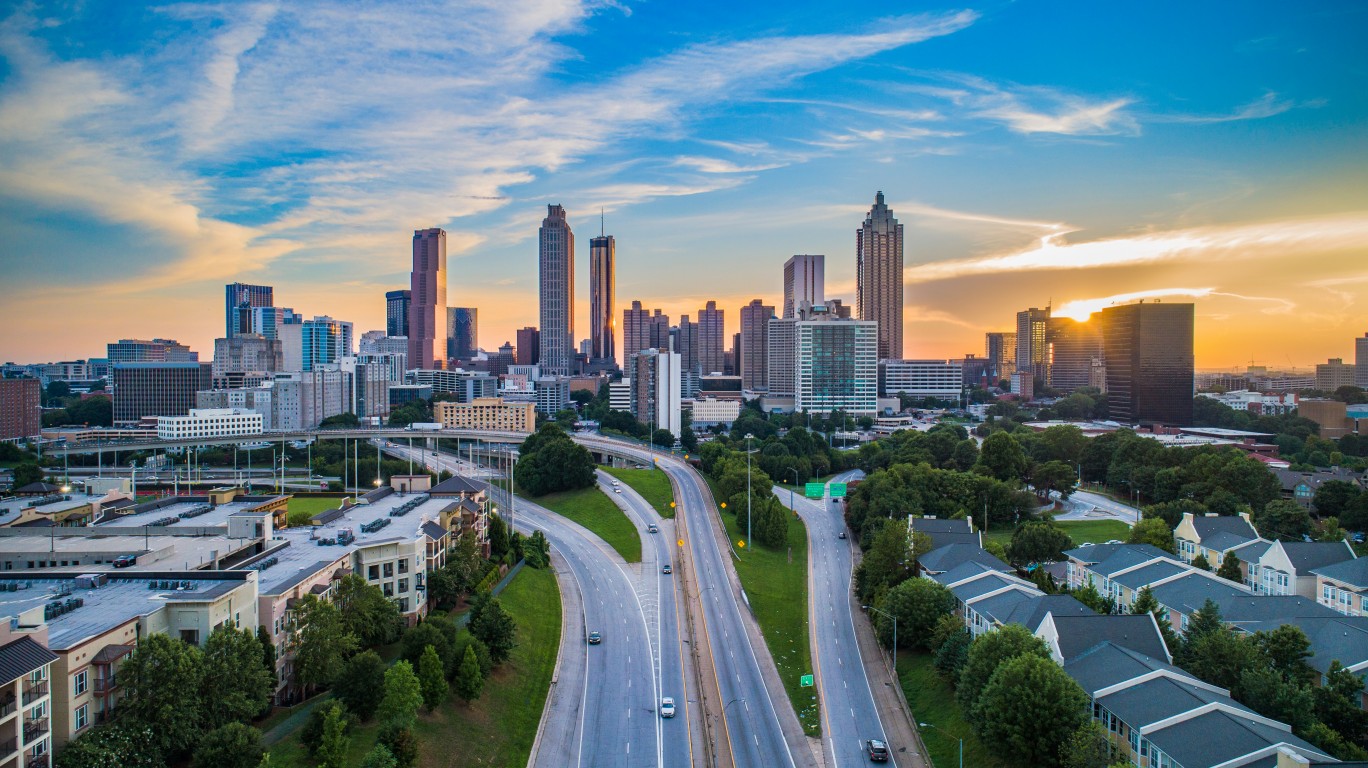
20. Atlanta-Sandy Springs-Alpharetta, GA
> Foreign-born population: 13.8%
> Median income of foreign-born households: $63,030 (90.9% of native-born)
> Foreign-born unemployment rate: 3.8% (1.7 ppts less than native-born)
> Foreign-born population who are naturalized U.S. citizens: 45.4%
> Total population: 5,862,424
Atlanta ranks as the 20th best metro area for immigrants, as economic indicators tend to be relatively positive for foreign-born residents. Most foreign born households earn over $63,000 per year – nearly in line with the national median income for all native-born American households.
Atlanta area immigrants tend to have higher educational attainment rates than is typical of foreign-born U.S. residents. Among area immigrants 25 and older, 77.5% have at least a high school diploma, compared to 72.4% of all immigrants that age. Also, 38.0% hold at least a bachelor’s degree, compared to 31.3% of foreign-born American residents.
[in-text-ad]

19. New York-Newark-Jersey City, NY-NJ-PA
> Foreign-born population: 29.5%
> Median income of foreign-born households: $66,079 (76.5% of native-born)
> Foreign-born unemployment rate: 4.7% (1.3 ppts less than native-born)
> Foreign-born population who are naturalized U.S. citizens: 57.2%
> Total population: 19,294,236
The New York City metro area has by far the most total foreign-born residents of anywhere in the country. Nearly 5.7 million immigrants live in the area, accounting for nearly 30% of the total population. Nationwide, 13.6% of U.S. residents were born abroad.
The New York area’s foreign-born median household income is just over $66,000 – about $6,500 higher than the national foreign-born median. These relatively high incomes are partly fueled by a low immigrant unemployment rate. New York’s foreign-born population has a 4.7% unemployment rate, which is roughly in line with the national foreign-born unemployment rate, but well below the New York City area’s native-born unemployment rate of 6.0%.
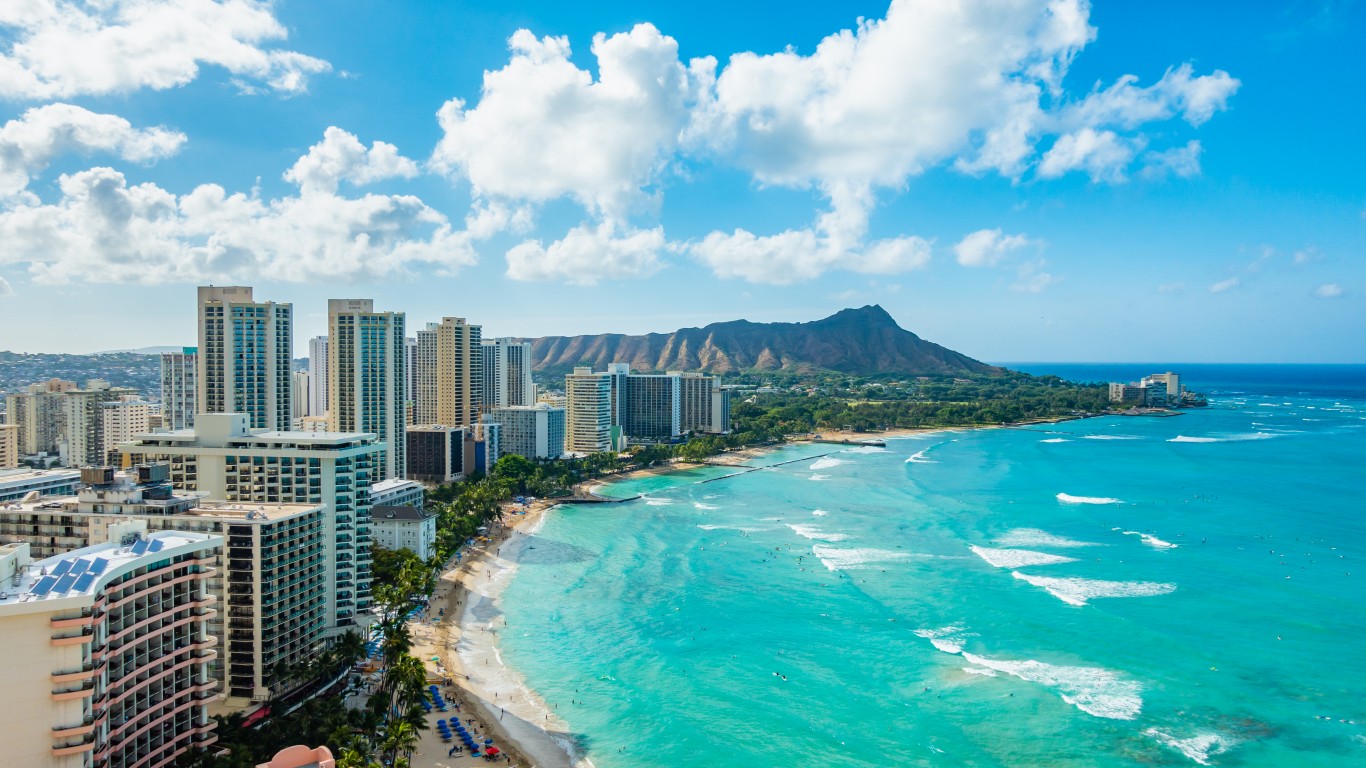
18. Urban Honolulu, HI
> Foreign-born population: 19.7%
> Median income of foreign-born households: $73,401 (82.1% of native-born)
> Foreign-born unemployment rate: 3.2% (1.0 ppts less than native-born)
> Foreign-born population who are naturalized U.S. citizens: 60.7%
> Total population: 984,821
Immigrants to the Urban Honolulu area of Hawaii tend to be on much better financial footing than most other immigrants and native-born Americans alike. Just 10.7% of foreign-born residents live below the poverty line, well below both the national poverty rate for foreign-born residents, at 15.4%, and for native-born Americans, at 13.1%. The unemployment rate among Honolulu area’s foreign-born residents is 3.2% – a full percentage point lower than that of the native-born residents.
Though Honolulu-area immigrant households earn just 82.1% of what native-born resident households do, their median household income of $73,401 is still well above the median household income for all foreign-born U.S. residents of $59,577.
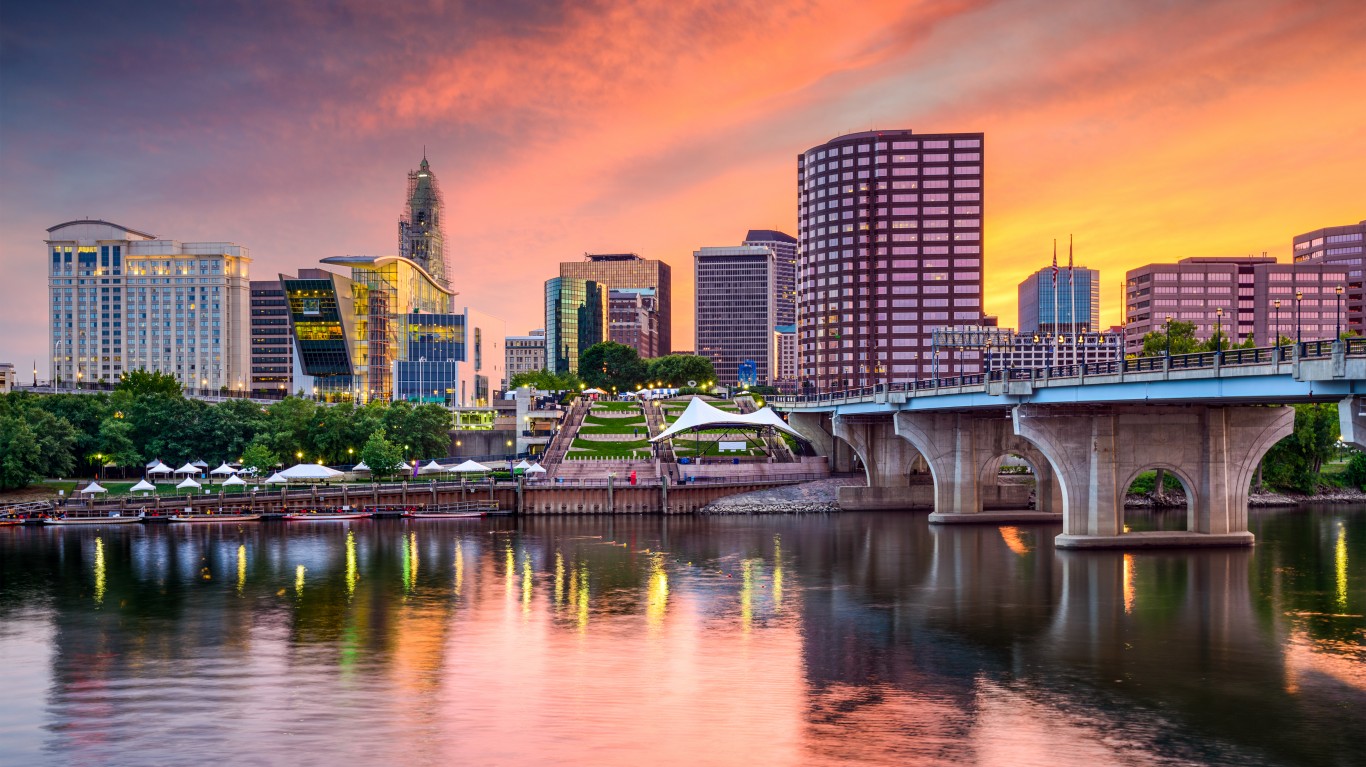
17. Hartford-East Hartford-Middletown, CT
> Foreign-born population: 13.3%
> Median income of foreign-born households: $70,231 (88.6% of native-born)
> Foreign-born unemployment rate: 4.9% (0.8 ppts less than native-born)
> Foreign-born population who are naturalized U.S. citizens: 56.8%
> Total population: 1,207,677
The Hartford metro area of Connecticut is one of 30 major U.S. metro areas in which foreign-born residents are actually less likely to live below the poverty line than native-born residents. The immigrant poverty rate of 9.7% is lower than the native-born poverty rate of 9.9% – both shares are well below the national rates of 15.4% and 13.1%, respectively.
Educational attainment can help boost earning potential and ensure financial security, and the foreign-born Hartford area residents tend to have relatively high educational attainment rates – 82.4% of area foreign-born residents 25 and older hold at least a high school diploma, 10 percentage points higher than the national rate for immigrants. Also, 37.8% of area immigrant residents that age hold at least a bachelor’s degree, well above the national rate of 31.3%.
[in-text-ad-2]

16. Las Vegas-Henderson-Paradise, NV
> Foreign-born population: 22.2%
> Median income of foreign-born households: $53,307 (86.7% of native-born)
> Foreign-born unemployment rate: 4.5% (2.7 ppts less than native-born)
> Foreign-born population who are naturalized U.S. citizens: 49.9%
> Total population: 2,182,004
The Las Vegas area has a relatively high five-year unemployment rate for native-born residents, at 7.2% – well above the 5.5% national figure. Yet the foreign-born unemployment rate is much lower, at 4.5% – slightly lower than the 4.6% unemployment rate for all foreign-born residents in the labor force. Also, the poverty rate of both native-born residents and immigrants in the Las Vegas area is the same, at 13.7%. Nationwide, the foreign-born poverty rate is 2.3 percentage points higher than it is for native-born Americans.
Across the country, native-born residents are much more likely to own a home than foreign-born residents are. In the Las Vegas area, both foreign and native residents have the same homeownership rate, at 53.8%. The national native-born homeownership rate is 66.0%, and the national foreign-born home ownership rate is 52.5%.
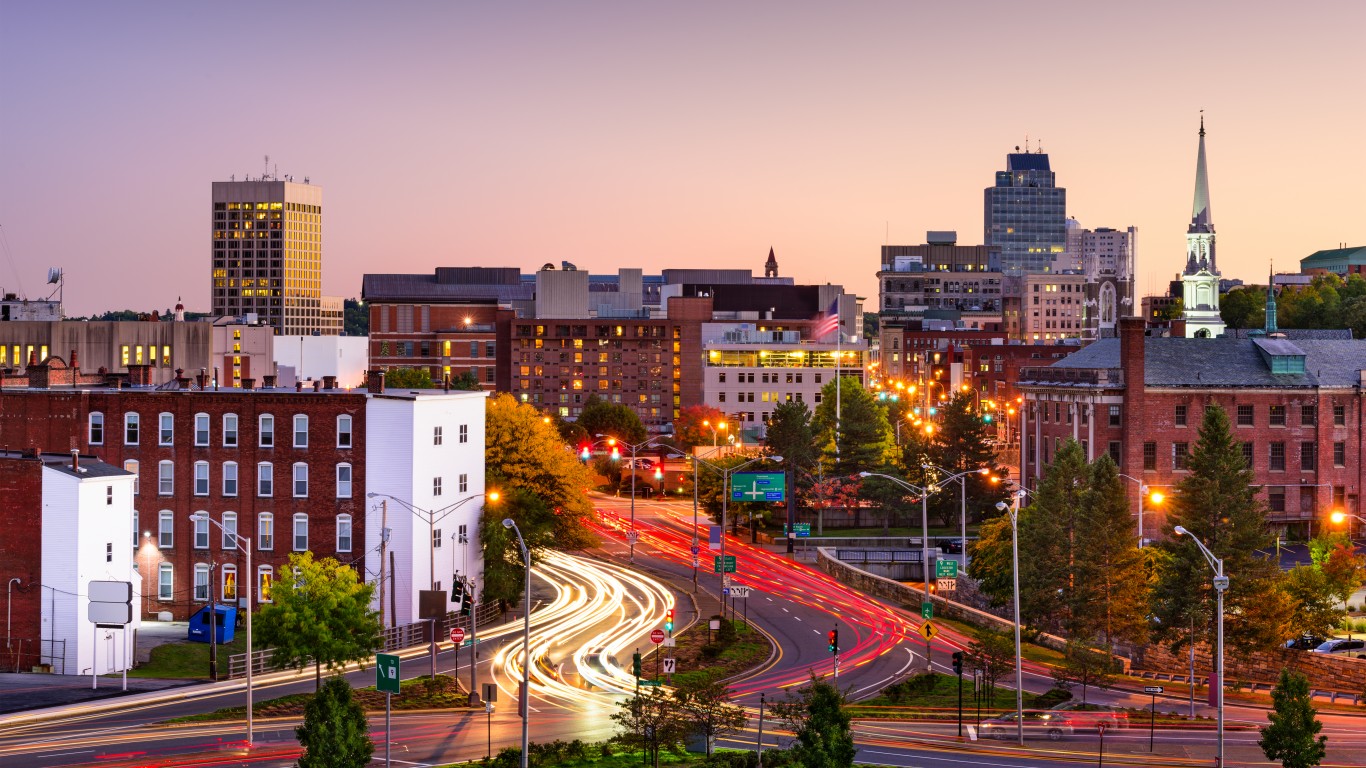
15. Worcester, MA-CT
> Foreign-born population: 11.2%
> Median income of foreign-born households: $70,803 (96.0% of native-born)
> Foreign-born unemployment rate: 4.6% (0.5 ppts less than native-born)
> Foreign-born population who are naturalized U.S. citizens: 54.0%
> Total population: 941,338
Across the country, the median household income among foreign-born residents is $59,557, amounting to 94.0% of the native-born median household income, at $63,368. In the Worcester, Massachusetts, metro area, the disparity is smaller – the foreign-born median household income is $70,803, which is 96.0% of the native-born median.
A college degree can help increase earning potential, and Worcester area foreign-born residents are more likely to hold at least a bachelor’s degree than their native-born counterparts. In the area, 38.5% of immigrants 25 and older hold at least a bachelor’s degree compared to 34.3% of native-born residents.
[in-text-ad]
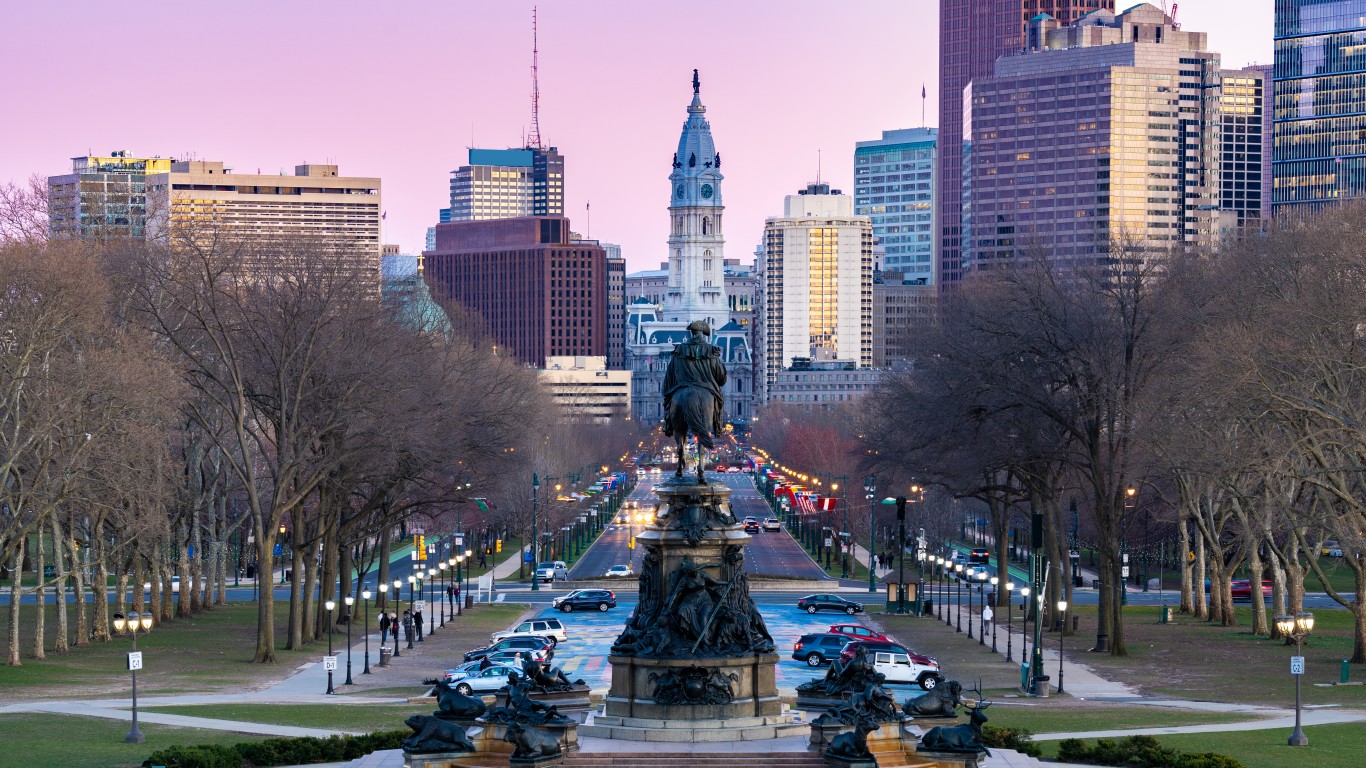
14. Philadelphia-Camden-Wilmington, PA-NJ-DE-MD
> Foreign-born population: 11.0%
> Median income of foreign-born households: $64,610 (88.0% of native-born)
> Foreign-born unemployment rate: 5.5% (0.7 ppts less than native-born)
> Foreign-born population who are naturalized U.S. citizens: 55.0%
> Total population: 6,079,130
Philadelphia ranks as one of the best places for immigrants in large part because of the educational attainment of the foreign-born population – 41.4% of immigrants 25 and older hold at least a bachelor’s degree. This is more than 10 percentage points higher than the national foreign-born bachelor’s degree attainment rate and higher than the Philadelphia area’s native-born rate of 37.3%.
Though it ranks as one of the better places for immigrants, the Philadelphia area has a relatively low share of foreign-born residents. Just 11.0% of the 6 million area residents were born outside of the U.S. However, the number of foreign-born Philly residents increased by 0.9% from 2015 to 2019 – more than double the overall U.S. growth rate of the immigrant population.
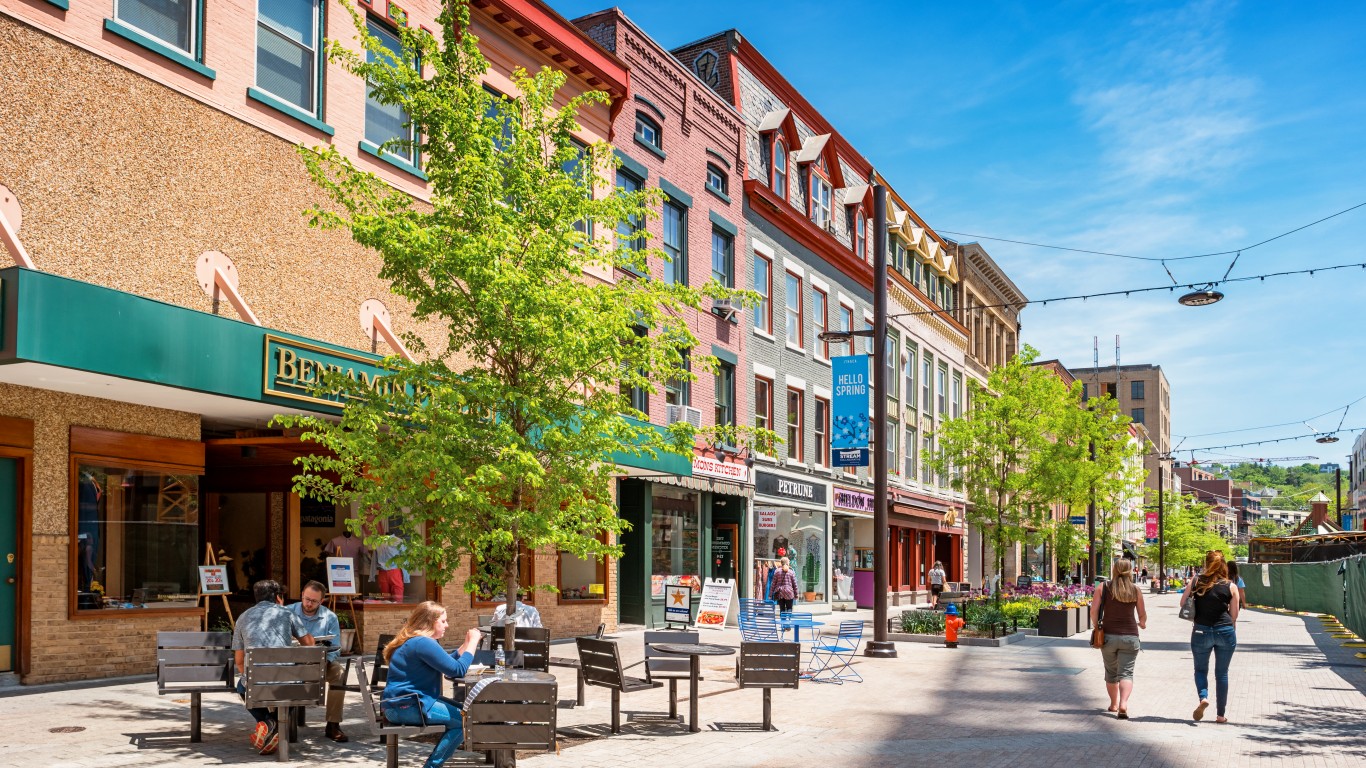
13. Ithaca, NY
> Foreign-born population: 12.9%
> Median income of foreign-born households: $52,060 (84.7% of native-born)
> Foreign-born unemployment rate: 2.7% (1.3 ppts less than native-born)
> Foreign-born population who are naturalized U.S. citizens: 41.0%
> Total population: 102,642
The Ithaca, New York, metro area is home to a little over 13,000 foreign-born area residents, accounting for just 12.9% of the population. Yet the area still ranks among the best cities for immigrants, as just 2.7% of foreign-born residents in the labor force are unemployed. This is well below the national foreign-born unemployment rate of 4.6% as well as the Ithaca area’s native-born unemployment rate of 4.0%.
Typically, native-born U.S. residents are slightly more likely to have a college degree than foreign-born ones. But in Ithaca, New York, home of Ivy League school Cornell University, this is not the case. Though 50.5% of native-born area residents 25 and older hold at least a bachelor’s degree, that share is well short of the 71.9% foreign-born bachelor’s degree attainment rate.
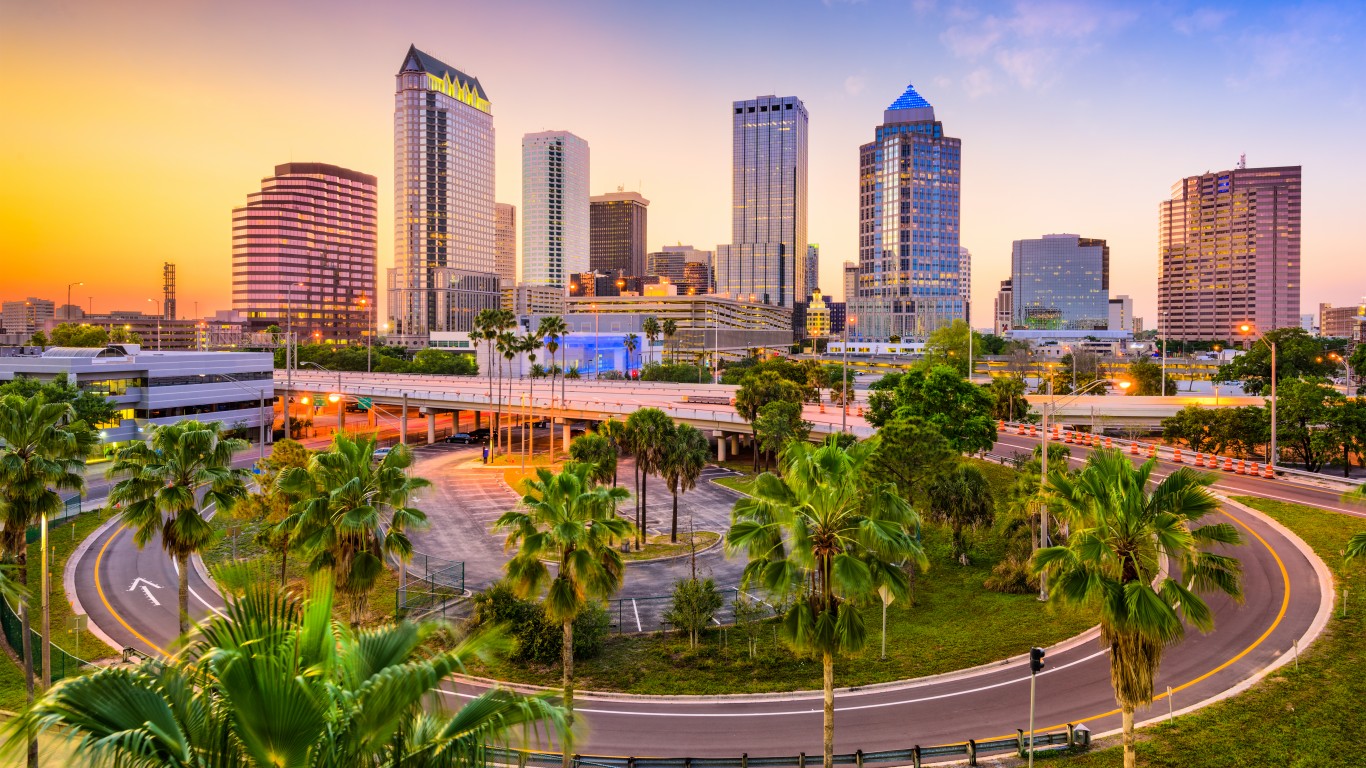
12. Tampa-St. Petersburg-Clearwater, FL
> Foreign-born population: 13.9%
> Median income of foreign-born households: $49,526 (87.6% of native-born)
> Foreign-born unemployment rate: 5.1% (0.5 ppts less than native-born)
> Foreign-born population who are naturalized U.S. citizens: 54.3%
> Total population: 3,097,859
The Tampa metro area of Florida has one of the fastest-growing immigrant populations in the country. The number of foreign-born residents increased by 1.1% from 2015 to 2019, nearly triple the national growth rate. The Tampa area is home to over 430,000 foreign-born residents.
Homeownership is a common way for Americans to build wealth, and more than 60% of foreign-born Tampa area residents own their own home, compared to the national foreign-born homeownership rate of 52.5%.
[in-text-ad-2]
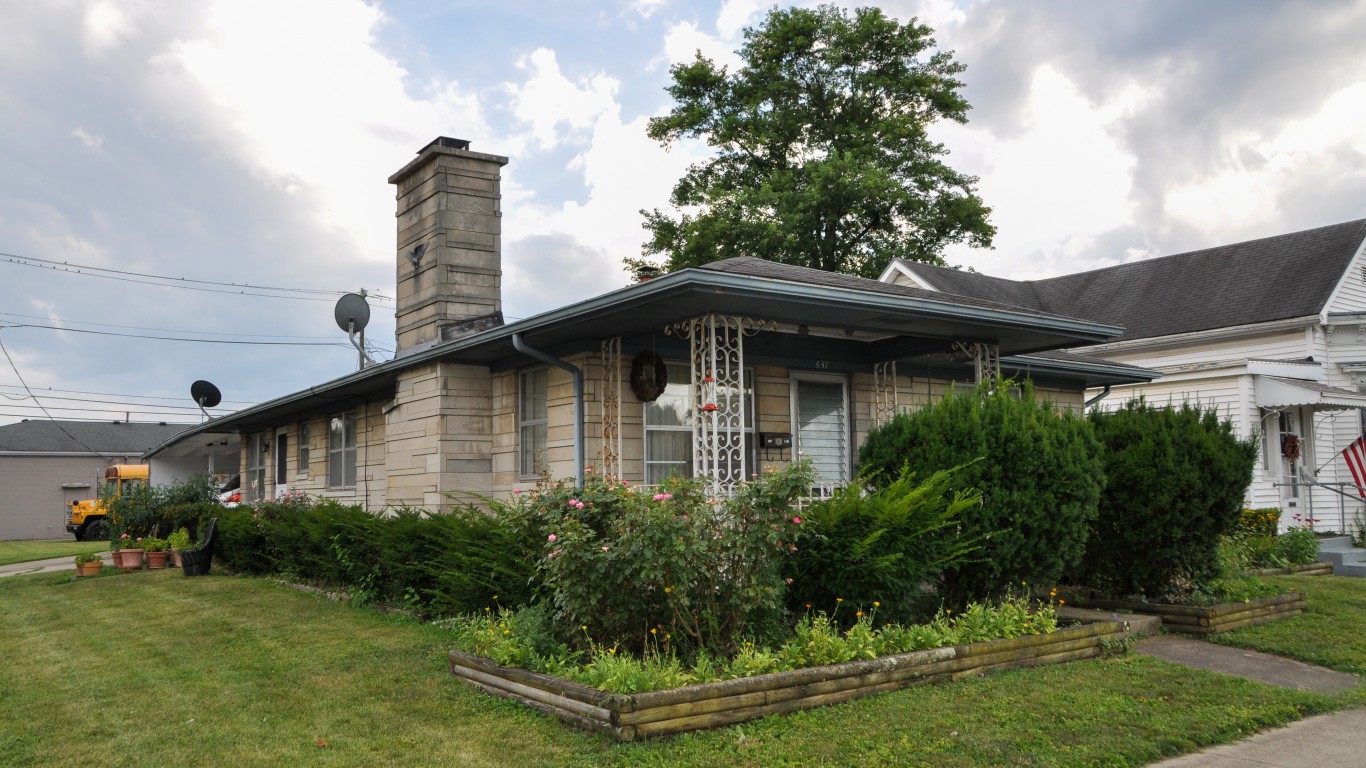
11. Columbus, IN
> Foreign-born population: 10.3%
> Median income of foreign-born households: $87,331 (145.4% of native-born)
> Foreign-born unemployment rate: 5.0% (0.9 ppts more than native-born)
> Foreign-born population who are naturalized U.S. citizens: 17.6%
> Total population: 82,481
Columbus, Indiana, ranks as one of the best cities for immigrants largely because foreign born median household income is higher than the native-born median, at $87,331 vs. just over $60,000 – by far the largest disparity of any U.S. metro area. In the Columbus area, 73.0% of employed foreign-born residents work in management, business, science, and arts occupations, which often pay relatively high salaries. Nationwide, less than a third of all foreign-born workers are employed in these sectors.
In the Columbus area, 64.2% of immigrants 25 and older have at least a bachelor’s degree compared to 29.1% of native-born Americans. A college degree helps qualify workers for higher-paying jobs. However, just 17.6% of foreign-born Columbus area residents are naturalized U.S. citizens, which is by far the lowest share of any U.S. metro area. Nationwide, nearly half of all foreign-born residents are also citizens.

10. Kahului-Wailuku-Lahaina, HI
> Foreign-born population: 18.7%
> Median income of foreign-born households: $77,174 (94.3% of native-born)
> Foreign-born unemployment rate: 3.1% (1.2 ppts less than native-born)
> Foreign-born population who are naturalized U.S. citizens: 54.8%
> Total population: 165,979
The Kahului-Wailuku-Lahaina metro area on the island of Maui in Hawaii has the 10th highest median income for foreign-born households, at $77,194. The poverty rate among immigrants to this area is also very low , at 8.8%, which is also lower than the Kahului metro area’s native-born poverty rate of 9.4%.
The foreign-born unemployment rate in the Kahului area is also relatively low, at 3.1%. The national foreign-born unemployment rate is 4.6%. From 2015 to 2019, the foreign-born population of the area grew by 0.8% – roughly double the national growth rate.
[in-text-ad]

9. San Francisco-Oakland-Berkeley, CA
> Foreign-born population: 30.7%
> Median income of foreign-born households: $97,101 (88.0% of native-born)
> Foreign-born unemployment rate: 3.7% (1.2 ppts less than native-born)
> Foreign-born population who are naturalized U.S. citizens: 56.6%
> Total population: 4,701,332
The San Francisco metro area has the fifth highest share of foreign-born residents in the country, at 30.7% – more than double the national rate of 13.6%. Just 10.1% of foreign-born residents live in poverty, well below the national rate of 15.4%.
Though foreign-born households in the San Francisco area only earn 88.0% of what native households do, their median income is over $97,000 – the second highest median of any major metro area in the country.
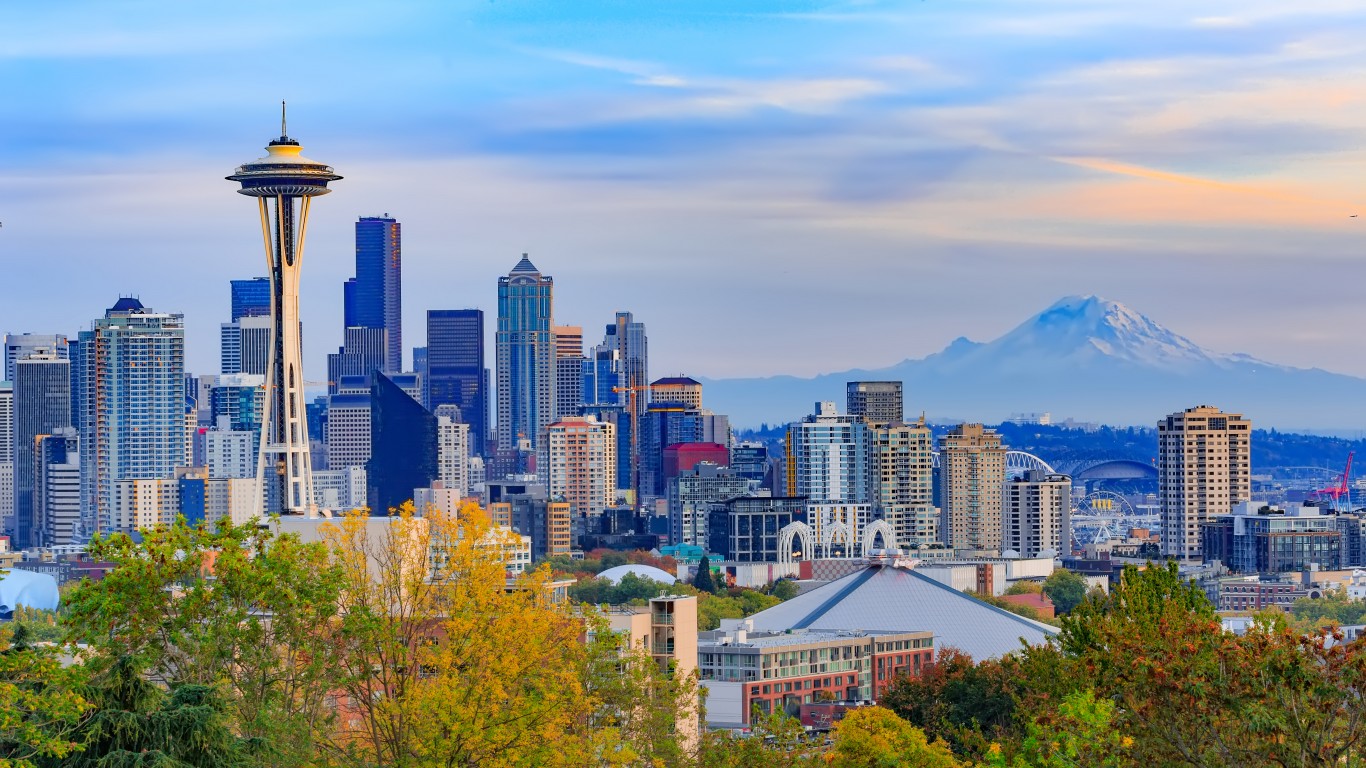
8. Seattle-Tacoma-Bellevue, WA
> Foreign-born population: 18.7%
> Median income of foreign-born households: $85,758 (98.5% of native-born)
> Foreign-born unemployment rate: 3.9% (0.7 ppts less than native-born)
> Foreign-born population who are naturalized U.S. citizens: 49.3%
> Total population: 3,871,323
The number of immigrants living in the Seattle area increased by 1.4% from 2015 to 2019, well above the 0.4% growth rate nationwide. Though native-born Americans are slightly more likely to have at least a bachelor’s degree than foreign born residents, the foreign-born bachelor’s degree attainment rate in Seattle is 44.8%, above the area’s native-born attainment rate of 42.4%.
The median household income for foreign-born Seattle area residents is $85,758 – nearly on par with the median household income for native-born residents. This is the fifth highest median income for immigrants in the country.

7. Vallejo, CA
> Foreign-born population: 20.1%
> Median income of foreign-born households: $77,001 (93.1% of native-born)
> Foreign-born unemployment rate: 4.5% (2.0 ppts less than native-born)
> Foreign-born population who are naturalized U.S. citizens: 59.3%
> Total population: 441,829
The Vallejo metro area in California’s Bay area ranks as one of the best cities for immigrants. It is one of just 20 major metro areas in which immigrants are more likely than native-born residents to own their own home. The foreign-born homeownership rate is 62.2%, slightly higher than the native-born homeownership rate of 61.3%.
Just 8.8% of foreign-born Vallejo area residents live below the poverty line, well below the 15.4% national foreign-born poverty rate and the fifth lowest share among all major U.S. metro areas. It is also one of few metro areas in which the native-born poverty rate is higher, at 9.4%.
[in-text-ad-2]
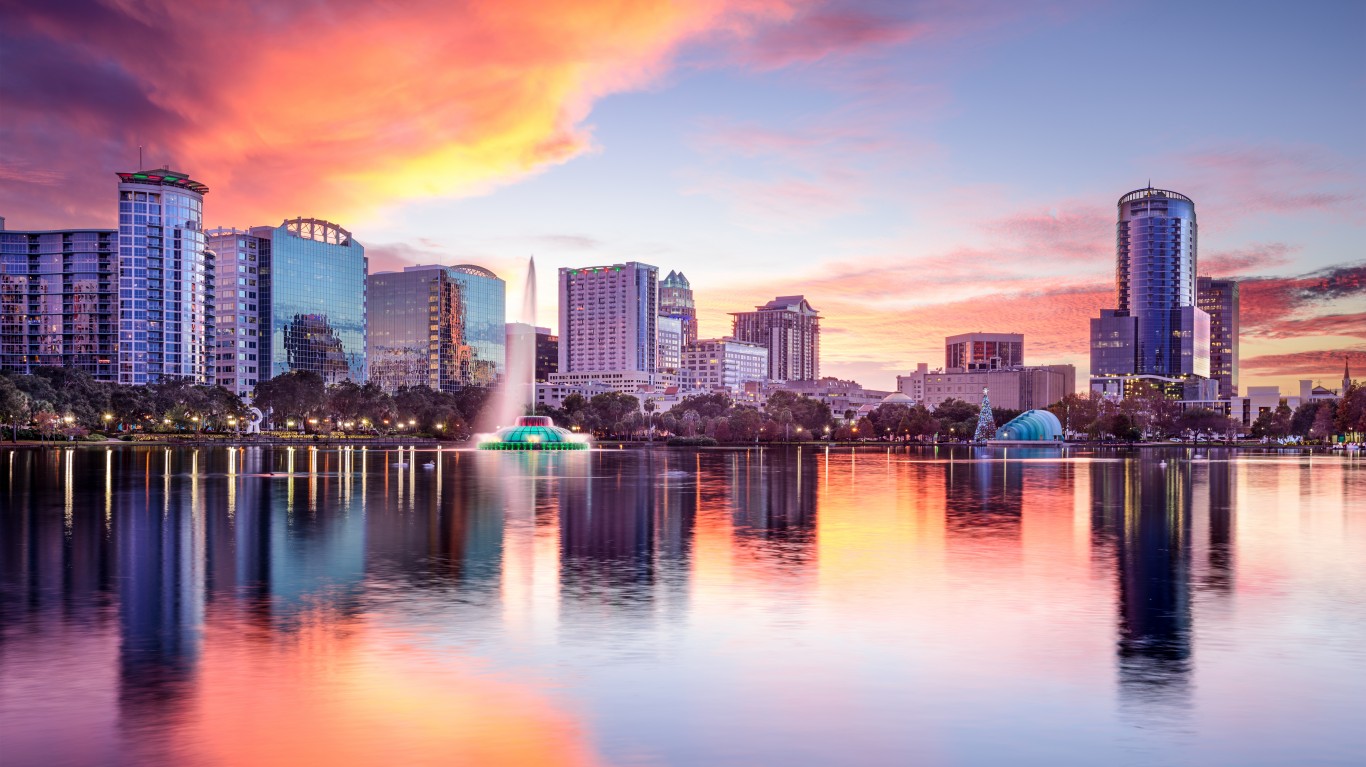
6. Orlando-Kissimmee-Sanford, FL
> Foreign-born population: 18.5%
> Median income of foreign-born households: $52,142 (86.5% of native-born)
> Foreign-born unemployment rate: 4.7% (0.6 ppts less than native-born)
> Foreign-born population who are naturalized U.S. citizens: 53.5%
> Total population: 2,508,970
The Orlando metro area of central Florida has the fifth fastest growing immigrant population in the country. The number of foreign-born residents increased by 1.8% from 2015 to 2019. This increase is more than four times higher than the 0.4% increase nationwide in that same time period.
Homeownership is one of the most practical ways to build wealth, but across the country the homeownership rate is lower among foreign-born residents than native-born Americans, at 52.5% and 66.0%, respectively. Yet in the Orlando area, the disparity is much smaller, as 57.2% of foreign-born residents own their home compared to 61.9% of native-born residents.
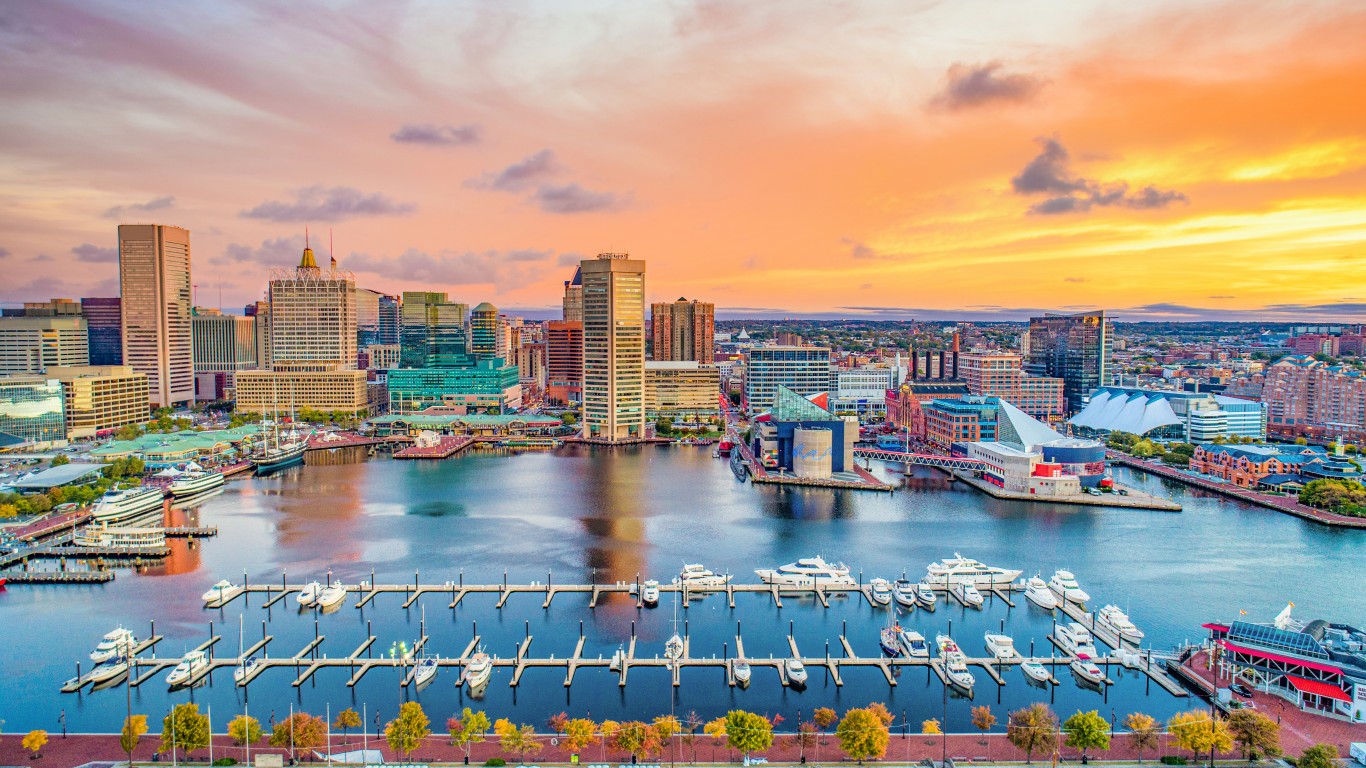
5. Baltimore-Columbia-Towson, MD
> Foreign-born population: 10.4%
> Median income of foreign-born households: $79,200 (96.7% of native-born)
> Foreign-born unemployment rate: 3.9% (1.4 ppts less than native-born)
> Foreign-born population who are naturalized U.S. citizens: 54.6%
> Total population: 2,796,733
The Baltimore metro area ranks as the fifth best place for immigrants in the country despite the relatively low share of area residents that were born abroad, at 10.4%. Nationwide, 13.6% of all residents are foreign-born. Yet the number of foreign-born residents increased by 0.8% from 2015 to 2019, double the national growth rate.
Nearly half of Baltimore’s foreign-born residents 25 and older, 48.7%, hold at least a bachelor’s degree. This is well above the national bachelor’s attainment rate for immigrants of 31.3% and the Baltimore area’s attainment rate for native-born residents of 39.1%. Foreign-born Baltimore area residents have relatively high earnings, with a median household income of $79,200. The immigrant poverty rate is also relatively low, at 10.3%.
[in-text-ad]
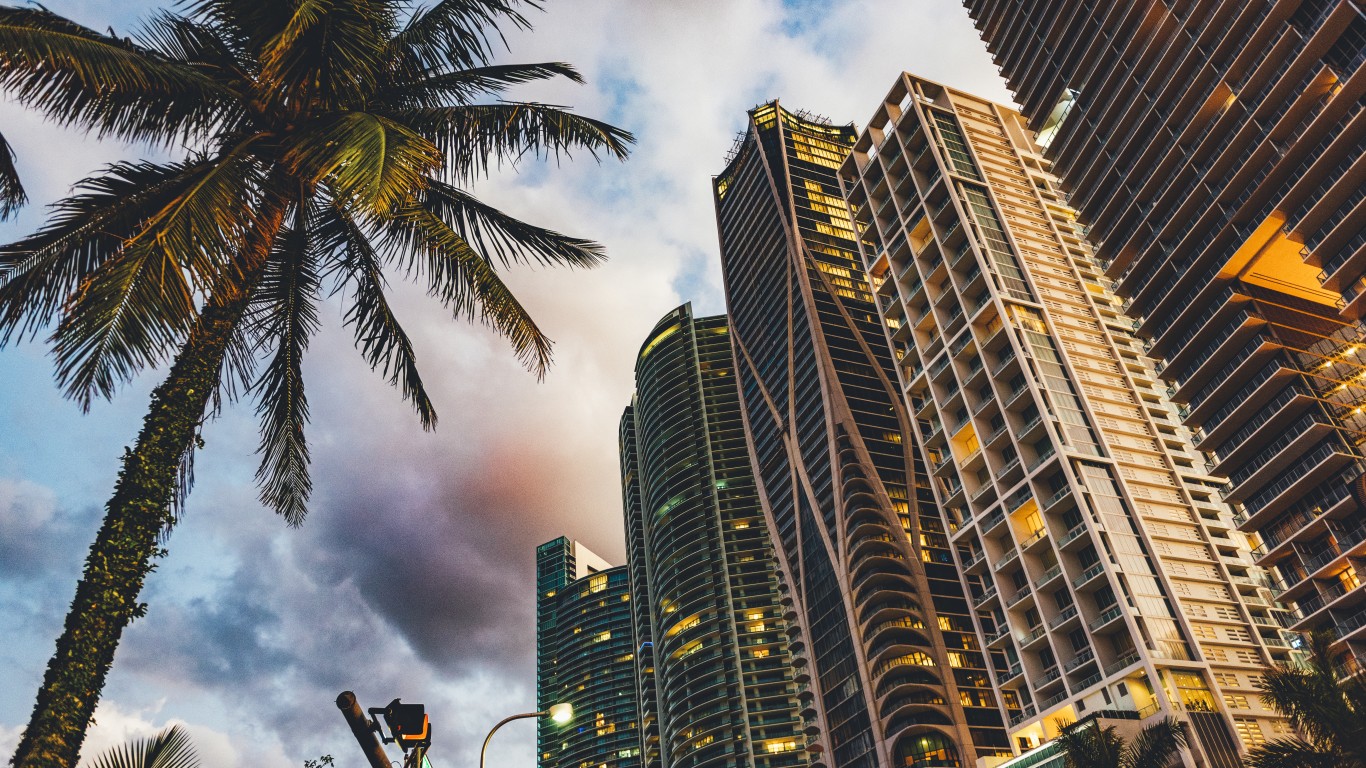
4. Miami-Fort Lauderdale-Pompano Beach, FL
> Foreign-born population: 40.7%
> Median income of foreign-born households: $49,603 (76.5% of native-born)
> Foreign-born unemployment rate: 4.9% (1.5 ppts less than native-born)
> Foreign-born population who are naturalized U.S. citizens: 57.7%
> Total population: 6,090,660
The Miami area has the highest share of foreign-born residents of any major metro area in the country, at 40.7%. This is nearly triple the overall U.S. share of foreign-born residents.
The Miami metro area also has one of the fastest-growing foreign-born populations in the country. The 1.8% increase in foreign-born residents from 2015 to 2019 represents the fourth-largest bump in immigrant residents of any major metro area. Though the area’s foreign-born unemployment rate of 4.9% is slightly higher than the nationwide rate, it is still lower than Miami’s U.S.-born unemployment rate of 6.4%.
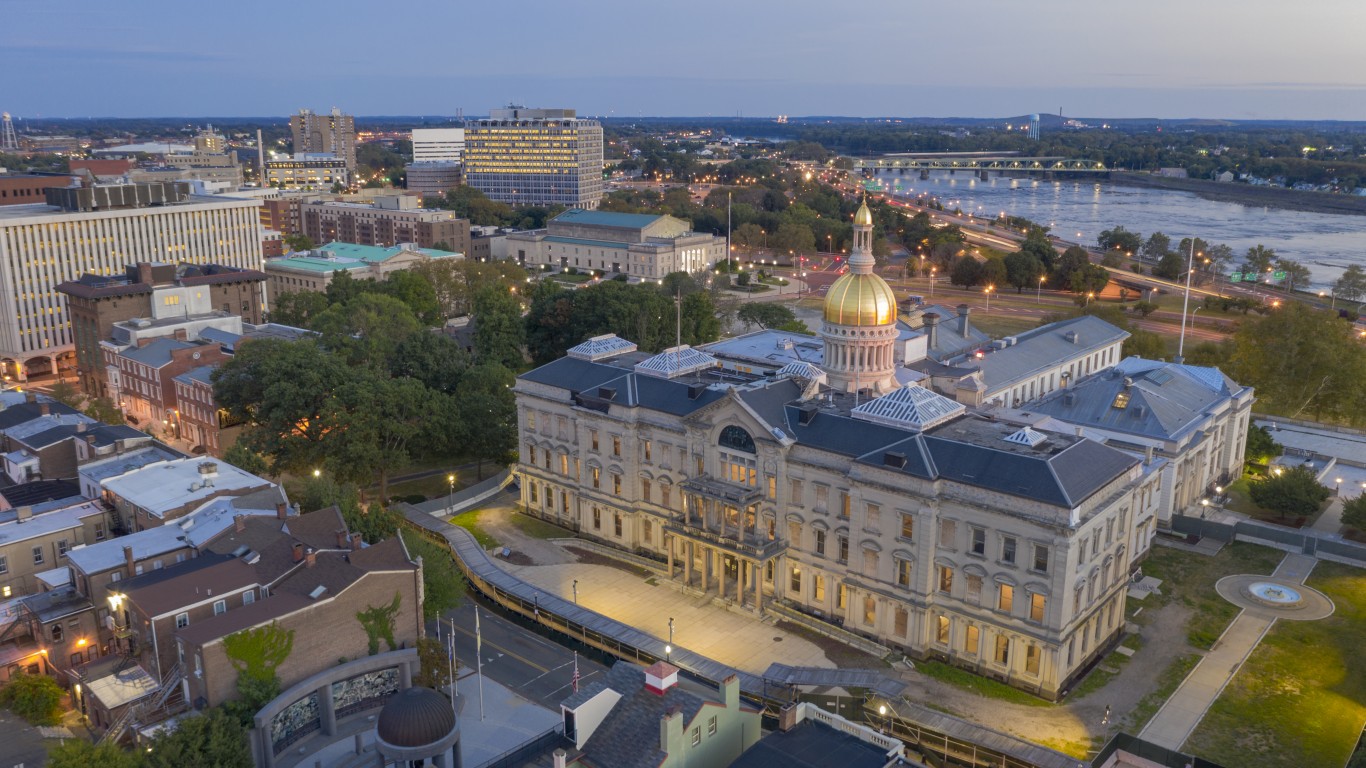
3. Trenton-Princeton, NJ
> Foreign-born population: 22.9%
> Median income of foreign-born households: $80,393 (99.0% of native-born)
> Foreign-born unemployment rate: 4.1% (2.9 ppts less than native-born)
> Foreign-born population who are naturalized U.S. citizens: 48.0%
> Total population: 367,922
The Trenton-Princeton metro area of New Jersey has one of the widest gaps in the unemployment rate of foreign and native residents of any U.S. major metro area. The five-year native-born unemployment rate is 7.0%, well above the 5.5% rate nationwide. Yet the five-year foreign-born unemployment rate is 4.1%, well below the 4.5% foreign-born unemployment rate across the U.S.
The Trenton area is one of just six major metro areas in which the median income of foreign-born households is more than $80,000. The national foreign-born median household income is just under $60,000.

2. Ann Arbor, MI
> Foreign-born population: 12.5%
> Median income of foreign-born households: $75,272 (104.1% of native-born)
> Foreign-born unemployment rate: 2.2% (2.3 ppts less than native-born)
> Foreign-born population who are naturalized U.S. citizens: 46.0%
> Total population: 367,000
Ann Arbor, Michigan, ranks as the second-best city for immigrants, one of two Midwest cities to rank among the top 25. It is one of just 33 major metro areas in which foreign-born residents earn more than native-born ones. The area’s foreign-born median household income of $75,272 is nearly $3,000 higher than its native-born median. Ann Arbor’s foreign-born unemployment rate of 2.2% is less than half of the native-born unemployment rate of 4.5%.
Ann Arbor, home of the University of Michigan, has among the highest bachelor’s degree attainment rates among foreign born at 70.6%, the fourth-highest share of any major metro area in the U.S.
[in-text-ad-2]
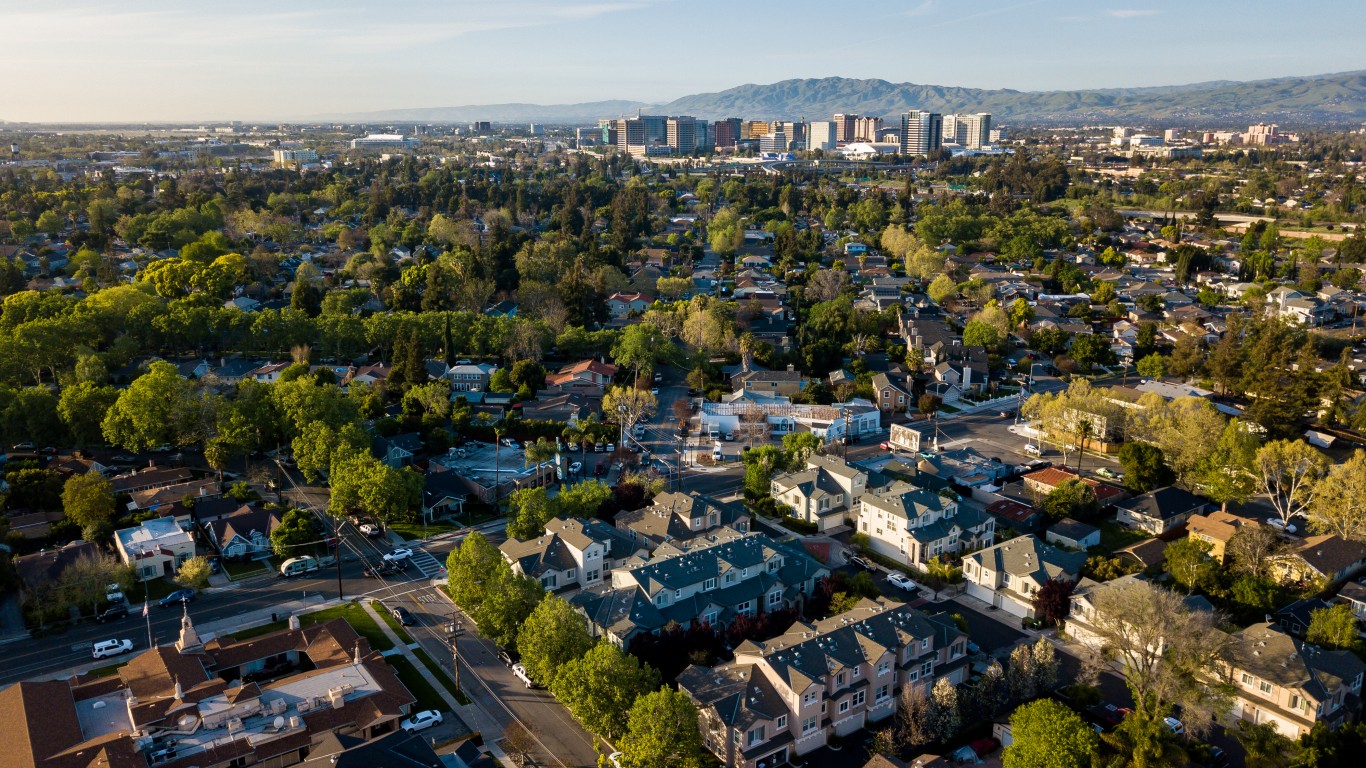
1. San Jose-Sunnyvale-Santa Clara, CA
> Foreign-born population: 38.6%
> Median income of foreign-born households: $128,161 (108.7% of native-born)
> Foreign-born unemployment rate: 3.7% (1.2 ppts less than native-born)
> Foreign-born population who are naturalized U.S. citizens: 53.1%
> Total population: 1,987,846
The San Jose, California, metro area ranks as the best place in the country for immigrants. The area, which makes up a large portion of Silicon Valley, has the largest median household income for foreign-born residents, at $128,161. This is over $10,000 more than what native-born households in the San Jose area earn. No other major metro area has a foreign-born median household income of even $100,000.
A college education can help boost job opportunities and earning potential, and 53.4% of all foreign-born adults 25 and older in the San Jose area have at least a bachelor’s degree, 3.9 percentage points higher than the native-born degree attainment rate. The San Jose area has the second-highest share of foreign-born residents of any metro area, at 38.6% – nearly triple the nationwide share of 13.6%.
Methodology
To determine the best cities for immigrants, 24/7 Wall St. developed an index based on various socioeconomic disparities among the native and foreign-born populations in all U.S. metropolitan statistical areas using five-year data from the Census Bureau’s 2019 American Community Survey. The index includes disparities between native- and foreign-born resident in these measures, each at full weight: the percentage of adults 25 and over with a high school diploma, the percentage of adults 25 and over with a bachelor’s degree or higher, the percentage of adults 16 years and over in the civilian labor force that are unemployed, median household income, poverty rate, homeownership rate, and the percentage of the employed population 16 years and over working in management, business, science, and arts occupations. Foreign-born residents as a percentage of the total population, the percentage of foreign-born residents that are naturalized citizens, and the growth in the foreign-born population as a percentage of the total population from 2015 to 2019 were also included in the index at full weight.
Get Ready To Retire (Sponsored)
Start by taking a quick retirement quiz from SmartAsset that will match you with up to 3 financial advisors that serve your area and beyond in 5 minutes, or less.
Each advisor has been vetted by SmartAsset and is held to a fiduciary standard to act in your best interests.
Here’s how it works:
1. Answer SmartAsset advisor match quiz
2. Review your pre-screened matches at your leisure. Check out the advisors’ profiles.
3. Speak with advisors at no cost to you. Have an introductory call on the phone or introduction in person and choose whom to work with in the future
Thank you for reading! Have some feedback for us?
Contact the 24/7 Wall St. editorial team.
 24/7 Wall St.
 24/7 Wall St.
 24/7 Wall St.