
The omicron variant brought new daily cases of COVID-19 to all time highs in the United States. Though omicron appears to have peaked, the virus is still spreading.
Since the first known case was identified in the U.S. on Jan. 21, 2020, there have been a total of 78,307,600 reported cases of COVID-19 nationwide — or 23,935 per 100,000 people. Of course, infections are not evenly spread across the country, and some states have far higher infections rates per capita than others. The number of confirmed cases per 100,000 people ranges from as low as 16,224 to as high as 32,000, depending on the state.
Though the first case of the novel coronavirus in the United States was on the West Coast, the early epicenter of the outbreak was on the other side of the country, in New York City. In the months since, virtually no corner of the country has been spared.
Still, some states have been hit harder than others.
The severity of a COVID-19 outbreak across a given state is subject to a wide range of factors. States that had a hands-off approach in the early days of the pandemic are more likely to be worse off today than those that adopted strict measures to control the spread. Arkansas, Iowa, Nebraska, North Dakota, Oklahoma, South Dakota, Utah, and Wyoming were the only states that did not issue a statewide stay-at-home order in March or early April 2020 — and six of those eight states have a higher infection rate than the U.S. as a whole.
All COVID-19 data used in this story are current as of March 2, 2022.

51. Hawaii
> Cumulative cases of COVID-19 as of March 2: 16,224 per 100,000 people (230,458 total cases)
> COVID-19 related deaths as of March 2: 93 per 100,000 people (1,322 total deaths)
> Population: 1,420,491
These are all the counties in Hawaii where COVID-19 is slowing (and where it’s still getting worse).

50. Oregon
> Cumulative cases of COVID-19 as of March 2: 16,559 per 100,000 people (693,929 total cases)
> COVID-19 related deaths as of March 2: 158 per 100,000 people (6,622 total deaths)
> Population: 4,190,713
These are all the counties in Oregon where COVID-19 is slowing (and where it’s still getting worse).

49. Maryland
> Cumulative cases of COVID-19 as of March 2: 16,592 per 100,000 people (1,002,634 total cases)
> COVID-19 related deaths as of March 2: 234 per 100,000 people (14,135 total deaths)
> Population: 6,042,718

48. Vermont
> Cumulative cases of COVID-19 as of March 2: 16,631 per 100,000 people (104,160 total cases)
> COVID-19 related deaths as of March 2: 91 per 100,000 people (568 total deaths)
> Population: 626,299

47. Maine
> Cumulative cases of COVID-19 as of March 2: 16,985 per 100,000 people (227,331 total cases)
> COVID-19 related deaths as of March 2: 154 per 100,000 people (2,065 total deaths)
> Population: 1,338,404
These are all the counties in Maine where COVID-19 is slowing (and where it’s still getting worse).

46. Washington
> Cumulative cases of COVID-19 as of March 2: 18,897 per 100,000 people (1,423,990 total cases)
> COVID-19 related deaths as of March 2: 157 per 100,000 people (11,866 total deaths)
> Population: 7,535,591

45. Virginia
> Cumulative cases of COVID-19 as of March 2: 19,271 per 100,000 people (1,641,453 total cases)
> COVID-19 related deaths as of March 2: 221 per 100,000 people (18,812 total deaths)
> Population: 8,517,685

44. Washington D.C.
> Cumulative cases of COVID-19 as of March 2: 19,659 per 100,000 people (134,564 total cases)
> COVID-19 related deaths as of March 2: 193 per 100,000 people (1,318 total deaths)
> Population: 702,455
Click here to see all current COVID-19 data for Washington D.C.

43. Connecticut
> Cumulative cases of COVID-19 as of March 2: 20,248 per 100,000 people (723,389 total cases)
> COVID-19 related deaths as of March 2: 293 per 100,000 people (10,470 total deaths)
> Population: 3,572,665

42. Pennsylvania
> Cumulative cases of COVID-19 as of March 2: 21,527 per 100,000 people (2,757,036 total cases)
> COVID-19 related deaths as of March 2: 337 per 100,000 people (43,216 total deaths)
> Population: 12,807,060

41. New Hampshire
> Cumulative cases of COVID-19 as of March 2: 21,996 per 100,000 people (298,362 total cases)
> COVID-19 related deaths as of March 2: 175 per 100,000 people (2,377 total deaths)
> Population: 1,356,458

40. Nevada
> Cumulative cases of COVID-19 as of March 2: 22,534 per 100,000 people (683,766 total cases)
> COVID-19 related deaths as of March 2: 320 per 100,000 people (9,704 total deaths)
> Population: 3,034,392
These are all the counties in Nevada where COVID-19 is slowing (and where it’s still getting worse).

39. California
> Cumulative cases of COVID-19 as of March 2: 22,653 per 100,000 people (8,960,997 total cases)
> COVID-19 related deaths as of March 2: 214 per 100,000 people (84,700 total deaths)
> Population: 39,557,045

38. Ohio
> Cumulative cases of COVID-19 as of March 2: 22,704 per 100,000 people (2,653,940 total cases)
> COVID-19 related deaths as of March 2: 313 per 100,000 people (36,580 total deaths)
> Population: 11,689,442
These are all the counties in Ohio where COVID-19 is slowing (and where it’s still getting worse).

37. Missouri
> Cumulative cases of COVID-19 as of March 2: 22,799 per 100,000 people (1,396,745 total cases)
> COVID-19 related deaths as of March 2: 308 per 100,000 people (18,858 total deaths)
> Population: 6,126,452

36. Texas
> Cumulative cases of COVID-19 as of March 2: 22,818 per 100,000 people (6,549,206 total cases)
> COVID-19 related deaths as of March 2: 291 per 100,000 people (83,549 total deaths)
> Population: 28,701,845
These are all the counties in Texas where COVID-19 is slowing (and where it’s still getting worse).

35. Colorado
> Cumulative cases of COVID-19 as of March 2: 23,067 per 100,000 people (1,313,779 total cases)
> COVID-19 related deaths as of March 2: 207 per 100,000 people (11,772 total deaths)
> Population: 5,695,564

34. Georgia
> Cumulative cases of COVID-19 as of March 2: 23,433 per 100,000 people (2,465,056 total cases)
> COVID-19 related deaths as of March 2: 337 per 100,000 people (35,415 total deaths)
> Population: 10,519,475

33. Nebraska
> Cumulative cases of COVID-19 as of March 2: 23,524 per 100,000 people (453,838 total cases)
> COVID-19 related deaths as of March 2: 207 per 100,000 people (3,986 total deaths)
> Population: 1,929,268

32. Michigan
> Cumulative cases of COVID-19 as of March 2: 23,614 per 100,000 people (2,360,399 total cases)
> COVID-19 related deaths as of March 2: 345 per 100,000 people (34,505 total deaths)
> Population: 9,995,915

31. Illinois
> Cumulative cases of COVID-19 as of March 2: 23,791 per 100,000 people (3,031,220 total cases)
> COVID-19 related deaths as of March 2: 290 per 100,000 people (36,910 total deaths)
> Population: 12,741,080

30. Iowa
> Cumulative cases of COVID-19 as of March 2: 23,892 per 100,000 people (754,073 total cases)
> COVID-19 related deaths as of March 2: 288 per 100,000 people (9,085 total deaths)
> Population: 3,156,145
These are all the counties in Iowa where COVID-19 is slowing (and where it’s still getting worse).

29. Massachusetts
> Cumulative cases of COVID-19 as of March 2: 24,214 per 100,000 people (1,671,292 total cases)
> COVID-19 related deaths as of March 2: 339 per 100,000 people (23,424 total deaths)
> Population: 6,902,149

28. Idaho
> Cumulative cases of COVID-19 as of March 2: 24,294 per 100,000 people (426,164 total cases)
> COVID-19 related deaths as of March 2: 271 per 100,000 people (4,751 total deaths)
> Population: 1,754,208
These are all the counties in Idaho where COVID-19 is slowing (and where it’s still getting worse).

27. New Jersey
> Cumulative cases of COVID-19 as of March 2: 24,331 per 100,000 people (2,167,515 total cases)
> COVID-19 related deaths as of March 2: 369 per 100,000 people (32,915 total deaths)
> Population: 8,908,520

26. New Mexico
> Cumulative cases of COVID-19 as of March 2: 24,407 per 100,000 people (511,434 total cases)
> COVID-19 related deaths as of March 2: 330 per 100,000 people (6,919 total deaths)
> Population: 2,095,428

25. North Carolina
> Cumulative cases of COVID-19 as of March 2: 24,938 per 100,000 people (2,589,517 total cases)
> COVID-19 related deaths as of March 2: 217 per 100,000 people (22,570 total deaths)
> Population: 10,383,620

24. Louisiana
> Cumulative cases of COVID-19 as of March 2: 24,947 per 100,000 people (1,162,537 total cases)
> COVID-19 related deaths as of March 2: 356 per 100,000 people (16,606 total deaths)
> Population: 4,659,978
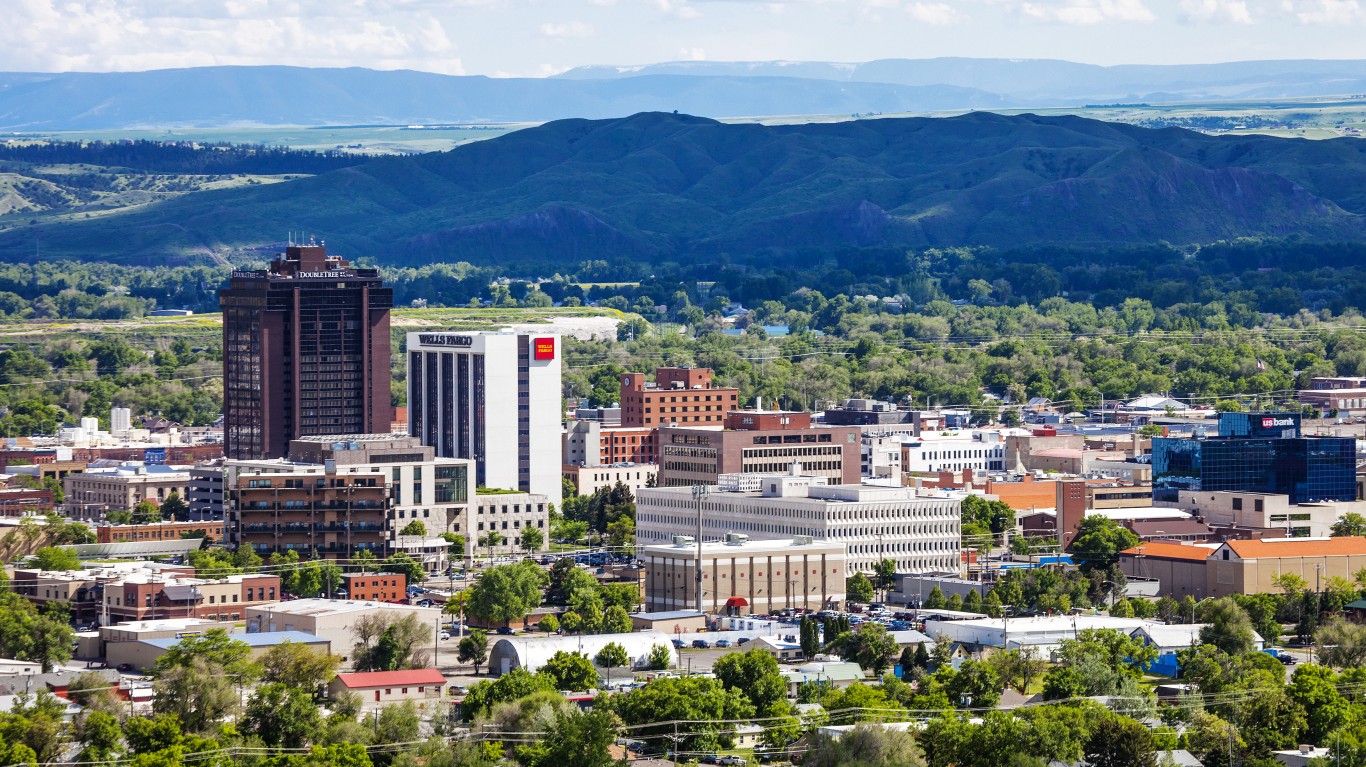
23. Montana
> Cumulative cases of COVID-19 as of March 2: 25,094 per 100,000 people (266,579 total cases)
> COVID-19 related deaths as of March 2: 300 per 100,000 people (3,187 total deaths)
> Population: 1,062,305

22. New York
> Cumulative cases of COVID-19 as of March 2: 25,121 per 100,000 people (4,909,134 total cases)
> COVID-19 related deaths as of March 2: 342 per 100,000 people (66,769 total deaths)
> Population: 19,542,209

21. Indiana
> Cumulative cases of COVID-19 as of March 2: 25,130 per 100,000 people (1,681,685 total cases)
> COVID-19 related deaths as of March 2: 341 per 100,000 people (22,843 total deaths)
> Population: 6,691,878

20. Minnesota
> Cumulative cases of COVID-19 as of March 2: 25,192 per 100,000 people (1,413,576 total cases)
> COVID-19 related deaths as of March 2: 219 per 100,000 people (12,289 total deaths)
> Population: 5,611,179

19. Oklahoma
> Cumulative cases of COVID-19 as of March 2: 25,877 per 100,000 people (1,020,367 total cases)
> COVID-19 related deaths as of March 2: 329 per 100,000 people (12,990 total deaths)
> Population: 3,943,079

18. Alabama
> Cumulative cases of COVID-19 as of March 2: 26,195 per 100,000 people (1,280,357 total cases)
> COVID-19 related deaths as of March 2: 374 per 100,000 people (18,287 total deaths)
> Population: 4,887,871

17. Kansas
> Cumulative cases of COVID-19 as of March 2: 26,311 per 100,000 people (766,045 total cases)
> COVID-19 related deaths as of March 2: 273 per 100,000 people (7,946 total deaths)
> Population: 2,911,510
These are all the counties in Kansas where COVID-19 is slowing (and where it’s still getting worse).

16. Mississippi
> Cumulative cases of COVID-19 as of March 2: 26,450 per 100,000 people (789,940 total cases)
> COVID-19 related deaths as of March 2: 403 per 100,000 people (12,039 total deaths)
> Population: 2,986,530

15. Delaware
> Cumulative cases of COVID-19 as of March 2: 26,533 per 100,000 people (256,621 total cases)
> COVID-19 related deaths as of March 2: 280 per 100,000 people (2,709 total deaths)
> Population: 967,171

14. South Dakota
> Cumulative cases of COVID-19 as of March 2: 26,737 per 100,000 people (235,882 total cases)
> COVID-19 related deaths as of March 2: 318 per 100,000 people (2,805 total deaths)
> Population: 882,235
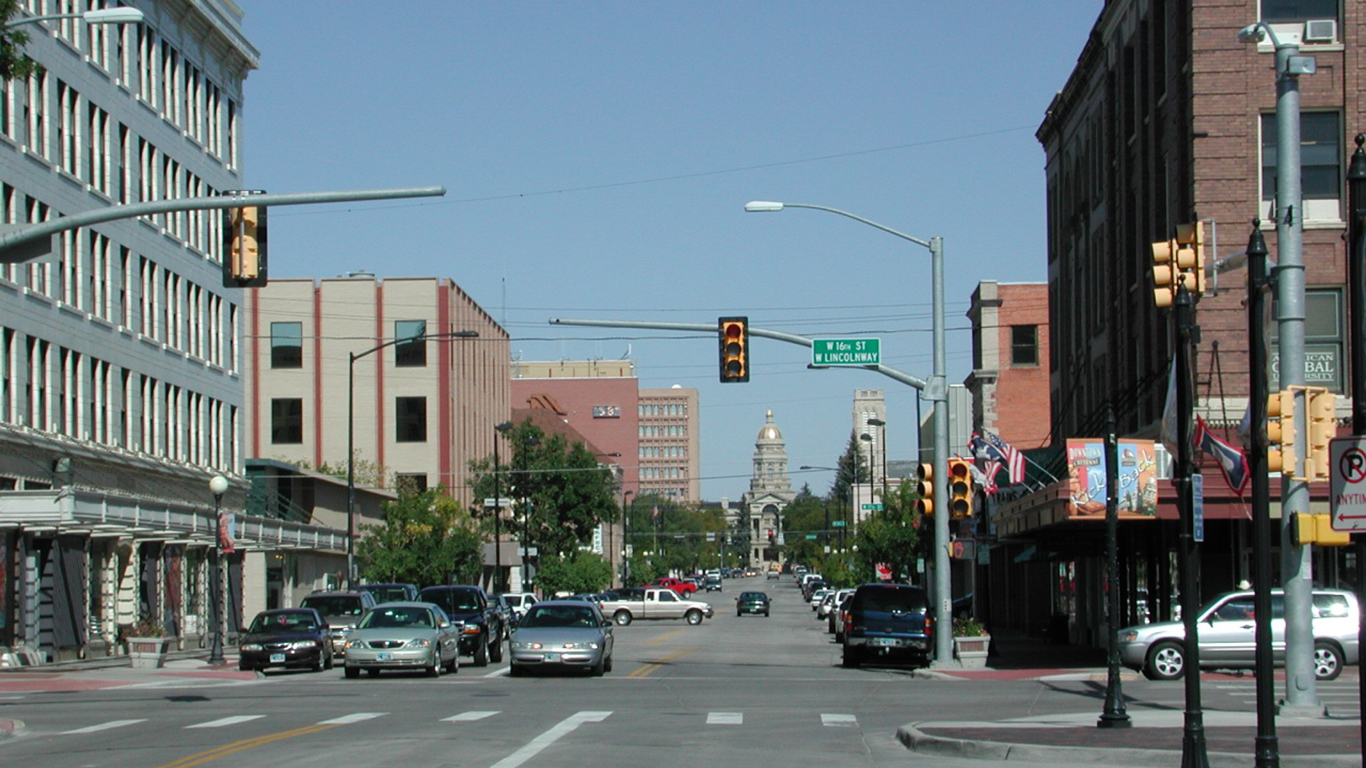
13. Wyoming
> Cumulative cases of COVID-19 as of March 2: 26,846 per 100,000 people (155,101 total cases)
> COVID-19 related deaths as of March 2: 297 per 100,000 people (1,718 total deaths)
> Population: 577,737

12. Wisconsin
> Cumulative cases of COVID-19 as of March 2: 27,040 per 100,000 people (1,571,997 total cases)
> COVID-19 related deaths as of March 2: 229 per 100,000 people (13,297 total deaths)
> Population: 5,813,568

11. West Virginia
> Cumulative cases of COVID-19 as of March 2: 27,140 per 100,000 people (490,111 total cases)
> COVID-19 related deaths as of March 2: 350 per 100,000 people (6,317 total deaths)
> Population: 1,805,832

10. Arkansas
> Cumulative cases of COVID-19 as of March 2: 27,207 per 100,000 people (819,984 total cases)
> COVID-19 related deaths as of March 2: 349 per 100,000 people (10,524 total deaths)
> Population: 3,013,825

9. Florida
> Cumulative cases of COVID-19 as of March 2: 27,271 per 100,000 people (5,808,620 total cases)
> COVID-19 related deaths as of March 2: 330 per 100,000 people (70,247 total deaths)
> Population: 21,299,325

8. Arizona
> Cumulative cases of COVID-19 as of March 2: 27,565 per 100,000 people (1,976,890 total cases)
> COVID-19 related deaths as of March 2: 390 per 100,000 people (27,946 total deaths)
> Population: 7,171,646

7. Kentucky
> Cumulative cases of COVID-19 as of March 2: 28,586 per 100,000 people (1,277,352 total cases)
> COVID-19 related deaths as of March 2: 310 per 100,000 people (13,856 total deaths)
> Population: 4,468,402

6. South Carolina
> Cumulative cases of COVID-19 as of March 2: 28,739 per 100,000 people (1,461,127 total cases)
> COVID-19 related deaths as of March 2: 332 per 100,000 people (16,864 total deaths)
> Population: 5,084,127

5. Utah
> Cumulative cases of COVID-19 as of March 2: 29,194 per 100,000 people (922,852 total cases)
> COVID-19 related deaths as of March 2: 140 per 100,000 people (4,411 total deaths)
> Population: 3,161,105
These are all the counties in Utah where COVID-19 is slowing (and where it’s still getting worse).

4. Tennessee
> Cumulative cases of COVID-19 as of March 2: 29,639 per 100,000 people (2,006,591 total cases)
> COVID-19 related deaths as of March 2: 362 per 100,000 people (24,495 total deaths)
> Population: 6,770,010

3. North Dakota
> Cumulative cases of COVID-19 as of March 2: 31,320 per 100,000 people (238,053 total cases)
> COVID-19 related deaths as of March 2: 288 per 100,000 people (2,192 total deaths)
> Population: 760,077

2. Alaska
> Cumulative cases of COVID-19 as of March 2: 31,412 per 100,000 people (231,645 total cases)
> COVID-19 related deaths as of March 2: 153 per 100,000 people (1,130 total deaths)
> Population: 737,438
These are all the counties in Alaska where COVID-19 is slowing (and where it’s still getting worse).

1. Rhode Island
> Cumulative cases of COVID-19 as of March 2: 32,000 per 100,000 people (338,338 total cases)
> COVID-19 related deaths as of March 2: 323 per 100,000 people (3,412 total deaths)
> Population: 1,057,315
Click here to see all coronavirus data for every state.
Thank you for reading! Have some feedback for us?
Contact the 24/7 Wall St. editorial team.
