Special Report
US City Economies That Were Growing the Fastest Before the Pandemic

Published:

More than two years have passed since the pandemic hit the U.S. yet COVID-19 continues to have a knock-on effect on consumers, contributing to the highest inflation in 40 years. After plunging by 3.4% in 2020 from pandemic-related lockdowns that crippled consumer activity, real U.S. gross domestic product rebounded in 2021 by 5.7% as the economy heated up from pent-up consumer demand for goods and services.
Prior to the pandemic, the U.S. economy was running hot with the lowest unemployment rate in 50 years. But what parts of the U.S. had been experiencing the fastest economic growth before and during the pandemic?
To identify the 25 fastest growing city economies, 24/7 Wall St. reviewed real gross domestic product figures from the Bureau of Economic Analysis. The 383 metro areas with data were ranked by the change in real GDP from 2001 to 2020. Information about the largest growing industry over that time and the industry’s GDP also came from the BEA. Population figures and unemployment rate are five-year estimates for 2019 from the Census Bureau 2019 American Community Survey.
The 25 metropolitan areas on this list are home to 16.2 million Americans or 5% of the U.S. population. These areas produced $1.34 trillion in goods and services in 2020, or 7.3% of the country’s total real GDP. The average GDP growth from 2001 to 2020 in these metro areas ranges from 76% in the agricultural-focused community in and around Bakersfield, California (population 887,641) to 439% in the oil-rich Midland, Texas, area (population 173,816). (Check out America’s 50 best cities to live.)
Four of these areas have populations greater than 1 million people, led by Seattle-Tacoma, Washington, home to 3.9 million residents. The Seattle metro area’s GDP grew by 91% from 2001 to 2020 to $375 billion, 10th largest economy of the 383 metro areas reviewed. (Looking at counties fastest shrinking local economies in America.)
The 2019 average unemployment rate in these metro areas was 5%, or between 2.5% in the Logan, Utah, metro area to 9.8% in Bakersfield. Five of these metropolitan areas are located in Texas, while there are three each in California and Utah. As the unemployment data shows, a high GDP growth rate does not necessarily correlate with low unemployment, as some products and services require fewer workers than others.
Click here for the US city economies that were growing the fastest before the pandemic
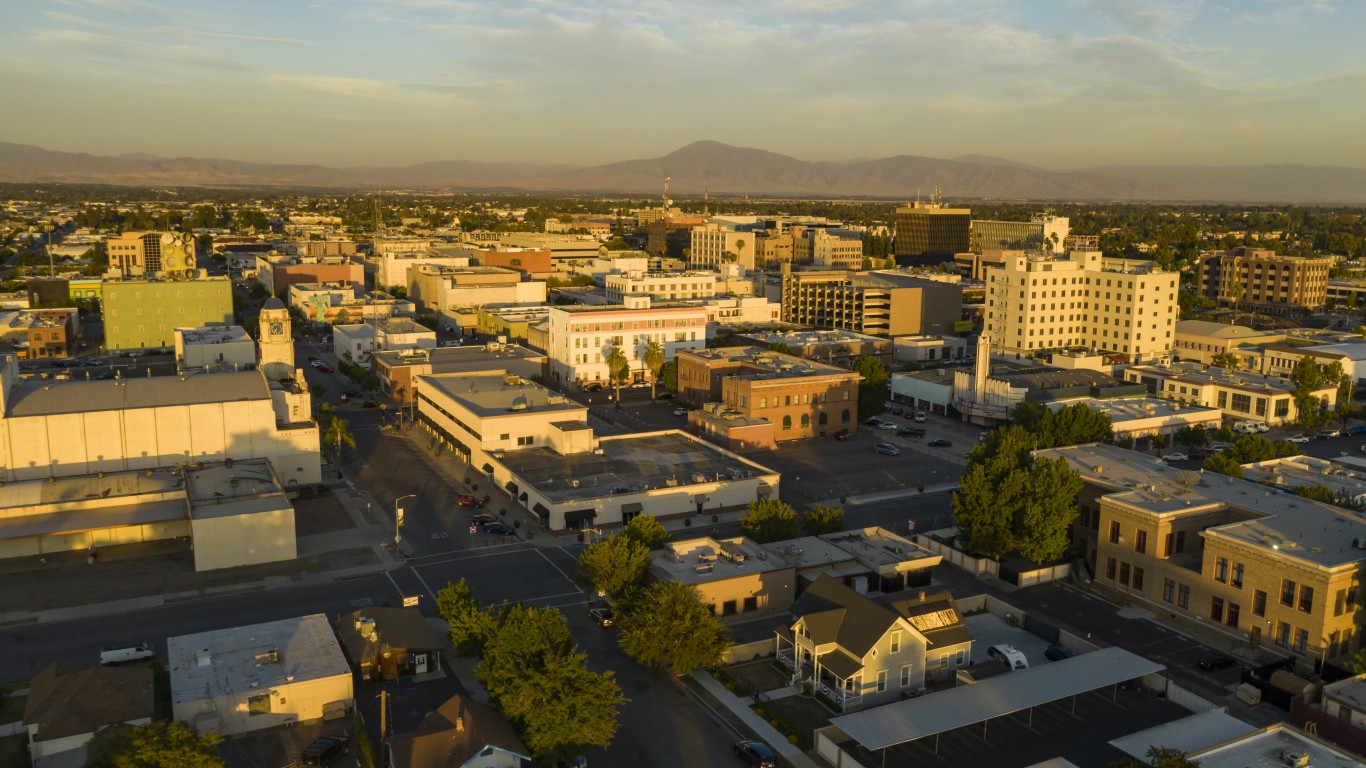
25. Bakersfield, CA
> GDP growth, 2001-2020: 76.03%
> Real GDP, 2020: $48.67 billion – #59 largest
> Industry with largest growth, 2001-2020: Agriculture, forestry, fishing and hunting (624.97%)
> Largest growth industry GDP, 2020: $6.30 billion (12.94% of metro GDP)
> Unemployment rate, 2019: 9.78% – #4 highest
> Population, 2019: 887,641 – #62 of 383 metros
[in-text-ad]
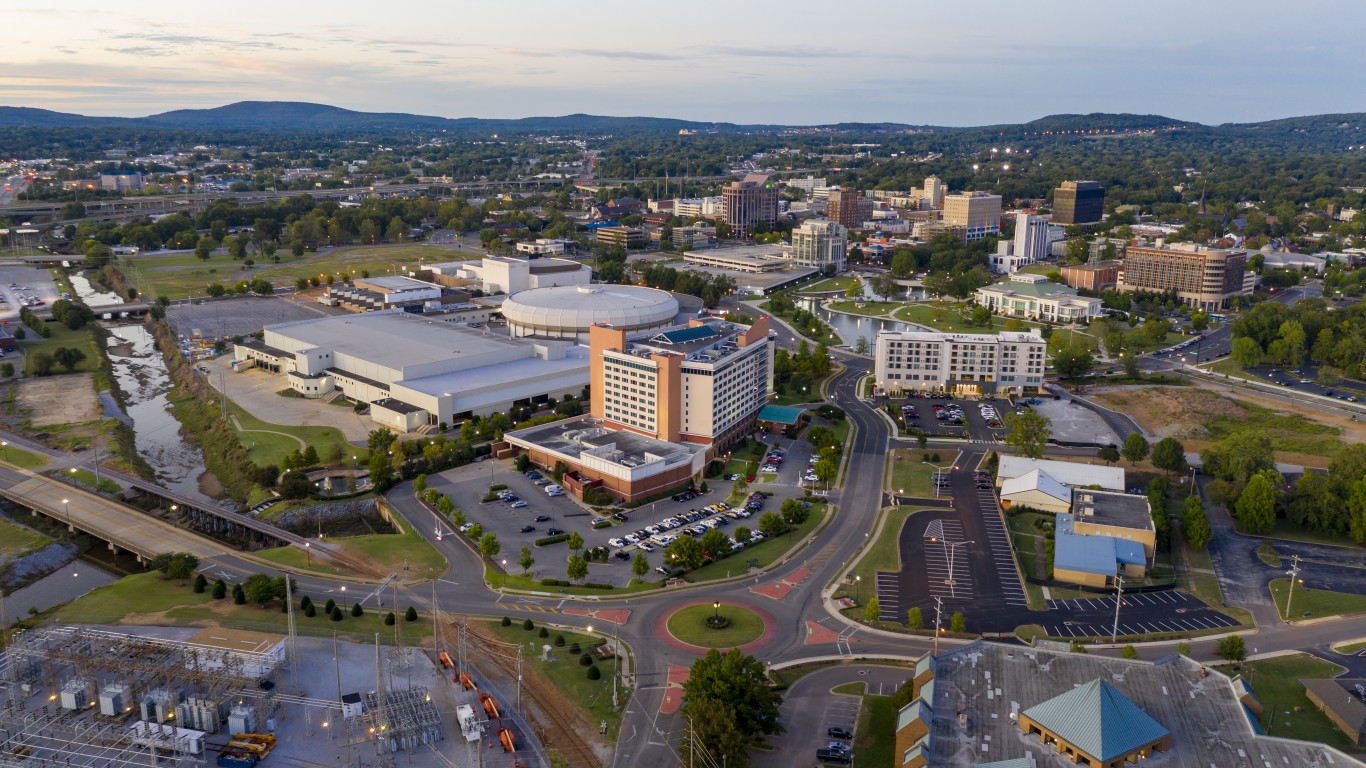
24. Huntsville, AL
> GDP growth, 2001-2020: 76.86%
> Real GDP, 2020: $27.02 billion – #96 largest
> Industry with largest growth, 2001-2020: Information (219.17%)
> Largest growth industry GDP, 2020: $0.71 billion (2.64% of metro GDP)
> Unemployment rate, 2019: 5.21% – #189 lowest
> Population, 2019: 457,003 – #118 of 383 metros
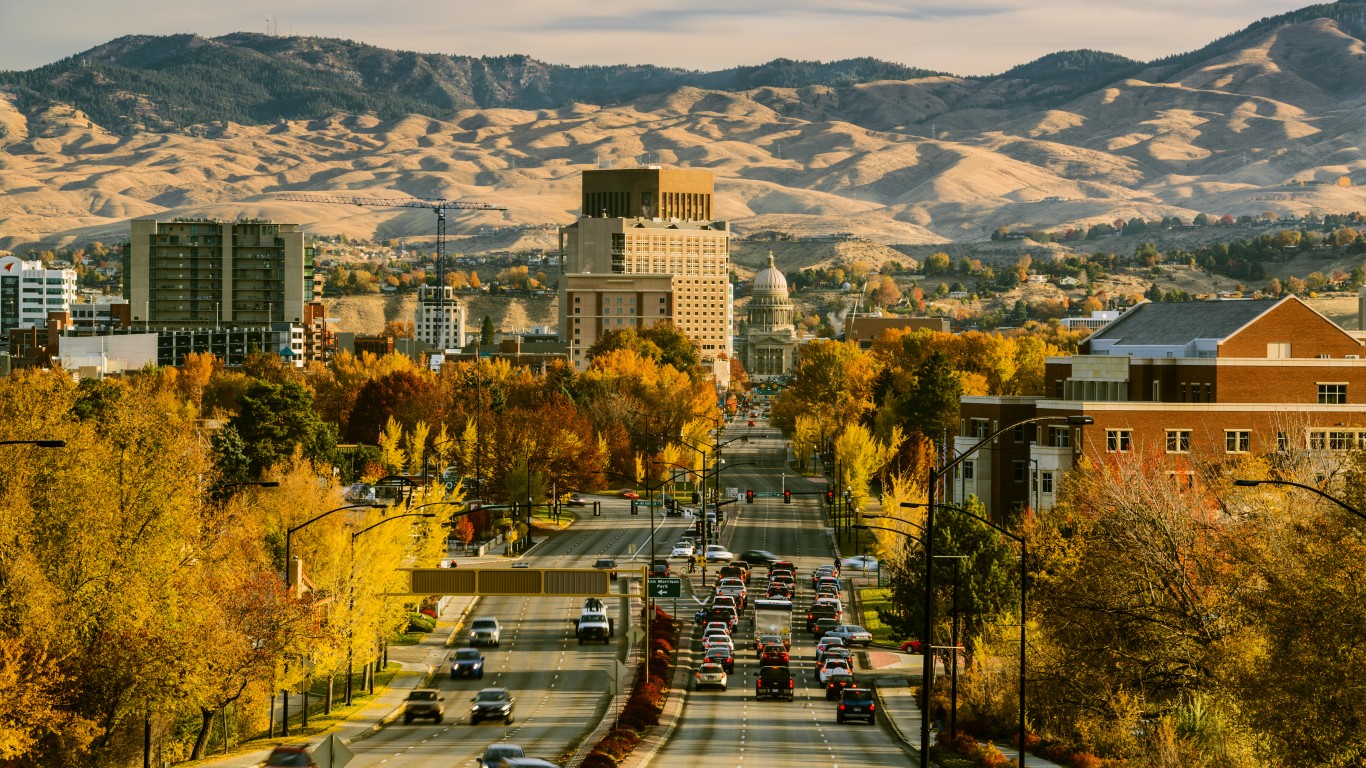
23. Boise City, ID
> GDP growth, 2001-2020: 77.52%
> Real GDP, 2020: $32.86 billion – #84 largest
> Industry with largest growth, 2001-2020: Manufacturing (150.78%)
> Largest growth industry GDP, 2020: $4.19 billion (12.74% of metro GDP)
> Unemployment rate, 2019: 4.35% – #103 lowest
> Population, 2019: 710,743 – #80 of 383 metros
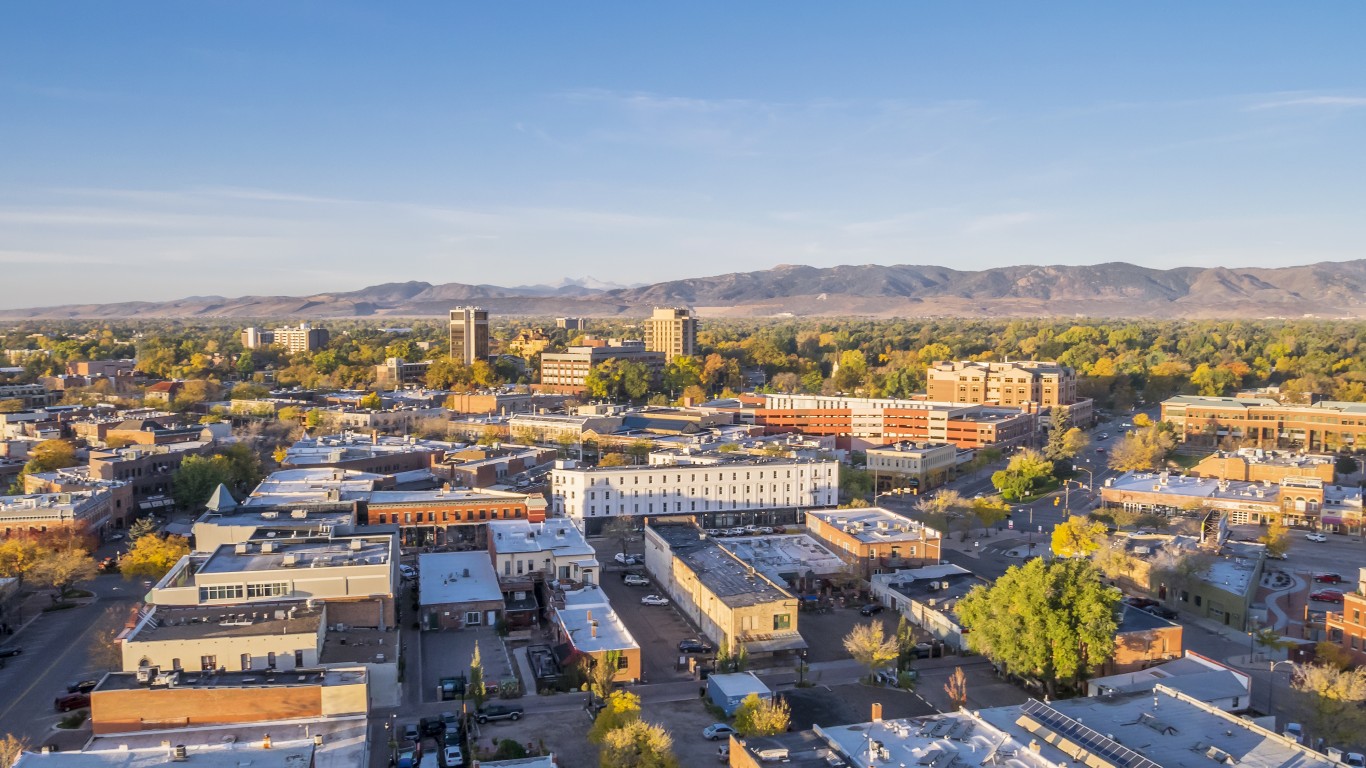
22. Fort Collins, CO
> GDP growth, 2001-2020: 78.18%
> Real GDP, 2020: $18.62 billion – #130 largest
> Industry with largest growth, 2001-2020: Agriculture, forestry, fishing and hunting (2,479.61%)
> Largest growth industry GDP, 2020: $0.11 billion (0.61% of metro GDP)
> Unemployment rate, 2019: 4.65% – #130 lowest
> Population, 2019: 344,786 – #151 of 383 metros
[in-text-ad-2]
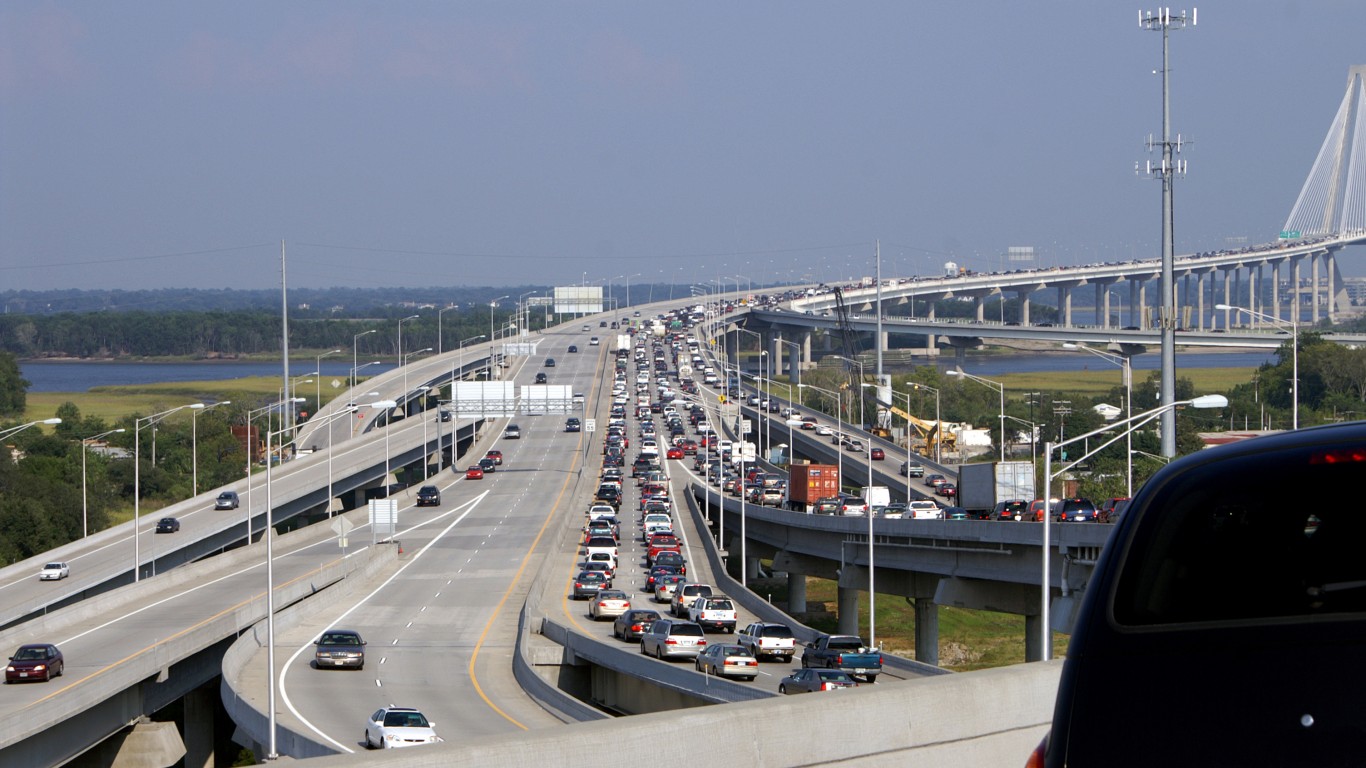
21. Charleston-North Charleston, SC
> GDP growth, 2001-2020: 78.49%
> Real GDP, 2020: $38.83 billion – #70 largest
> Industry with largest growth, 2001-2020: Information (424.42%)
> Largest growth industry GDP, 2020: $1.71 billion (4.39% of metro GDP)
> Unemployment rate, 2019: 4.12% – #76 lowest
> Population, 2019: 774,508 – #74 of 383 metros

20. Idaho Falls, ID
> GDP growth, 2001-2020: 79.12%
> Real GDP, 2020: $7.46 billion – #147 smallest
> Industry with largest growth, 2001-2020: Retail trade (204.15%)
> Largest growth industry GDP, 2020: $1.15 billion (15.36% of metro GDP)
> Unemployment rate, 2019: 3.65% – #42 lowest
> Population, 2019: 145,507 – #285 of 383 metros
[in-text-ad]
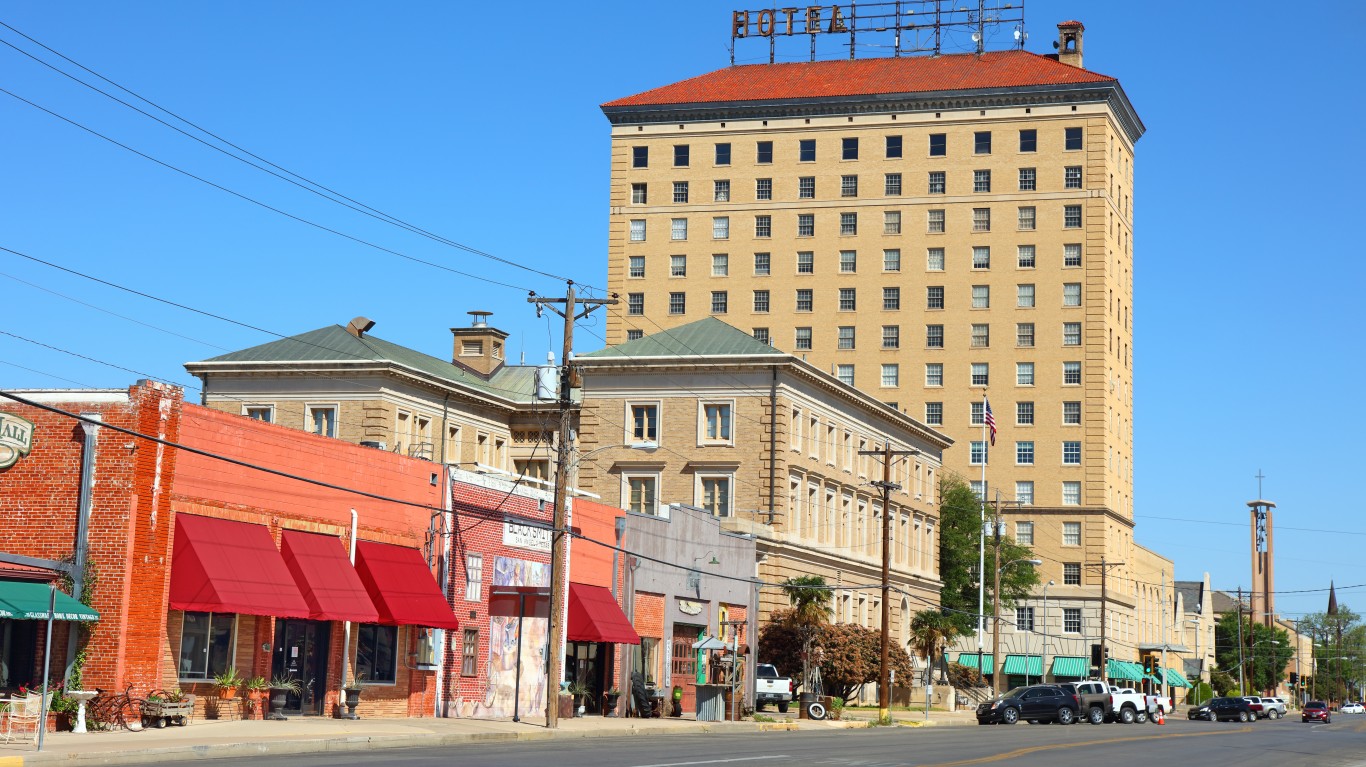
19. San Angelo, TX
> GDP growth, 2001-2020: 81.78%
> Real GDP, 2020: $7.91 billion – #153 smallest
> Industry with largest growth, 2001-2020: Utilities (1,117.97%)
> Largest growth industry GDP, 2020: $0.23 billion (2.93% of metro GDP)
> Unemployment rate, 2019: 3.74% – #48 lowest
> Population, 2019: 120,837 – #327 of 383 metros
18. Elkhart-Goshen, IN
> GDP growth, 2001-2020: 82.97%
> Real GDP, 2020: $14.26 billion – #160 largest
> Industry with largest growth, 2001-2020: Management of companies and enterprises (366.36%)
> Largest growth industry GDP, 2020: $0.67 billion (4.67% of metro GDP)
> Unemployment rate, 2019: 4.50% – #118 lowest
> Population, 2019: 204,558 – #219 of 383 metros
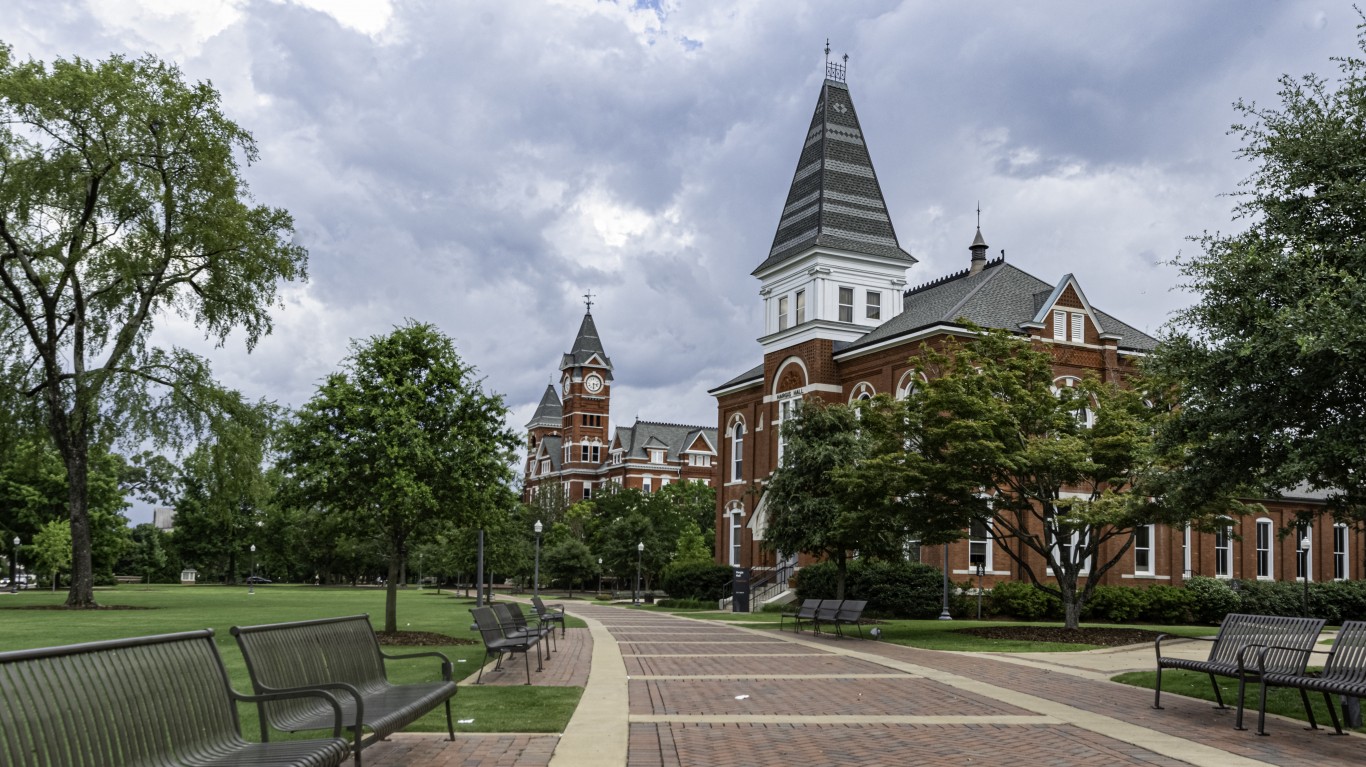
17. Auburn-Opelika, AL
> GDP growth, 2001-2020: 88.20%
> Real GDP, 2020: $5.57 billion – #82 smallest
> Industry with largest growth, 2001-2020: Utilities (1,596.55%)
> Largest growth industry GDP, 2020: $0.41 billion (7.30% of metro GDP)
> Unemployment rate, 2019: 5.13% – #181 lowest
> Population, 2019: 161,152 – #261 of 383 metros
[in-text-ad-2]
16. Fayetteville-Springdale-Rogers, AR
> GDP growth, 2001-2020: 88.60%
> Real GDP, 2020: $25.22 billion – #106 largest
> Industry with largest growth, 2001-2020: Professional and business services (190.18%)
> Largest growth industry GDP, 2020: $6.61 billion (26.19% of metro GDP)
> Unemployment rate, 2019: 3.54% – #32 lowest
> Population, 2019: 514,259 – #108 of 383 metros

15. Madera, CA
> GDP growth, 2001-2020: 89.33%
> Real GDP, 2020: $6.24 billion – #110 smallest
> Industry with largest growth, 2001-2020: Agriculture, forestry, fishing and hunting (999.90%)
> Largest growth industry GDP, 2020: $2.24 billion (35.94% of metro GDP)
> Unemployment rate, 2019: 8.69% – #14 highest
> Population, 2019: 155,433 – #265 of 383 metros
[in-text-ad]
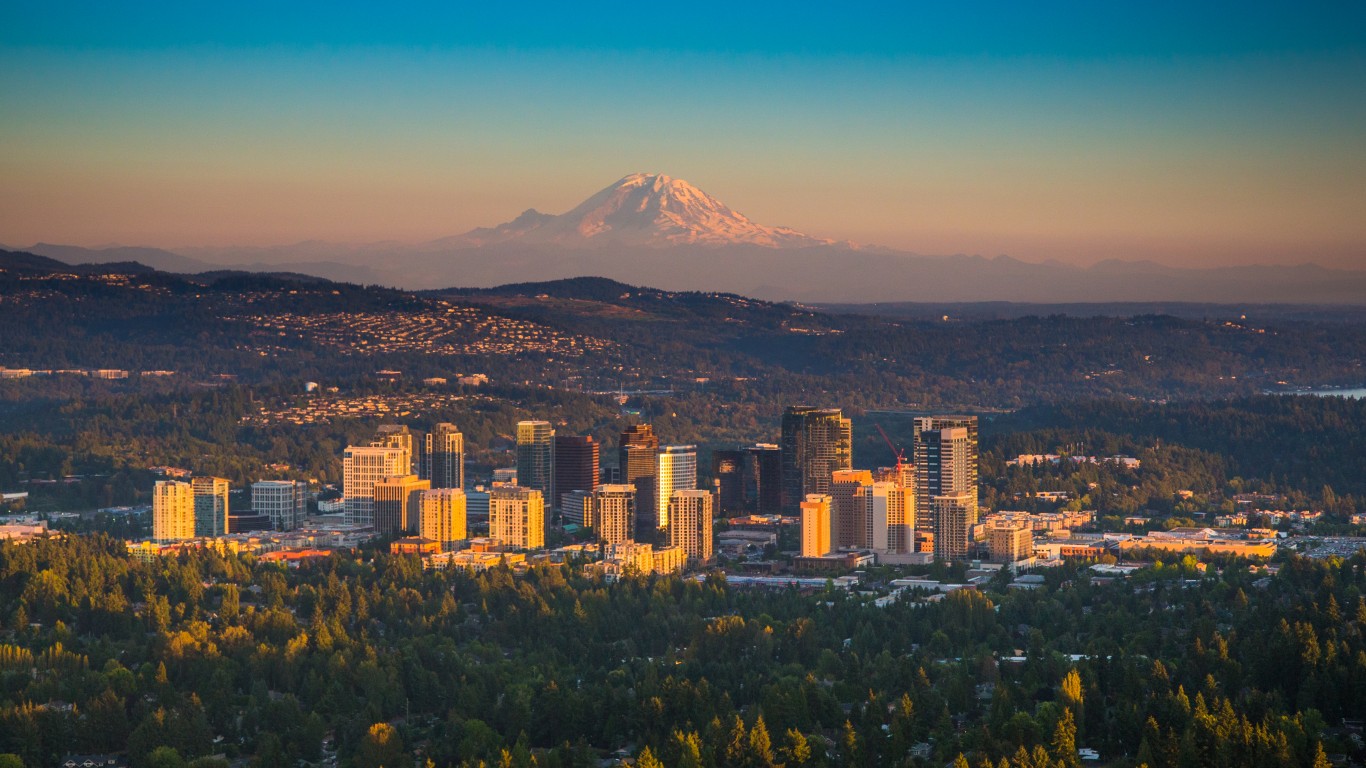
14. Seattle-Tacoma-Bellevue, WA
> GDP growth, 2001-2020: 91.22%
> Real GDP, 2020: $378.15 billion – #10 largest
> Industry with largest growth, 2001-2020: Information (408.74%)
> Largest growth industry GDP, 2020: $101.99 billion (26.97% of metro GDP)
> Unemployment rate, 2019: 4.35% – #105 lowest
> Population, 2019: 3,871,323 – #15 of 383 metros
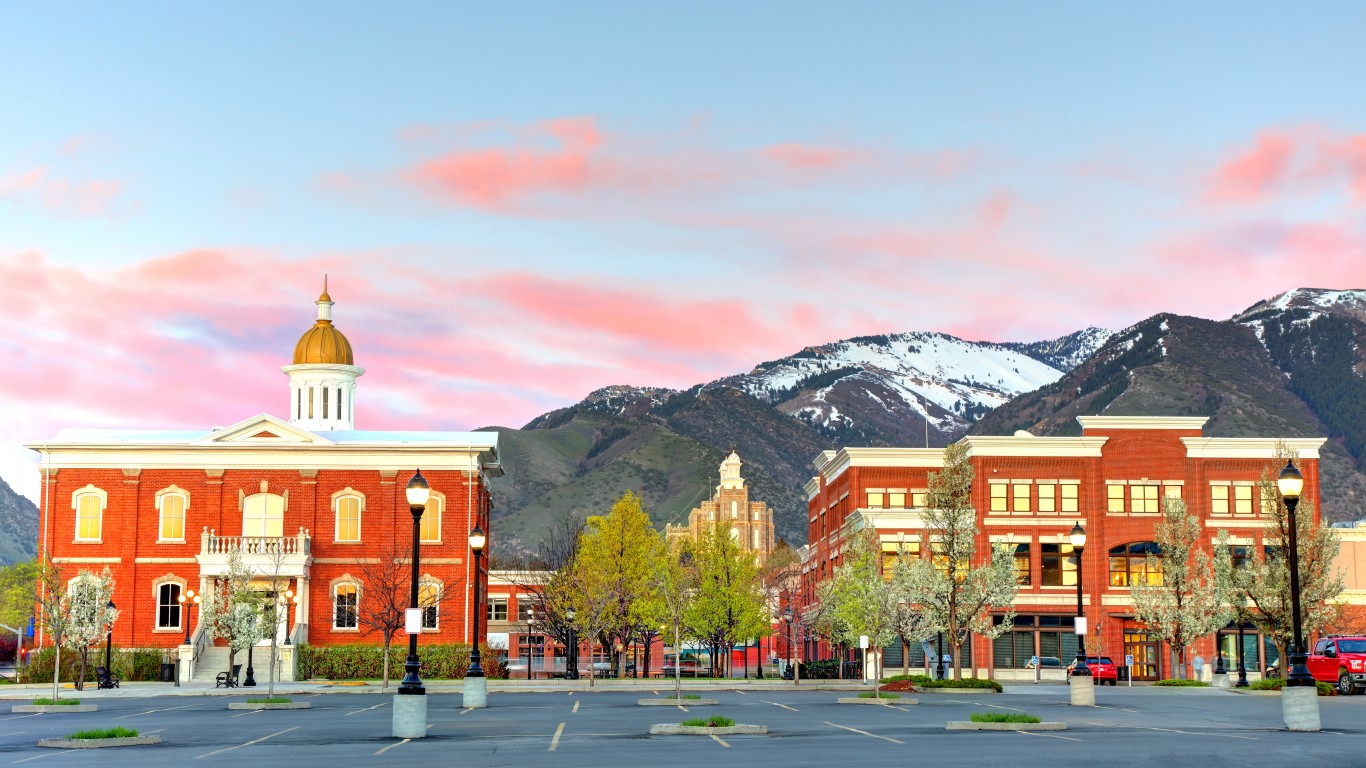
13. Logan, UT-ID
> GDP growth, 2001-2020: 93.21%
> Real GDP, 2020: $5.69 billion – #92 smallest
> Industry with largest growth, 2001-2020: Wholesale trade (285.14%)
> Largest growth industry GDP, 2020: $0.22 billion (3.93% of metro GDP)
> Unemployment rate, 2019: 2.49% – #2 lowest
> Population, 2019: 137,629 – #298 of 383 metros
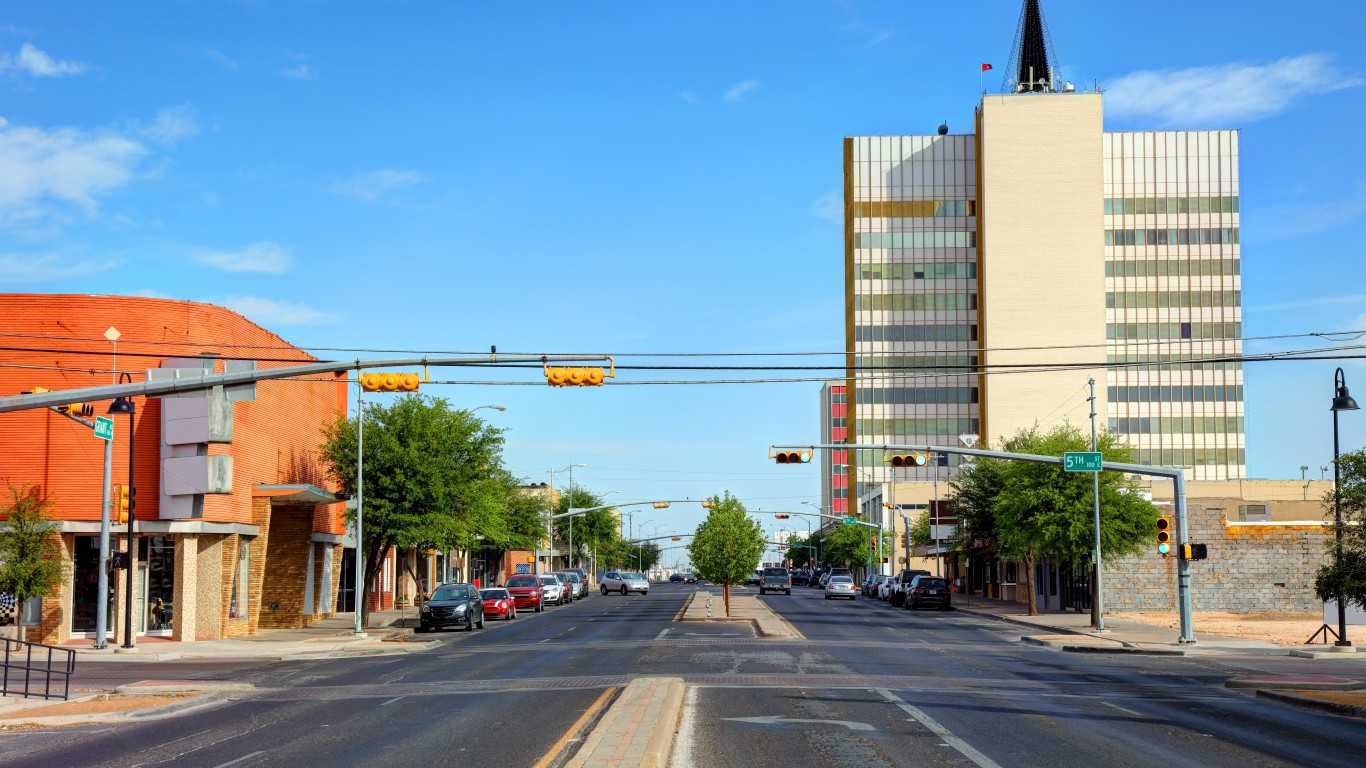
12. Odessa, TX
> GDP growth, 2001-2020: 97.73%
> Real GDP, 2020: $11.19 billion – #191 largest
> Industry with largest growth, 2001-2020: Utilities (382.98%)
> Largest growth industry GDP, 2020: $0.40 billion (3.58% of metro GDP)
> Unemployment rate, 2019: 6.07% – #98 highest
> Population, 2019: 160,579 – #262 of 383 metros
[in-text-ad-2]
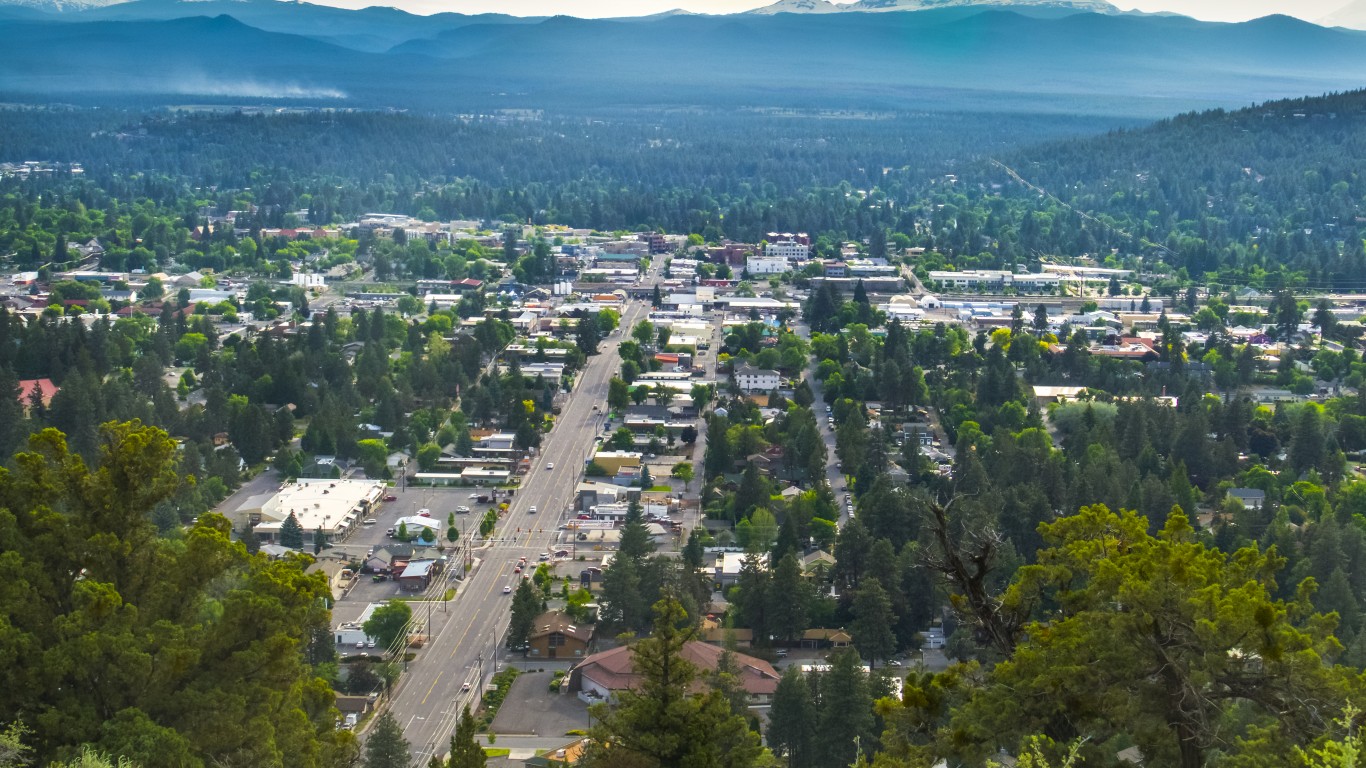
11. Bend, OR
> GDP growth, 2001-2020: 98.83%
> Real GDP, 2020: $9.13 billion – #168 smallest
> Industry with largest growth, 2001-2020: Nondurable goods manufacturing (317.55%)
> Largest growth industry GDP, 2020: $0.21 billion (2.31% of metro GDP)
> Unemployment rate, 2019: 5.39% – #174 highest
> Population, 2019: 186,251 – #228 of 383 metros
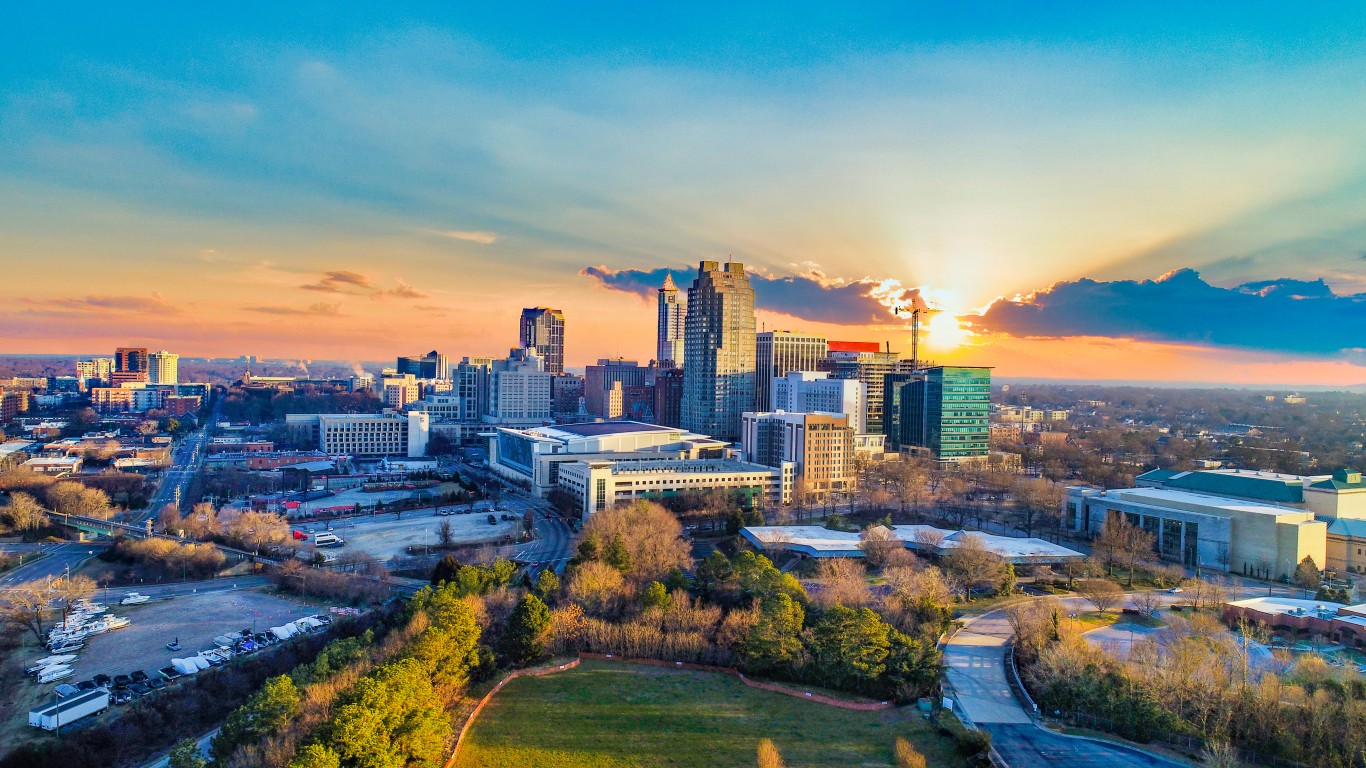
10. Raleigh-Cary, NC
> GDP growth, 2001-2020: 99.46%
> Real GDP, 2020: $83.46 billion – #40 largest
> Industry with largest growth, 2001-2020: Durable goods manufacturing (512.78%)
> Largest growth industry GDP, 2020: $7.25 billion (8.68% of metro GDP)
> Unemployment rate, 2019: 4.20% – #90 lowest
> Population, 2019: 1,332,311 – #43 of 383 metros
[in-text-ad]
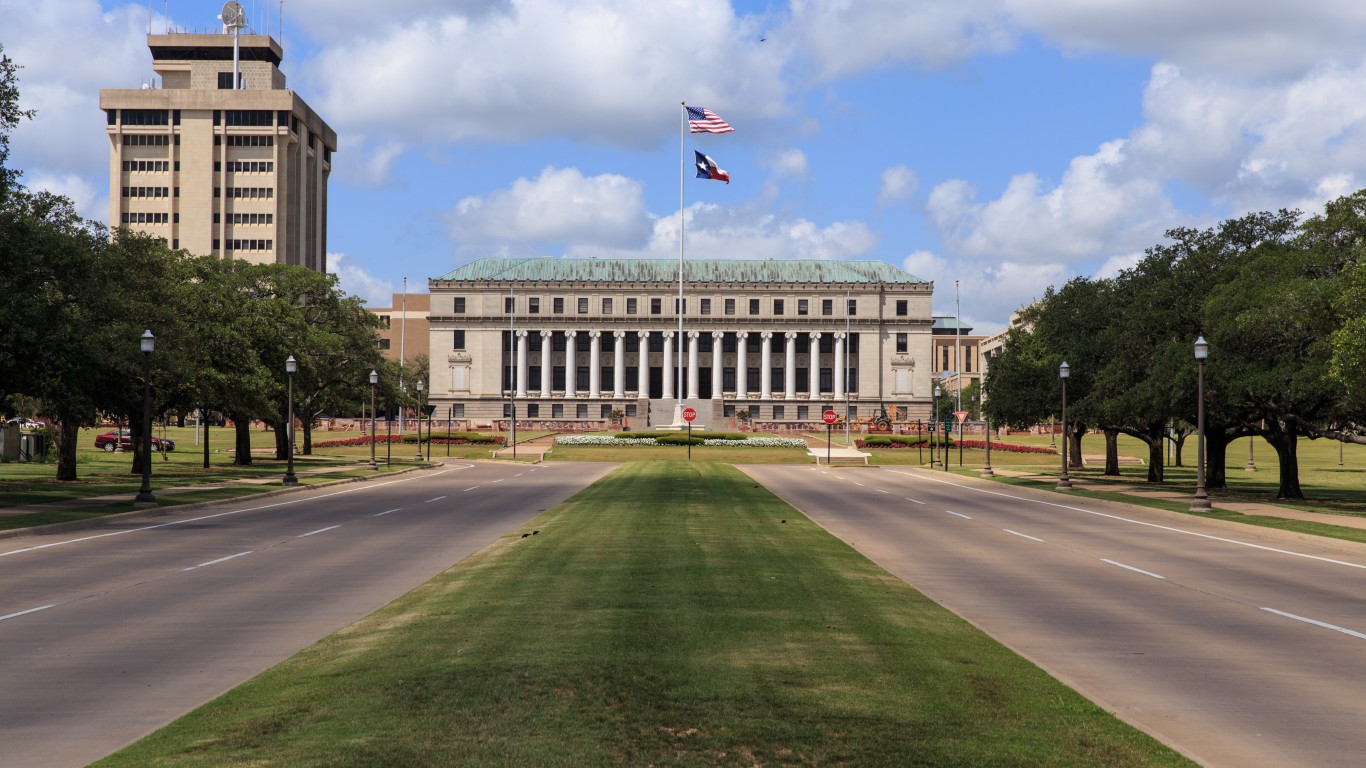
9. College Station-Bryan, TX
> GDP growth, 2001-2020: 101.48%
> Real GDP, 2020: $14.19 billion – #161 largest
> Industry with largest growth, 2001-2020: Wholesale trade (776.68%)
> Largest growth industry GDP, 2020: $1.00 billion (7.03% of metro GDP)
> Unemployment rate, 2019: 4.17% – #82 lowest
> Population, 2019: 258,029 – #188 of 383 metros
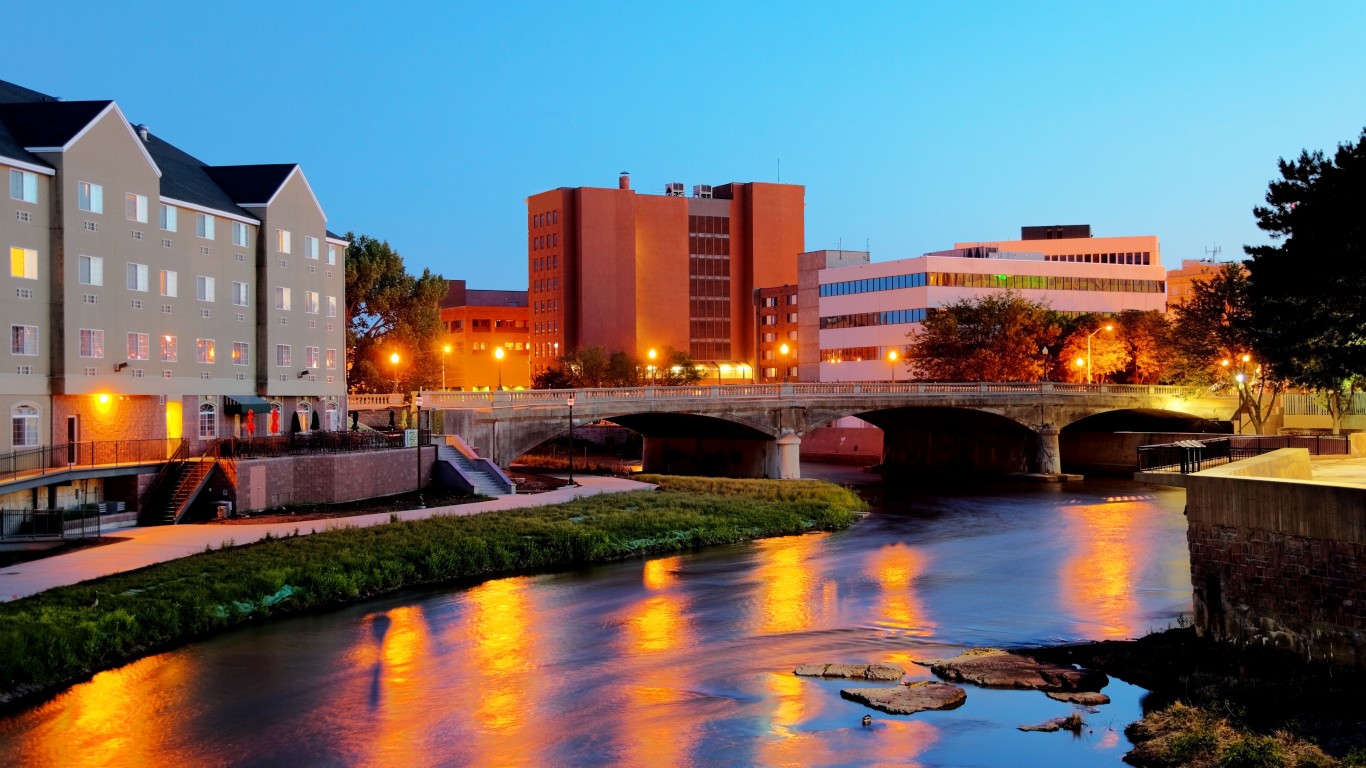
8. Sioux Falls, SD
> GDP growth, 2001-2020: 103.92%
> Real GDP, 2020: $18.07 billion – #138 largest
> Industry with largest growth, 2001-2020: Information (276.96%)
> Largest growth industry GDP, 2020: $0.90 billion (4.97% of metro GDP)
> Unemployment rate, 2019: 2.66% – #5 lowest
> Population, 2019: 259,348 – #187 of 383 metros
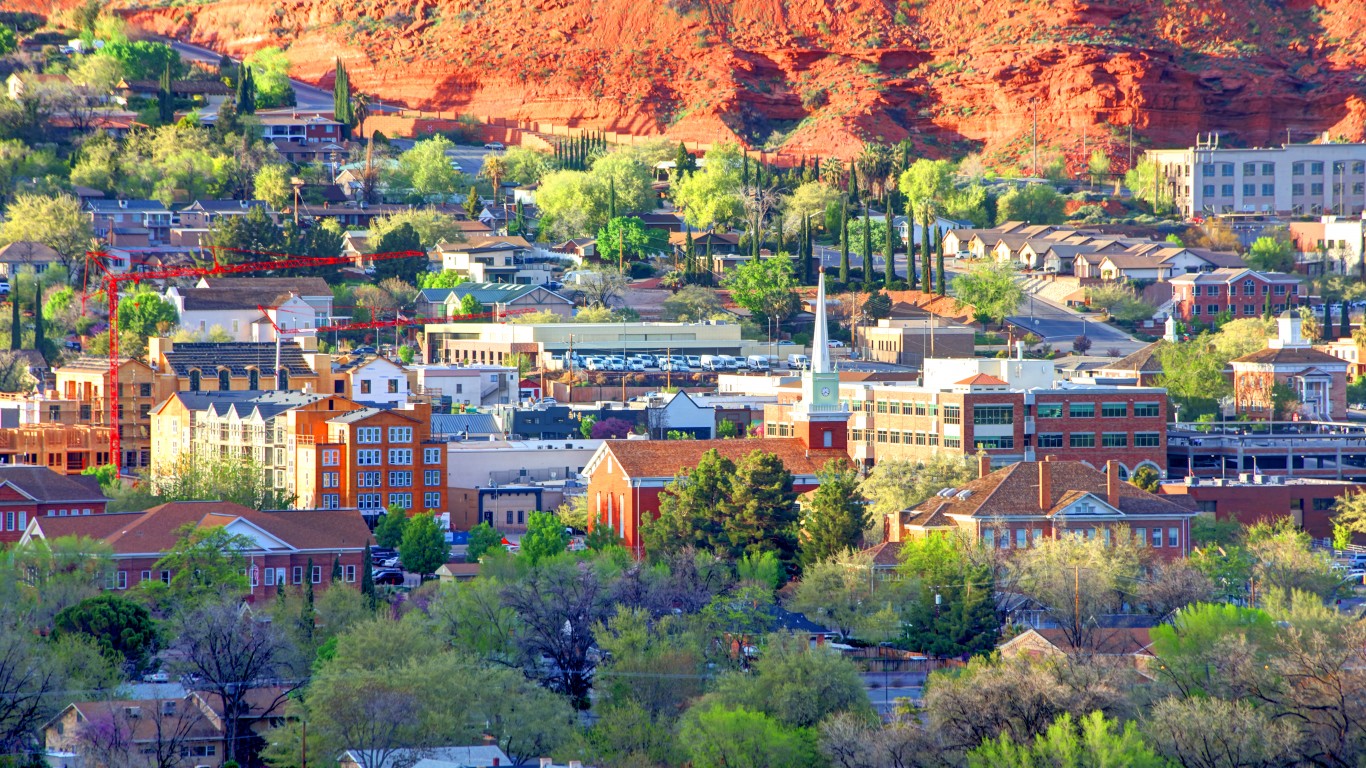
7. St. George, UT
> GDP growth, 2001-2020: 137.48%
> Real GDP, 2020: $6.11 billion – #108 smallest
> Industry with largest growth, 2001-2020: Educational services (363.02%)
> Largest growth industry GDP, 2020: $0.04 billion (0.58% of metro GDP)
> Unemployment rate, 2019: 3.51% – #30 lowest
> Population, 2019: 165,811 – #256 of 383 metros
[in-text-ad-2]
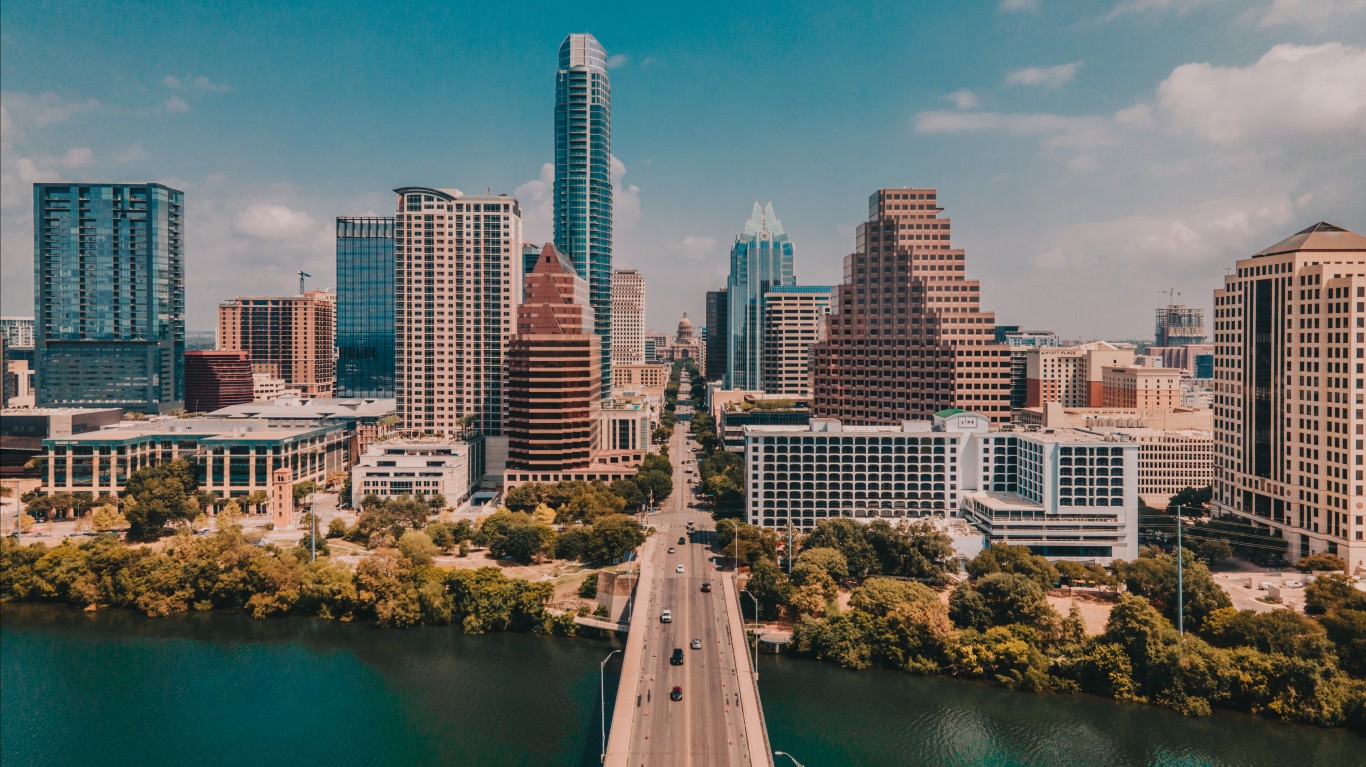
6. Austin-Round Rock-Georgetown, TX
> GDP growth, 2001-2020: 142.21%
> Real GDP, 2020: $148.88 billion – #23 largest
> Industry with largest growth, 2001-2020: Mining, quarrying, and oil and gas extraction (459.98%)
> Largest growth industry GDP, 2020: $2.39 billion (1.60% of metro GDP)
> Unemployment rate, 2019: 4.18% – #84 lowest
> Population, 2019: 2,114,441 – #31 of 383 metros
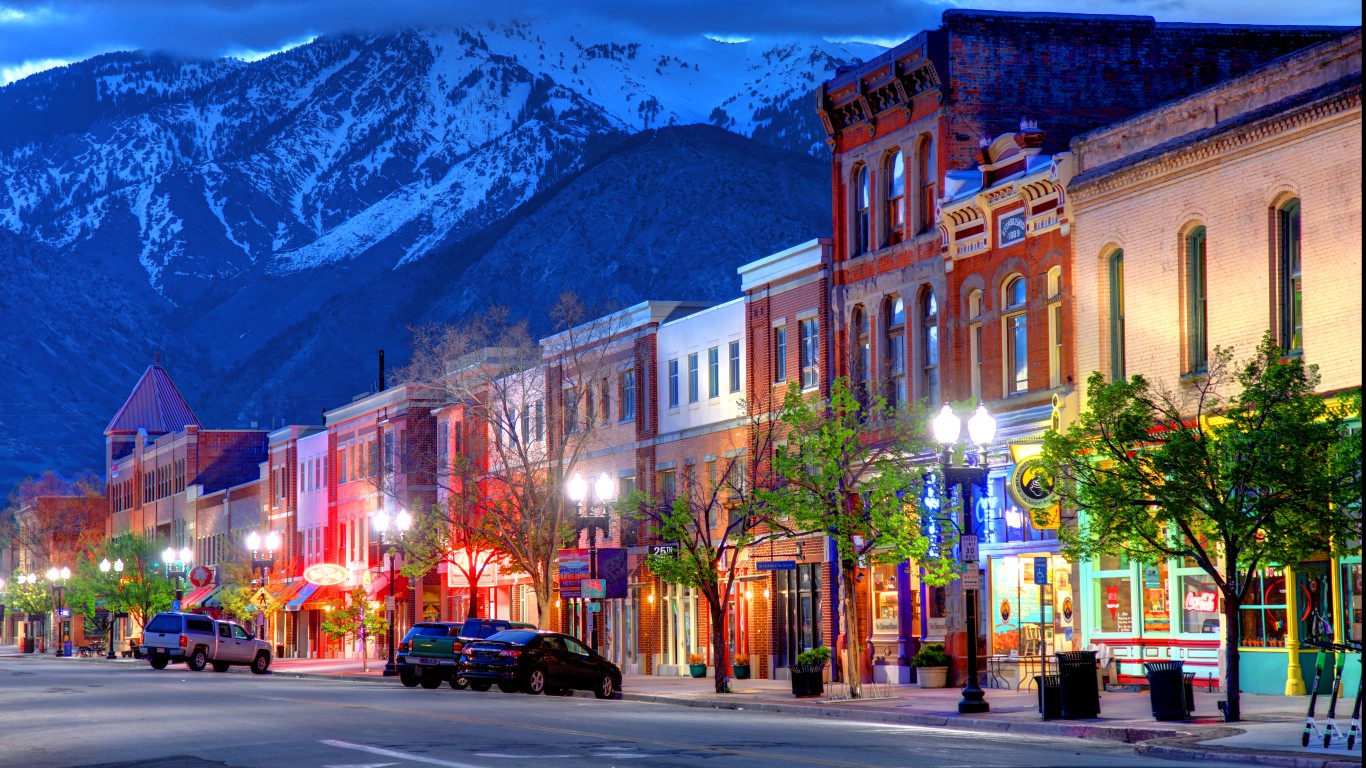
5. Provo-Orem, UT
> GDP growth, 2001-2020: 149.37%
> Real GDP, 2020: $27.89 billion – #94 largest
> Industry with largest growth, 2001-2020: Utilities (1,650.96%)
> Largest growth industry GDP, 2020: $0.44 billion (1.58% of metro GDP)
> Unemployment rate, 2019: 3.61% – #39 lowest
> Population, 2019: 616,791 – #94 of 383 metros
[in-text-ad]
4. Greeley, CO
> GDP growth, 2001-2020: 176.43%
> Real GDP, 2020: $20.96 billion – #120 largest
> Industry with largest growth, 2001-2020: Mining, quarrying, and oil and gas extraction (1,513.34%)
> Largest growth industry GDP, 2020: $8.21 billion (39.17% of metro GDP)
> Unemployment rate, 2019: 4.05% – #71 lowest
> Population, 2019: 305,345 – #164 of 383 metros
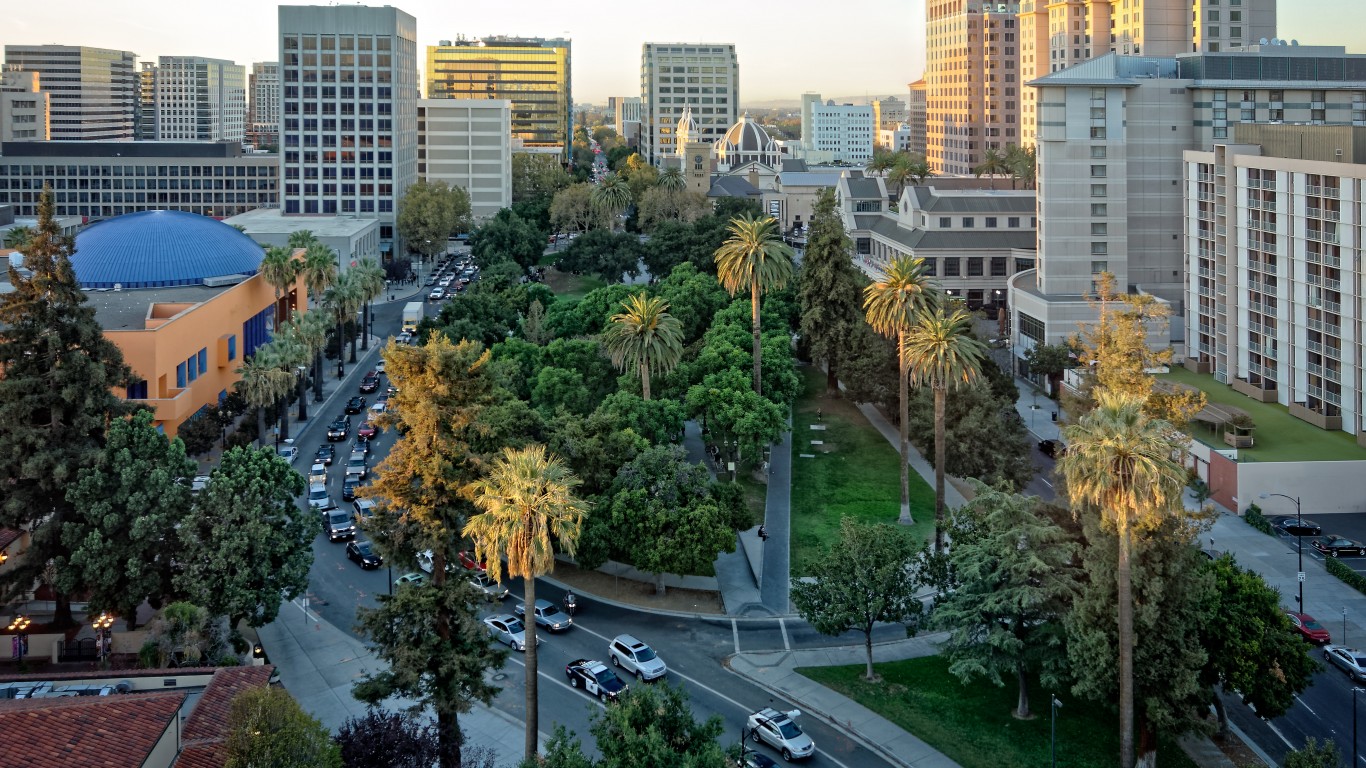
3. San Jose-Sunnyvale-Santa Clara, CA
> GDP growth, 2001-2020: 195.56%
> Real GDP, 2020: $342.17 billion – #12 largest
> Industry with largest growth, 2001-2020: Information (1,380.03%)
> Largest growth industry GDP, 2020: $106.71 billion (31.19% of metro GDP)
> Unemployment rate, 2019: 4.35% – #104 lowest
> Population, 2019: 1,987,846 – #35 of 383 metros
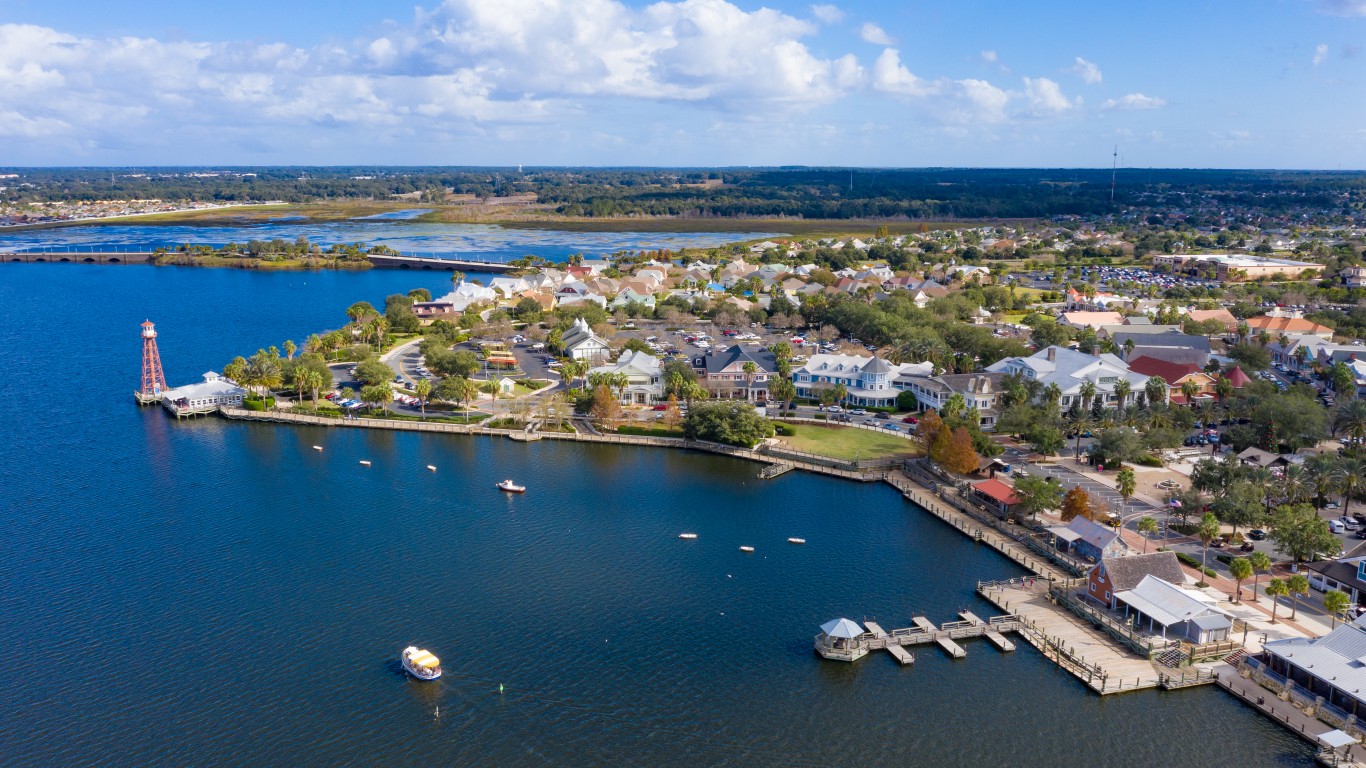
2. The Villages, FL
> GDP growth, 2001-2020: 301.87%
> Real GDP, 2020: $3.86 billion – #27 smallest
> Industry with largest growth, 2001-2020: Administrative and support and waste management and remediation services (1,457.51%)
> Largest growth industry GDP, 2020: $0.09 billion (2.42% of metro GDP)
> Unemployment rate, 2019: 3.72% – #45 lowest
> Population, 2019: 125,044 – #319 of 383 metros
[in-text-ad-2]
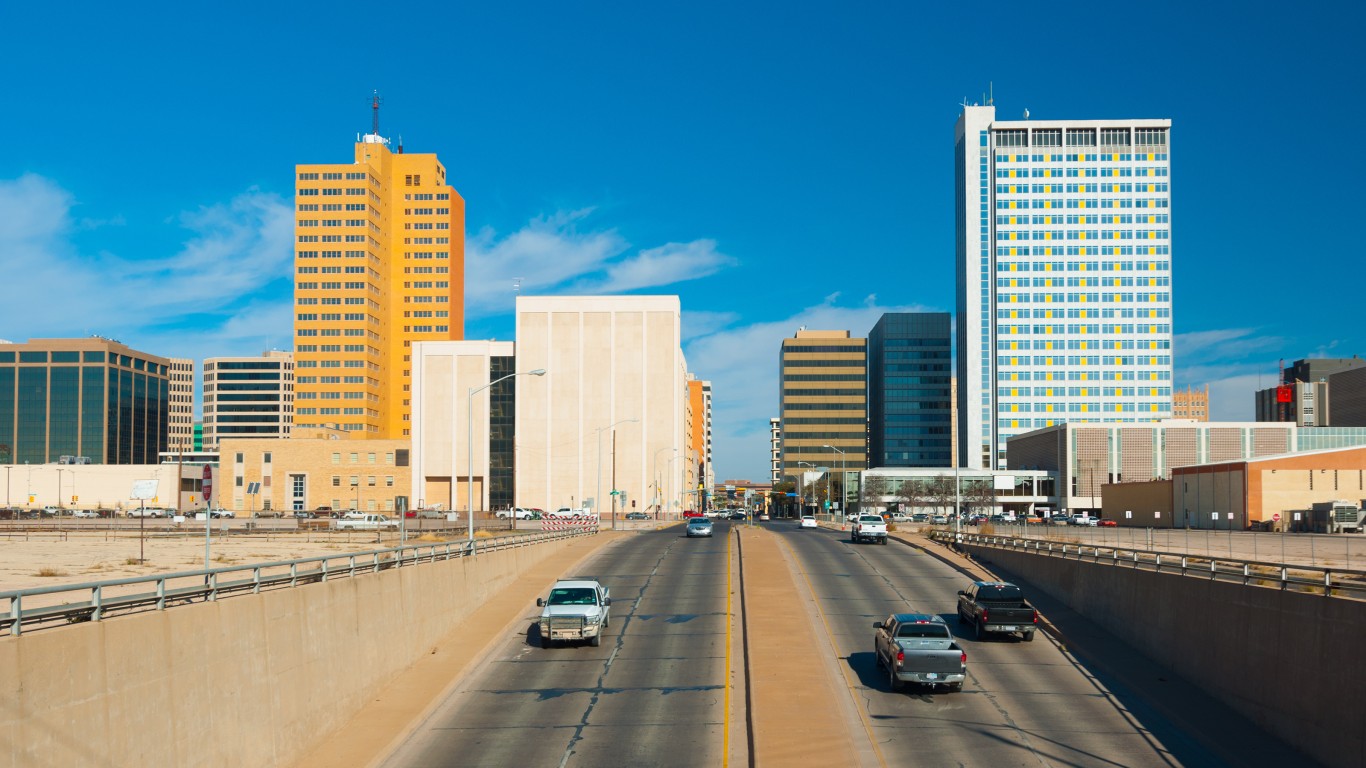
1. Midland, TX
> GDP growth, 2001-2020: 439.39%
> Real GDP, 2020: $36.85 billion – #75 largest
> Industry with largest growth, 2001-2020: Natural resources and mining (928.11%)
> Largest growth industry GDP, 2020: $31.79 billion (86.27% of metro GDP)
> Unemployment rate, 2019: 3.30% – #20 lowest
> Population, 2019: 173,816 – #241 of 383 metros
Start by taking a quick retirement quiz from SmartAsset that will match you with up to 3 financial advisors that serve your area and beyond in 5 minutes, or less.
Each advisor has been vetted by SmartAsset and is held to a fiduciary standard to act in your best interests.
Here’s how it works:
1. Answer SmartAsset advisor match quiz
2. Review your pre-screened matches at your leisure. Check out the advisors’ profiles.
3. Speak with advisors at no cost to you. Have an introductory call on the phone or introduction in person and choose whom to work with in the future
Get started right here.
Thank you for reading! Have some feedback for us?
Contact the 24/7 Wall St. editorial team.