
The U.S. reported over 248,000 new cases of coronavirus over the seven days ending March 15, bringing the total count to more than 78.7 million confirmed cases of COVID-19. There have been more than 960,000 COVID-19-related deaths — the highest death toll of any country.
New cases continue to rise at a steady rate. In the past week, there were an average of 12.0 daily new coronavirus cases per 100,000 Americans — essentially unchanged from the week prior, when there were an average of 16.9 daily new coronavirus cases per 100,000 people.
While new data shows that the risk of contracting COVID-19 is high in almost every part of the country, cities continue to be the sites of major outbreaks and superspreader events. Experts agree that the virus is more likely to spread in group settings where large numbers of people routinely have close contact with one another, such as colleges, nursing homes, bars, and restaurants. Metropolitan areas with a high degree of connectivity between different neighborhoods and a large population may be particularly at-risk.
The metro areas with the highest incidence of COVID-19 cases are distributed relatively unevenly across the United States. Of the 50 metro areas with the highest case counts per capita, 23 are in the South, 15 are in the Midwest, 11 are in the West, and one is in the Northeast.
The five metro areas with the highest number of coronavirus cases per capita are: El Centro, CA; Bismarck, ND; Hanford-Corcoran, CA; Danville, IL; and Miami-Fort Lauderdale-Pompano Beach, FL. The incidence of COVID-19 in these metro areas range from 36,392.7 cases per 100,000 to 35,267.4 cases per 100,000. For comparison, there are currently 24,401.7 cases per 100,000 Americans nationwide.
The 50 cities with the highest incidence of COVID-19 have over 7,200 more coronavirus cases per capita than the U.S. as a whole, but cases are growing at a slowing rate. There were an average of 12.2 daily new coronavirus cases per 100,000 people in the week ending March 15, a decrease from the week prior, when there were an average of 17.5 daily new coronavirus cases per 100,000 people. In one of the 50 cities with the highest COVID-19 incidence, new cases are rising at an increasing rate.
To determine the cities with the most COVID-19 cases, 24/7 Wall St. compiled and reviewed data from state and local health departments. We ranked metro areas based on the number of confirmed COVID-19 cases per 100,000 residents as of March 15. To estimate the incidence of COVID-19 at the metropolitan level, we aggregated data from the county level using boundary definitions from the U.S. Census Bureau. Population data used to adjust case and death totals came from the U.S. Census Bureau’s 2019 American Community Survey and are five-year estimates. Unemployment data is from the Bureau of Labor Statistics and is seasonally adjusted.

50. Eau Claire, WI
> Confirmed COVID-19 cases as of March 15: 48,469
> Confirmed COVID-19 cases as of March 15 per 100,000 residents: 28,953.0
> Cumulative COVID-19 deaths as of March 15: 356
> Cumulative COVID-19 deaths as of March 15 per 100,000 residents: 212.7
> Population: 167,406

49. Kennewick-Richland, WA
> Confirmed COVID-19 cases as of March 15: 84,025
> Confirmed COVID-19 cases as of March 15 per 100,000 residents: 29,021.5
> Cumulative COVID-19 deaths as of March 15: 671
> Cumulative COVID-19 deaths as of March 15 per 100,000 residents: 231.8
> Population: 289,527

48. Phoenix-Mesa-Chandler, AZ
> Confirmed COVID-19 cases as of March 15: 1,382,526
> Confirmed COVID-19 cases as of March 15 per 100,000 residents: 29,034.9
> Cumulative COVID-19 deaths as of March 15: 17,404
> Cumulative COVID-19 deaths as of March 15 per 100,000 residents: 365.5
> Population: 4,761,603

47. Appleton, WI
> Confirmed COVID-19 cases as of March 15: 68,458
> Confirmed COVID-19 cases as of March 15 per 100,000 residents: 29,053.4
> Cumulative COVID-19 deaths as of March 15: 494
> Cumulative COVID-19 deaths as of March 15 per 100,000 residents: 209.7
> Population: 235,628

46. Lakeland-Winter Haven, FL
> Confirmed COVID-19 cases as of March 15: 199,580
> Confirmed COVID-19 cases as of March 15 per 100,000 residents: 29,084.1
> Cumulative COVID-19 deaths as of March 15: 2,910
> Cumulative COVID-19 deaths as of March 15 per 100,000 residents: 424.1
> Population: 686,218

45. Sioux Falls, SD
> Confirmed COVID-19 cases as of March 15: 75,671
> Confirmed COVID-19 cases as of March 15 per 100,000 residents: 29,177.4
> Cumulative COVID-19 deaths as of March 15: 698
> Cumulative COVID-19 deaths as of March 15 per 100,000 residents: 269.1
> Population: 259,348

44. Champaign-Urbana, IL
> Confirmed COVID-19 cases as of March 15: 66,093
> Confirmed COVID-19 cases as of March 15 per 100,000 residents: 29,203.0
> Cumulative COVID-19 deaths as of March 15: 310
> Cumulative COVID-19 deaths as of March 15 per 100,000 residents: 137.0
> Population: 226,323

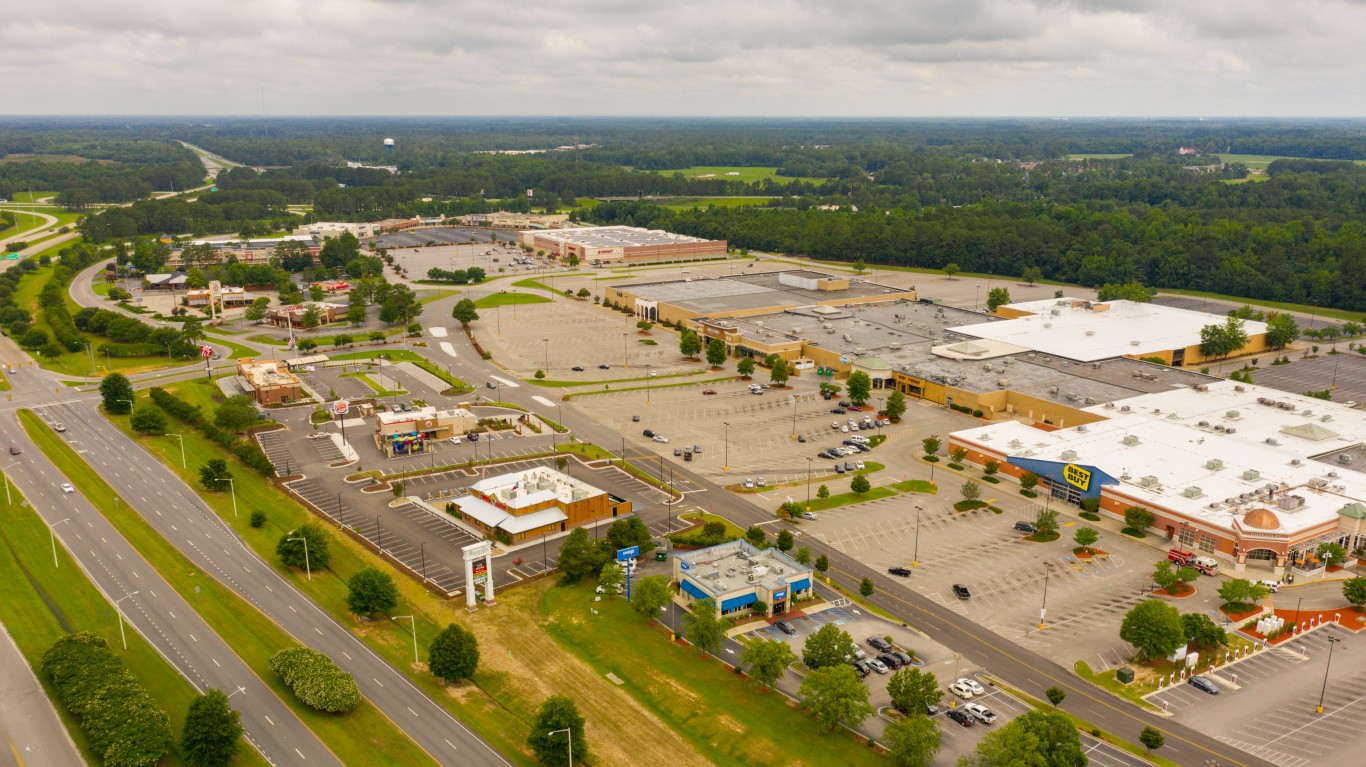
43. Greenville, NC
> Confirmed COVID-19 cases as of March 15: 52,202
> Confirmed COVID-19 cases as of March 15 per 100,000 residents: 29,255.8
> Cumulative COVID-19 deaths as of March 15: 153
> Cumulative COVID-19 deaths as of March 15 per 100,000 residents: 85.7
> Population: 178,433
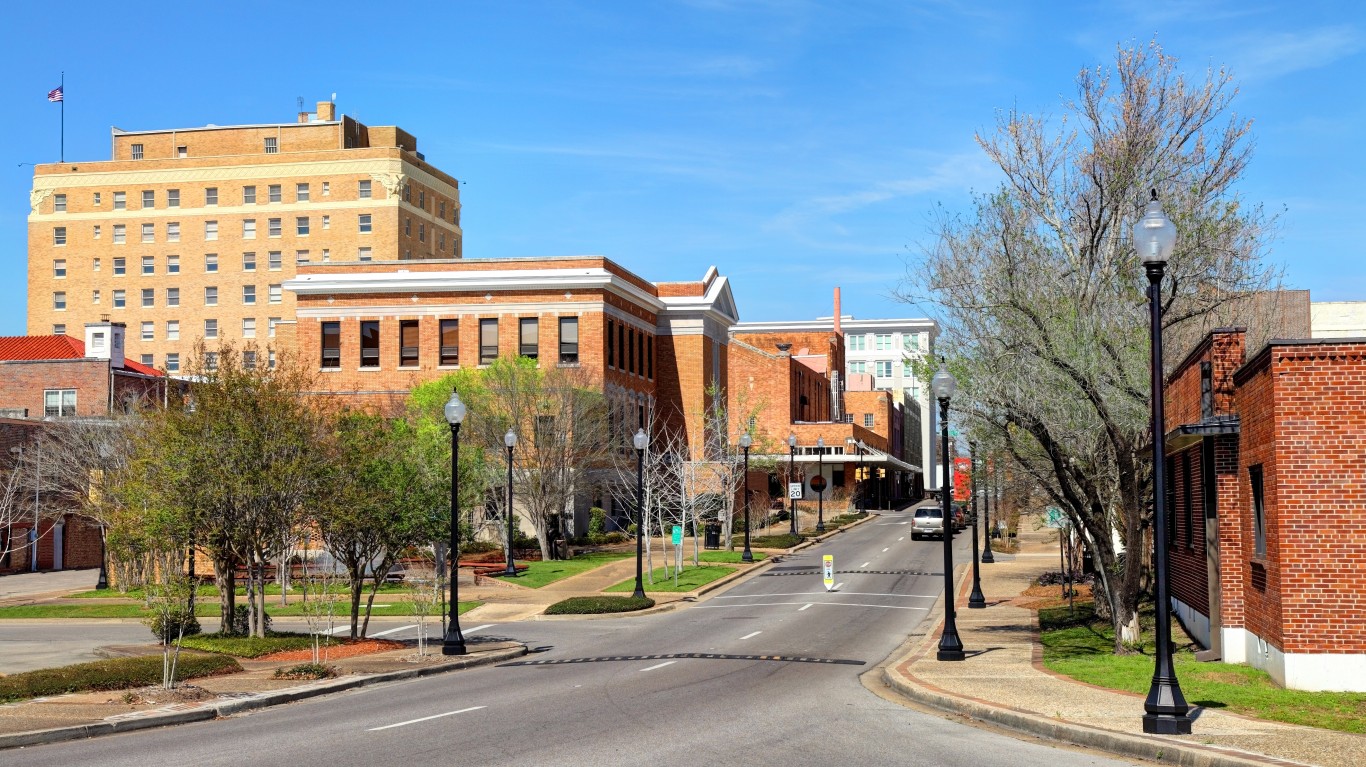
42. Hattiesburg, MS
> Confirmed COVID-19 cases as of March 15: 49,317
> Confirmed COVID-19 cases as of March 15 per 100,000 residents: 29,324.5
> Cumulative COVID-19 deaths as of March 15: 639
> Cumulative COVID-19 deaths as of March 15 per 100,000 residents: 380.0
> Population: 168,177
41. Florence, SC
> Confirmed COVID-19 cases as of March 15: 60,489
> Confirmed COVID-19 cases as of March 15 per 100,000 residents: 29,434.8
> Cumulative COVID-19 deaths as of March 15: 922
> Cumulative COVID-19 deaths as of March 15 per 100,000 residents: 448.7
> Population: 205,502

40. Tallahassee, FL
> Confirmed COVID-19 cases as of March 15: 112,890
> Confirmed COVID-19 cases as of March 15 per 100,000 residents: 29,537.1
> Cumulative COVID-19 deaths as of March 15: 1,002
> Cumulative COVID-19 deaths as of March 15 per 100,000 residents: 262.2
> Population: 382,197
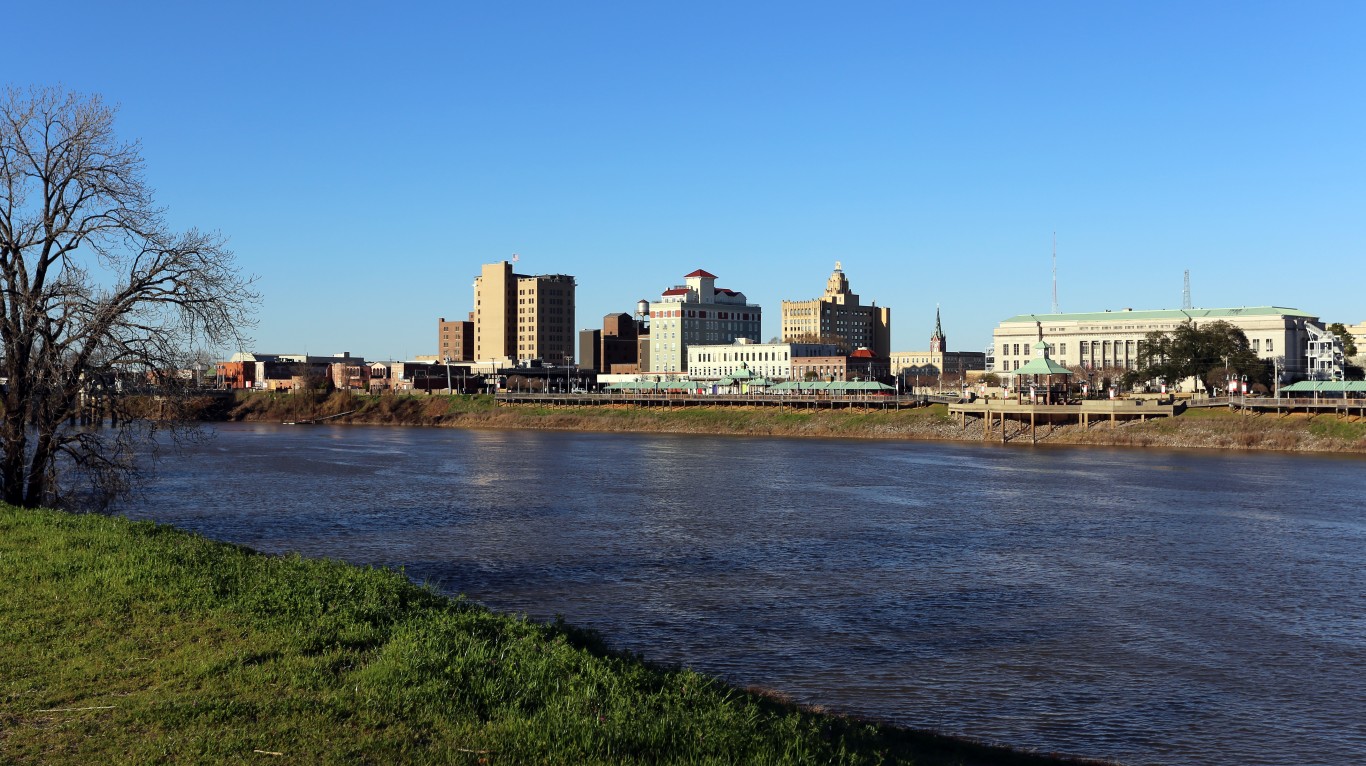
39. Monroe, LA
> Confirmed COVID-19 cases as of March 15: 60,099
> Confirmed COVID-19 cases as of March 15 per 100,000 residents: 29,538.9
> Cumulative COVID-19 deaths as of March 15: 987
> Cumulative COVID-19 deaths as of March 15 per 100,000 residents: 485.1
> Population: 203,457

38. Providence-Warwick, RI-MA
> Confirmed COVID-19 cases as of March 15: 478,147
> Confirmed COVID-19 cases as of March 15 per 100,000 residents: 29,546.8
> Cumulative COVID-19 deaths as of March 15: N/A
> Cumulative COVID-19 deaths as of March 15 per 100,000 residents: N/A
> Population: 1,618,268
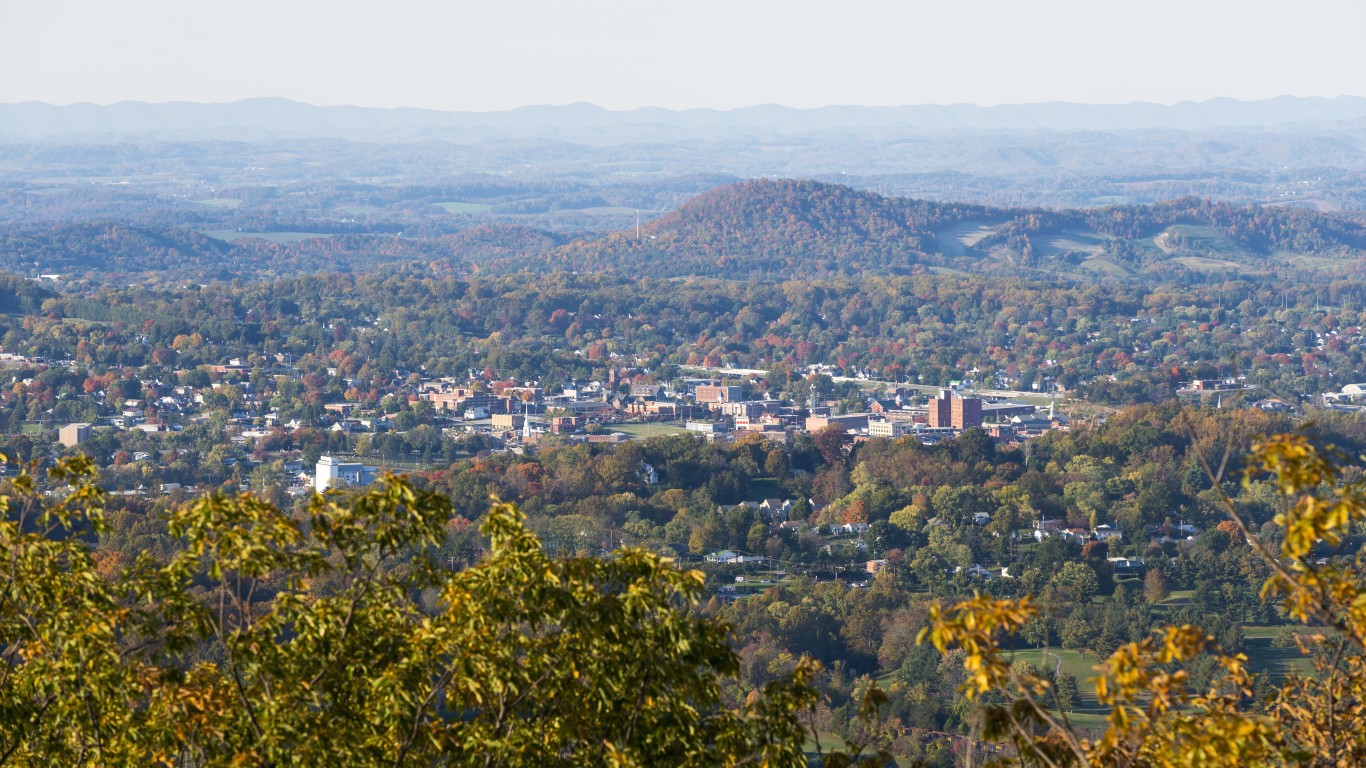
37. Johnson City, TN
> Confirmed COVID-19 cases as of March 15: 59,857
> Confirmed COVID-19 cases as of March 15 per 100,000 residents: 29,625.0
> Cumulative COVID-19 deaths as of March 15: 875
> Cumulative COVID-19 deaths as of March 15 per 100,000 residents: 433.1
> Population: 202,049
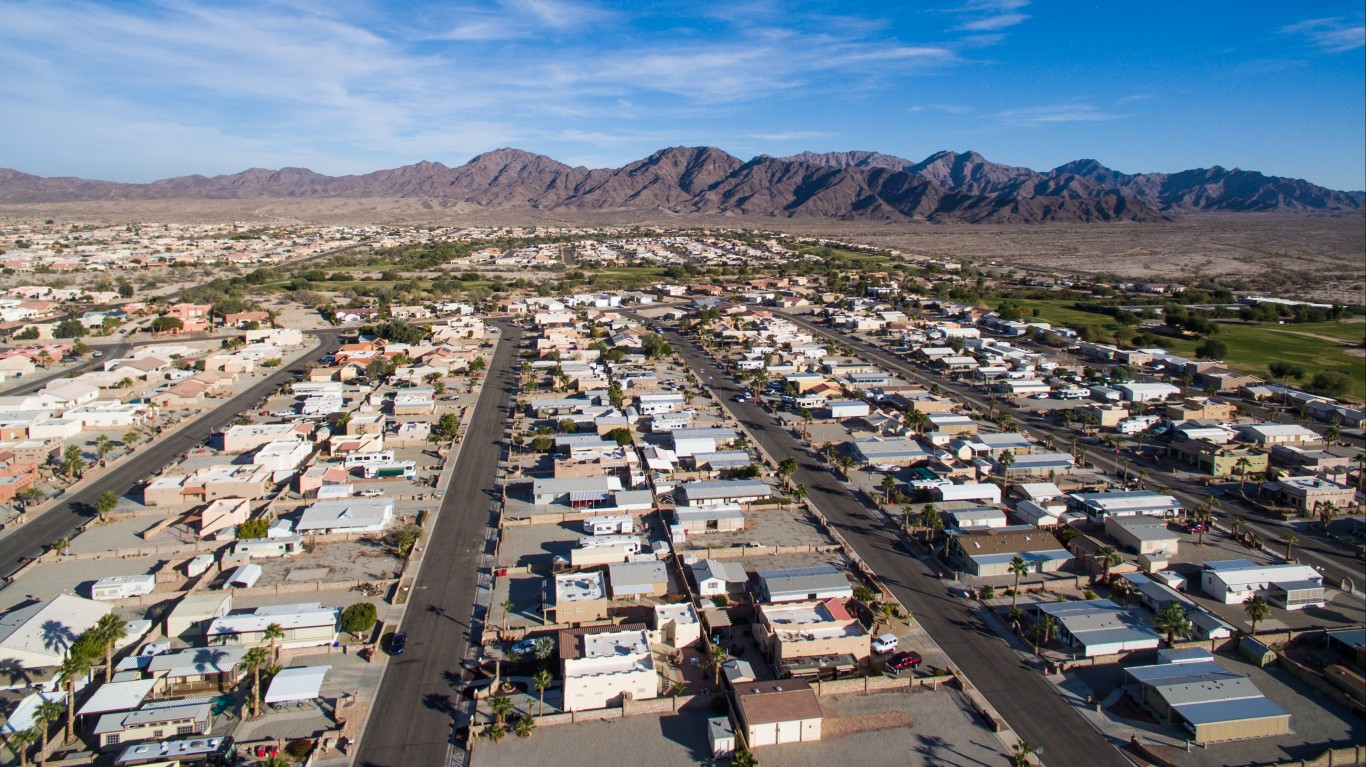
36. Yuma, AZ
> Confirmed COVID-19 cases as of March 15: 62,297
> Confirmed COVID-19 cases as of March 15 per 100,000 residents: 29,740.6
> Cumulative COVID-19 deaths as of March 15: 1,135
> Cumulative COVID-19 deaths as of March 15 per 100,000 residents: 541.8
> Population: 209,468

35. Huntington-Ashland, WV-KY-OH
> Confirmed COVID-19 cases as of March 15: 107,719
> Confirmed COVID-19 cases as of March 15 per 100,000 residents: 29,770.4
> Cumulative COVID-19 deaths as of March 15: 1,270
> Cumulative COVID-19 deaths as of March 15 per 100,000 residents: 351.0
> Population: 361,832

34. Morristown, TN
> Confirmed COVID-19 cases as of March 15: 42,048
> Confirmed COVID-19 cases as of March 15 per 100,000 residents: 29,839.9
> Cumulative COVID-19 deaths as of March 15: 703
> Cumulative COVID-19 deaths as of March 15 per 100,000 residents: 498.9
> Population: 140,912

33. Beckley, WV
> Confirmed COVID-19 cases as of March 15: 35,517
> Confirmed COVID-19 cases as of March 15 per 100,000 residents: 29,889.4
> Cumulative COVID-19 deaths as of March 15: 503
> Cumulative COVID-19 deaths as of March 15 per 100,000 residents: 423.3
> Population: 118,828

32. Salt Lake City, UT
> Confirmed COVID-19 cases as of March 15: 361,223
> Confirmed COVID-19 cases as of March 15 per 100,000 residents: 30,075.8
> Cumulative COVID-19 deaths as of March 15: 1,662
> Cumulative COVID-19 deaths as of March 15 per 100,000 residents: 138.4
> Population: 1,201,043
These are all the counties in Utah where COVID-19 is slowing (and where it’s still getting worse).

31. Oshkosh-Neenah, WI
> Confirmed COVID-19 cases as of March 15: 51,255
> Confirmed COVID-19 cases as of March 15 per 100,000 residents: 30,077.3
> Cumulative COVID-19 deaths as of March 15: 368
> Cumulative COVID-19 deaths as of March 15 per 100,000 residents: 215.9
> Population: 170,411

30. Owensboro, KY
> Confirmed COVID-19 cases as of March 15: 35,901
> Confirmed COVID-19 cases as of March 15 per 100,000 residents: 30,302.1
> Cumulative COVID-19 deaths as of March 15: 428
> Cumulative COVID-19 deaths as of March 15 per 100,000 residents: 361.3
> Population: 118,477

29. Grand Forks, ND-MN
> Confirmed COVID-19 cases as of March 15: 30,840
> Confirmed COVID-19 cases as of March 15 per 100,000 residents: 30,311.1
> Cumulative COVID-19 deaths as of March 15: 228
> Cumulative COVID-19 deaths as of March 15 per 100,000 residents: 224.1
> Population: 101,745

28. Lubbock, TX
> Confirmed COVID-19 cases as of March 15: 96,528
> Confirmed COVID-19 cases as of March 15 per 100,000 residents: 30,501.1
> Cumulative COVID-19 deaths as of March 15: 1,386
> Cumulative COVID-19 deaths as of March 15 per 100,000 residents: 438.0
> Population: 316,474
These are all the counties in Texas where COVID-19 is slowing (and where it’s still getting worse).

27. Columbia, SC
> Confirmed COVID-19 cases as of March 15: 251,475
> Confirmed COVID-19 cases as of March 15 per 100,000 residents: 30,508.5
> Cumulative COVID-19 deaths as of March 15: 2,258
> Cumulative COVID-19 deaths as of March 15 per 100,000 residents: 273.9
> Population: 824,278

26. Flagstaff, AZ
> Confirmed COVID-19 cases as of March 15: 43,213
> Confirmed COVID-19 cases as of March 15 per 100,000 residents: 30,588.1
> Cumulative COVID-19 deaths as of March 15: 456
> Cumulative COVID-19 deaths as of March 15 per 100,000 residents: 322.8
> Population: 141,274

25. Spartanburg, SC
> Confirmed COVID-19 cases as of March 15: 94,189
> Confirmed COVID-19 cases as of March 15 per 100,000 residents: 30,618.9
> Cumulative COVID-19 deaths as of March 15: 1,521
> Cumulative COVID-19 deaths as of March 15 per 100,000 residents: 494.4
> Population: 307,617

24. Great Falls, MT
> Confirmed COVID-19 cases as of March 15: 25,044
> Confirmed COVID-19 cases as of March 15 per 100,000 residents: 30,681.8
> Cumulative COVID-19 deaths as of March 15: 319
> Cumulative COVID-19 deaths as of March 15 per 100,000 residents: 390.8
> Population: 81,625
23. Kokomo, IN
> Confirmed COVID-19 cases as of March 15: 25,334
> Confirmed COVID-19 cases as of March 15 per 100,000 residents: 30,770.9
> Cumulative COVID-19 deaths as of March 15: 423
> Cumulative COVID-19 deaths as of March 15 per 100,000 residents: 513.8
> Population: 82,331

22. Carbondale-Marion, IL
> Confirmed COVID-19 cases as of March 15: 42,342
> Confirmed COVID-19 cases as of March 15 per 100,000 residents: 30,777.8
> Cumulative COVID-19 deaths as of March 15: 403
> Cumulative COVID-19 deaths as of March 15 per 100,000 residents: 292.9
> Population: 137,573

21. Cleveland, TN
> Confirmed COVID-19 cases as of March 15: 37,742
> Confirmed COVID-19 cases as of March 15 per 100,000 residents: 30,794.0
> Cumulative COVID-19 deaths as of March 15: 452
> Cumulative COVID-19 deaths as of March 15 per 100,000 residents: 368.8
> Population: 122,563

20. Fond du Lac, WI
> Confirmed COVID-19 cases as of March 15: 31,599
> Confirmed COVID-19 cases as of March 15 per 100,000 residents: 30,799.1
> Cumulative COVID-19 deaths as of March 15: 253
> Cumulative COVID-19 deaths as of March 15 per 100,000 residents: 246.6
> Population: 102,597

19. Evansville, IN-KY
> Confirmed COVID-19 cases as of March 15: 97,531
> Confirmed COVID-19 cases as of March 15 per 100,000 residents: 30,966.2
> Cumulative COVID-19 deaths as of March 15: 1,034
> Cumulative COVID-19 deaths as of March 15 per 100,000 residents: 328.3
> Population: 314,960

18. Dalton, GA
> Confirmed COVID-19 cases as of March 15: 45,219
> Confirmed COVID-19 cases as of March 15 per 100,000 residents: 31,410.6
> Cumulative COVID-19 deaths as of March 15: 593
> Cumulative COVID-19 deaths as of March 15 per 100,000 residents: 411.9
> Population: 143,961
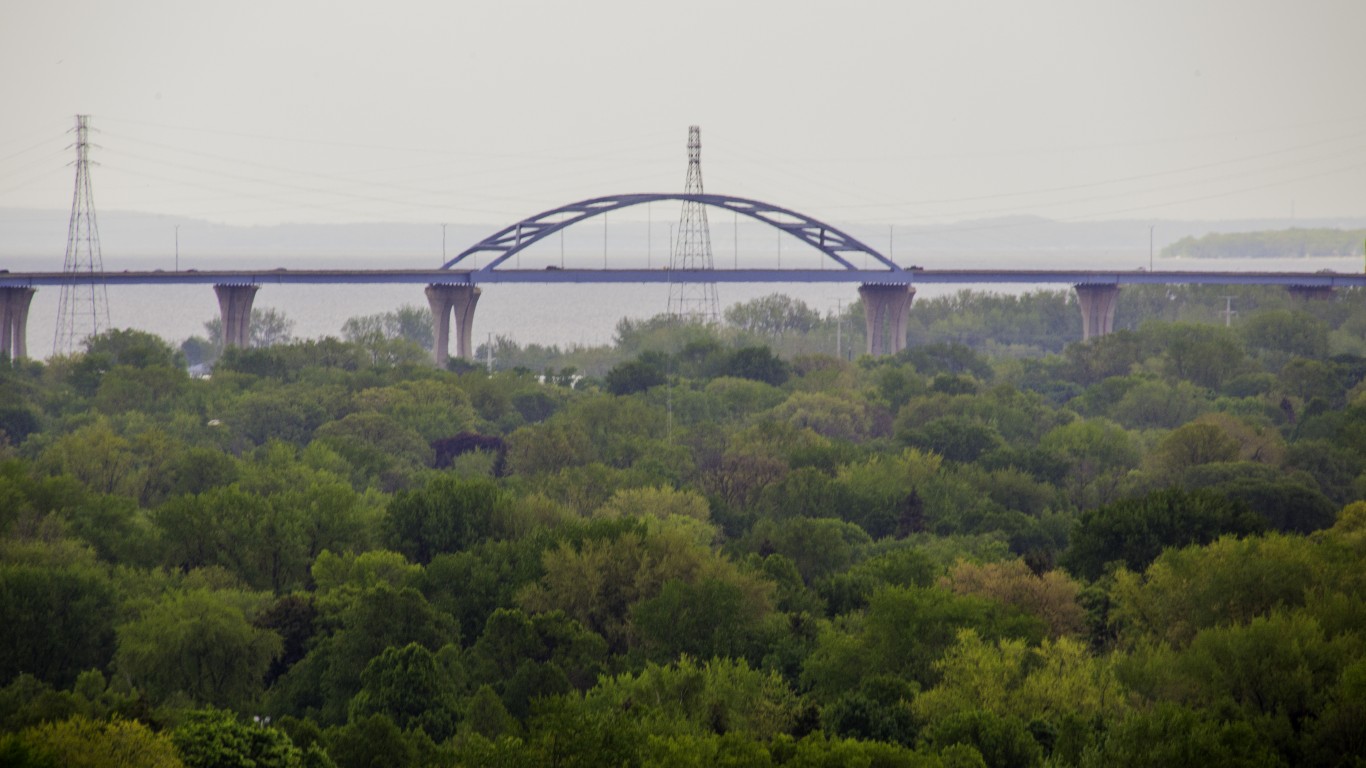
17. Green Bay, WI
> Confirmed COVID-19 cases as of March 15: 100,785
> Confirmed COVID-19 cases as of March 15 per 100,000 residents: 31,554.4
> Cumulative COVID-19 deaths as of March 15: 665
> Cumulative COVID-19 deaths as of March 15 per 100,000 residents: 208.2
> Population: 319,401
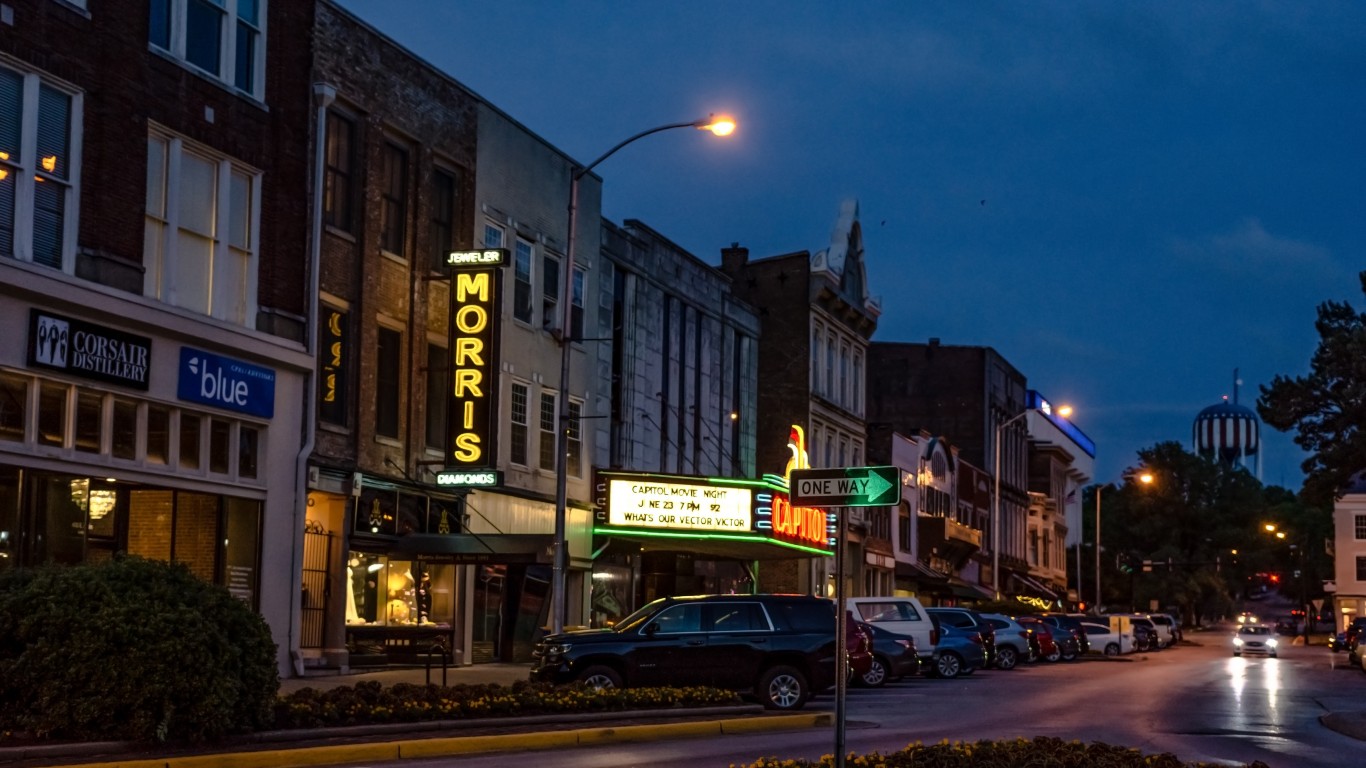
16. Bowling Green, KY
> Confirmed COVID-19 cases as of March 15: 55,507
> Confirmed COVID-19 cases as of March 15 per 100,000 residents: 31,809.5
> Cumulative COVID-19 deaths as of March 15: 523
> Cumulative COVID-19 deaths as of March 15 per 100,000 residents: 299.7
> Population: 174,498

15. Farmington, NM
> Confirmed COVID-19 cases as of March 15: 40,433
> Confirmed COVID-19 cases as of March 15 per 100,000 residents: 31,959.1
> Cumulative COVID-19 deaths as of March 15: 731
> Cumulative COVID-19 deaths as of March 15 per 100,000 residents: 577.8
> Population: 126,515

14. Jackson, TN
> Confirmed COVID-19 cases as of March 15: 57,861
> Confirmed COVID-19 cases as of March 15 per 100,000 residents: 32,425.7
> Cumulative COVID-19 deaths as of March 15: 838
> Cumulative COVID-19 deaths as of March 15 per 100,000 residents: 469.6
> Population: 178,442

13. St. Cloud, MN
> Confirmed COVID-19 cases as of March 15: 64,424
> Confirmed COVID-19 cases as of March 15 per 100,000 residents: 32,442.2
> Cumulative COVID-19 deaths as of March 15: 534
> Cumulative COVID-19 deaths as of March 15 per 100,000 residents: 268.9
> Population: 198,581

12. Fargo, ND-MN
> Confirmed COVID-19 cases as of March 15: 78,381
> Confirmed COVID-19 cases as of March 15 per 100,000 residents: 32,601.6
> Cumulative COVID-19 deaths as of March 15: 453
> Cumulative COVID-19 deaths as of March 15 per 100,000 residents: 188.4
> Population: 240,421

11. Greenville-Anderson, SC
> Confirmed COVID-19 cases as of March 15: 293,452
> Confirmed COVID-19 cases as of March 15 per 100,000 residents: 32,753.5
> Cumulative COVID-19 deaths as of March 15: 3,802
> Cumulative COVID-19 deaths as of March 15 per 100,000 residents: 424.4
> Population: 895,942

10. Provo-Orem, UT
> Confirmed COVID-19 cases as of March 15: 203,872
> Confirmed COVID-19 cases as of March 15 per 100,000 residents: 33,053.7
> Cumulative COVID-19 deaths as of March 15: 778
> Cumulative COVID-19 deaths as of March 15 per 100,000 residents: 126.1
> Population: 616,791
These are all the counties in Utah where COVID-19 is slowing (and where it’s still getting worse).

9. Laredo, TX
> Confirmed COVID-19 cases as of March 15: 92,685
> Confirmed COVID-19 cases as of March 15 per 100,000 residents: 33,885.3
> Cumulative COVID-19 deaths as of March 15: 1,020
> Cumulative COVID-19 deaths as of March 15 per 100,000 residents: 372.9
> Population: 273,526
These are all the counties in Texas where COVID-19 is slowing (and where it’s still getting worse).

8. Anchorage, AK
> Confirmed COVID-19 cases as of March 15: 135,327
> Confirmed COVID-19 cases as of March 15 per 100,000 residents: 33,925.0
> Cumulative COVID-19 deaths as of March 15: 745
> Cumulative COVID-19 deaths as of March 15 per 100,000 residents: 186.8
> Population: 398,900
These are all the counties in Alaska where COVID-19 is slowing (and where it’s still getting worse).

7. Jonesboro, AR
> Confirmed COVID-19 cases as of March 15: 44,924
> Confirmed COVID-19 cases as of March 15 per 100,000 residents: 34,230.2
> Cumulative COVID-19 deaths as of March 15: 447
> Cumulative COVID-19 deaths as of March 15 per 100,000 residents: 340.6
> Population: 131,241

6. San Angelo, TX
> Confirmed COVID-19 cases as of March 15: 40,869
> Confirmed COVID-19 cases as of March 15 per 100,000 residents: 34,638.9
> Cumulative COVID-19 deaths as of March 15: 458
> Cumulative COVID-19 deaths as of March 15 per 100,000 residents: 388.2
> Population: 117,986
These are all the counties in Texas where COVID-19 is slowing (and where it’s still getting worse).

5. Miami-Fort Lauderdale-Pompano Beach, FL
> Confirmed COVID-19 cases as of March 15: 2,148,019
> Confirmed COVID-19 cases as of March 15 per 100,000 residents: 35,267.4
> Cumulative COVID-19 deaths as of March 15: 21,300
> Cumulative COVID-19 deaths as of March 15 per 100,000 residents: 349.7
> Population: 6,090,660

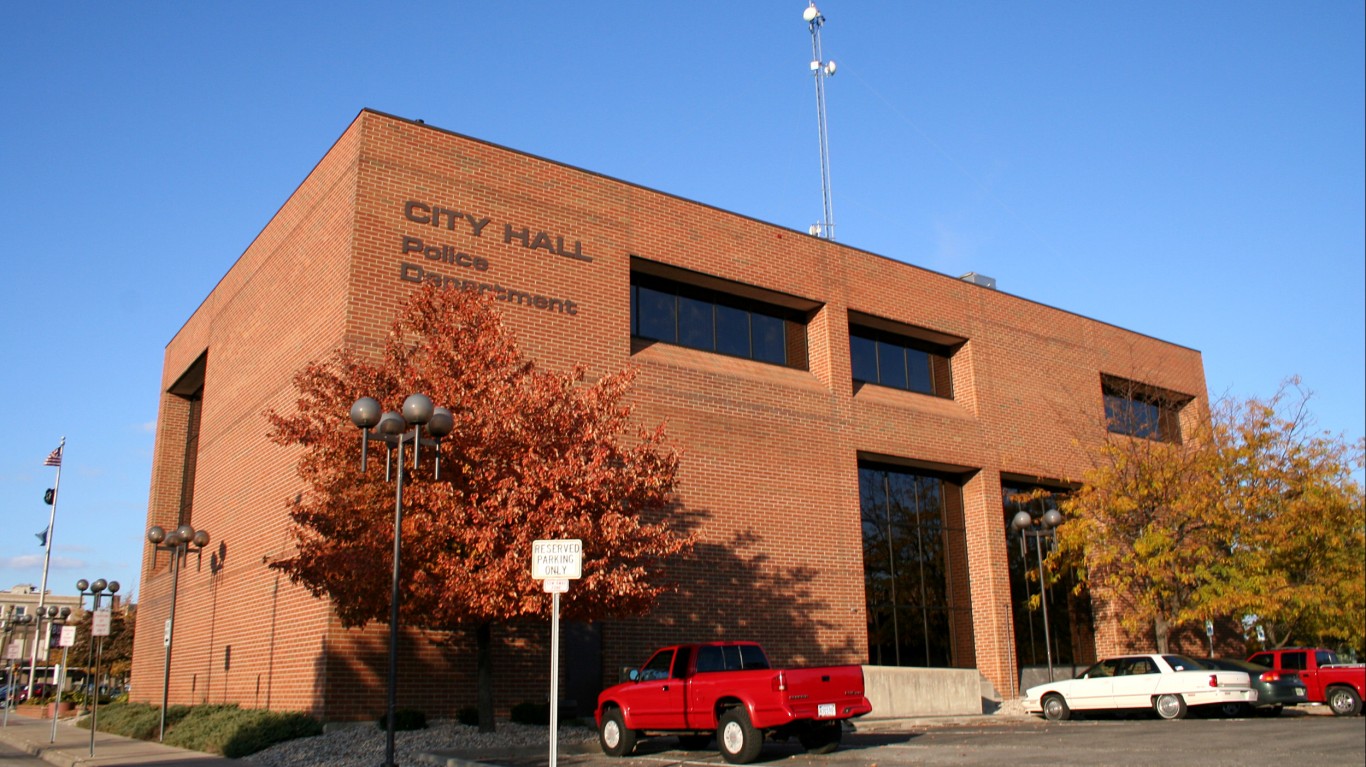
4. Danville, IL
> Confirmed COVID-19 cases as of March 15: 27,832
> Confirmed COVID-19 cases as of March 15 per 100,000 residents: 35,883.1
> Cumulative COVID-19 deaths as of March 15: 289
> Cumulative COVID-19 deaths as of March 15 per 100,000 residents: 372.6
> Population: 77,563

3. Hanford-Corcoran, CA
> Confirmed COVID-19 cases as of March 15: 54,751
> Confirmed COVID-19 cases as of March 15 per 100,000 residents: 36,333.3
> Cumulative COVID-19 deaths as of March 15: 436
> Cumulative COVID-19 deaths as of March 15 per 100,000 residents: 289.3
> Population: 150,691
2. Bismarck, ND
> Confirmed COVID-19 cases as of March 15: 46,340
> Confirmed COVID-19 cases as of March 15 per 100,000 residents: 36,344.2
> Cumulative COVID-19 deaths as of March 15: 449
> Cumulative COVID-19 deaths as of March 15 per 100,000 residents: 352.1
> Population: 127,503

1. El Centro, CA
> Confirmed COVID-19 cases as of March 15: 65,762
> Confirmed COVID-19 cases as of March 15 per 100,000 residents: 36,392.7
> Cumulative COVID-19 deaths as of March 15: 896
> Cumulative COVID-19 deaths as of March 15 per 100,000 residents: 495.8
> Population: 180,701