Special Report
This State Has the Longest Emergency Room Waiting Time in America

Published:

The COVID-19 pandemic radically changed the way America’s hospitals work and the burden put on hospital staff, doctors, and nurses. In hard-hit areas, intensive care bed availability disappeared, and other hospital beds were turned over to people who contracted the virus. Emergency rooms overflowed and some patients were put in only makeshift beds, in some cases for days. Hospitals began to lose key personnel because they felt entirely overwhelmed or became infected. (These are the 16 states where hospitals are experiencing the worst workforce shortages.)
Emergency rooms have been the “front doors” to hospitals for years, particularly facilities that treated people without insurance or other means to cover medical expenses. The spread of COVID-19 undermined the ability of ERs to perform this function, and waiting times for care became longer and longer – in the case of Maryland, the state with the longest median emergency room waiting time – an average of 228 minutes (almost four hours).
According to research by the IT service automation company SysAiD based on data from the Centers for Medicare & Medicare Services, emergency room median waiting periods in all 50 states topped 100 minutes between Jan. 7, 2020 and March 31, 2021 – a period that would have seen the serious inflows during the worst of the pandemic.
Supplemental data on COVID-19 death rates and the number of doctors per capita came from the Centers for Disease Control and Prevention. Data on hospital beds per capita came from the Kaiser Family Foundation.
Click here to see the states with the longest emergency room waiting time in America
The most notable conclusion of the study was that sparsely populated states had the shortest emergency room waiting times and crowded states had the longest. The state with the shortest waiting time was North Dakota at 104 minutes, followed by South Dakota at 113 and Nebraska at 114. The state with the longest waiting time was Maryland, the only one with an average wait time of more than 200 minutes. (These are the best rural hospitals in the U.S.)
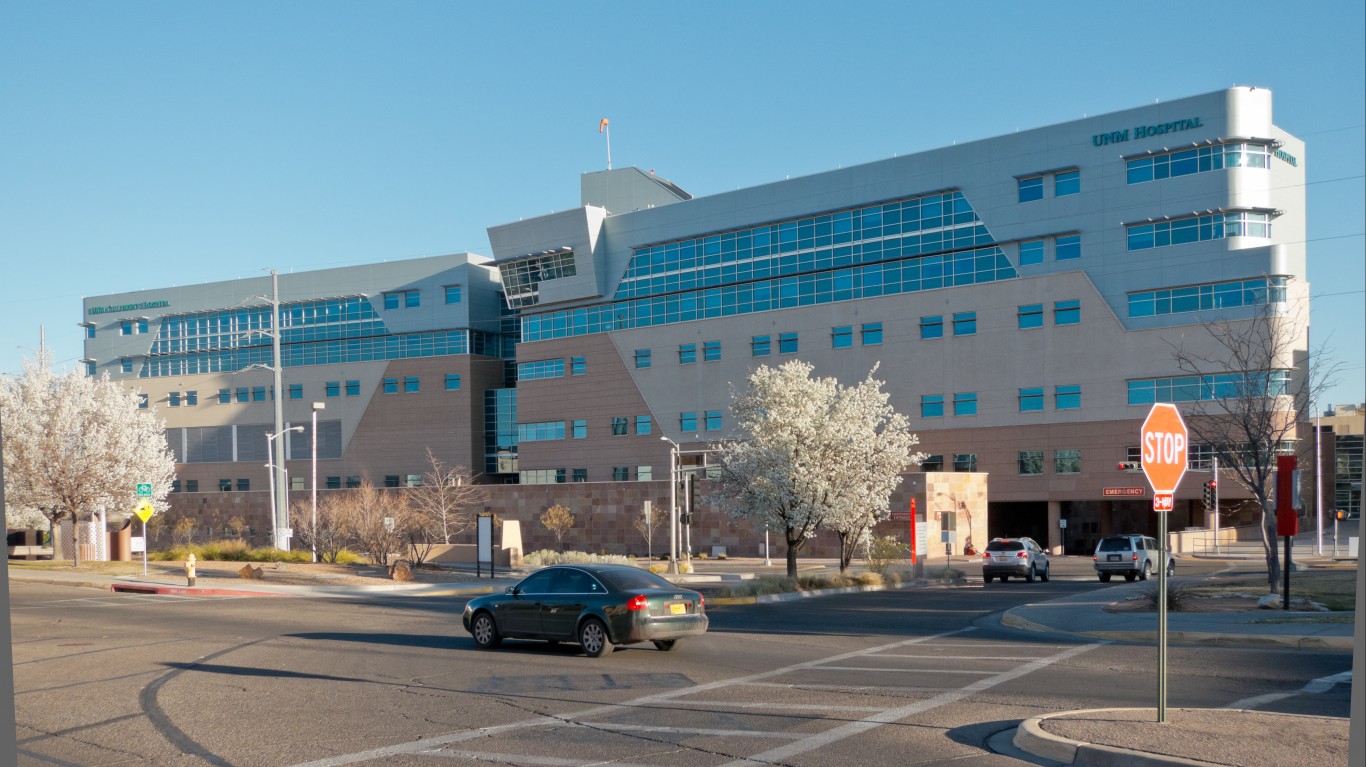
20. New Mexico
> Median ER waiting time: 150 minutes
> COVID-19 death rate: 336 per 100,000 — 16th highest
> Hospital beds per capita for same year: 1.8 per 1,000 — 5th lowest
> Doctors per capita for same year: 239.7 per 100,000 — 14th lowest
[in-text-ad]

19. Kentucky
> Median ER waiting time: 151 minutes
> COVID-19 death rate: 320 per 100,000 — 21st highest
> Hospital beds per capita for same year: 3.2 per 1,000 — 9th highest
> Doctors per capita for same year: 241.2 per 100,000 — 16th lowest

18. South Carolina
> Median ER waiting time: 151 minutes
> COVID-19 death rate: 337 per 100,000 — 15th highest
> Hospital beds per capita for same year: 2.3 per 1,000 — 23rd lowest
> Doctors per capita for same year: 234.2 per 100,000 — 13th lowest
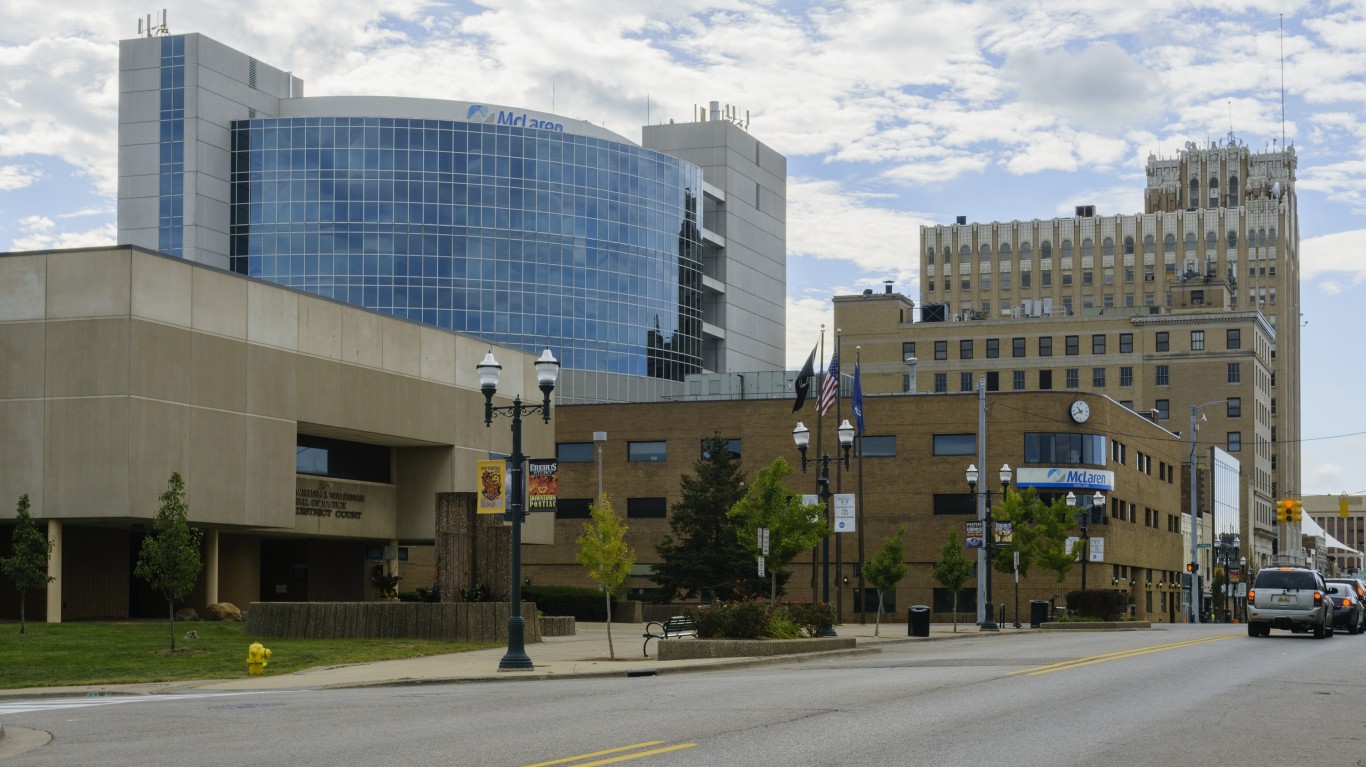
17. Michigan
> Median ER waiting time: 153 minutes
> COVID-19 death rate: 352 per 100,000 — 9th highest
> Hospital beds per capita for same year: 2.6 per 1,000 — 22nd highest
> Doctors per capita for same year: 303.7 per 100,000 — 12th highest
[in-text-ad-2]

16. New Hampshire
> Median ER waiting time: 154 minutes
> COVID-19 death rate: 177 per 100,000 — 8th lowest
> Hospital beds per capita for same year: 2.1 per 1,000 — 15th lowest
> Doctors per capita for same year: 313.6 per 100,000 — 10th highest

15. Virginia
> Median ER waiting time: 154 minutes
> COVID-19 death rate: 225 per 100,000 — 14th lowest
> Hospital beds per capita for same year: 2.1 per 1,000 — 16th lowest
> Doctors per capita for same year: 268.5 per 100,000 — 22nd highest
[in-text-ad]
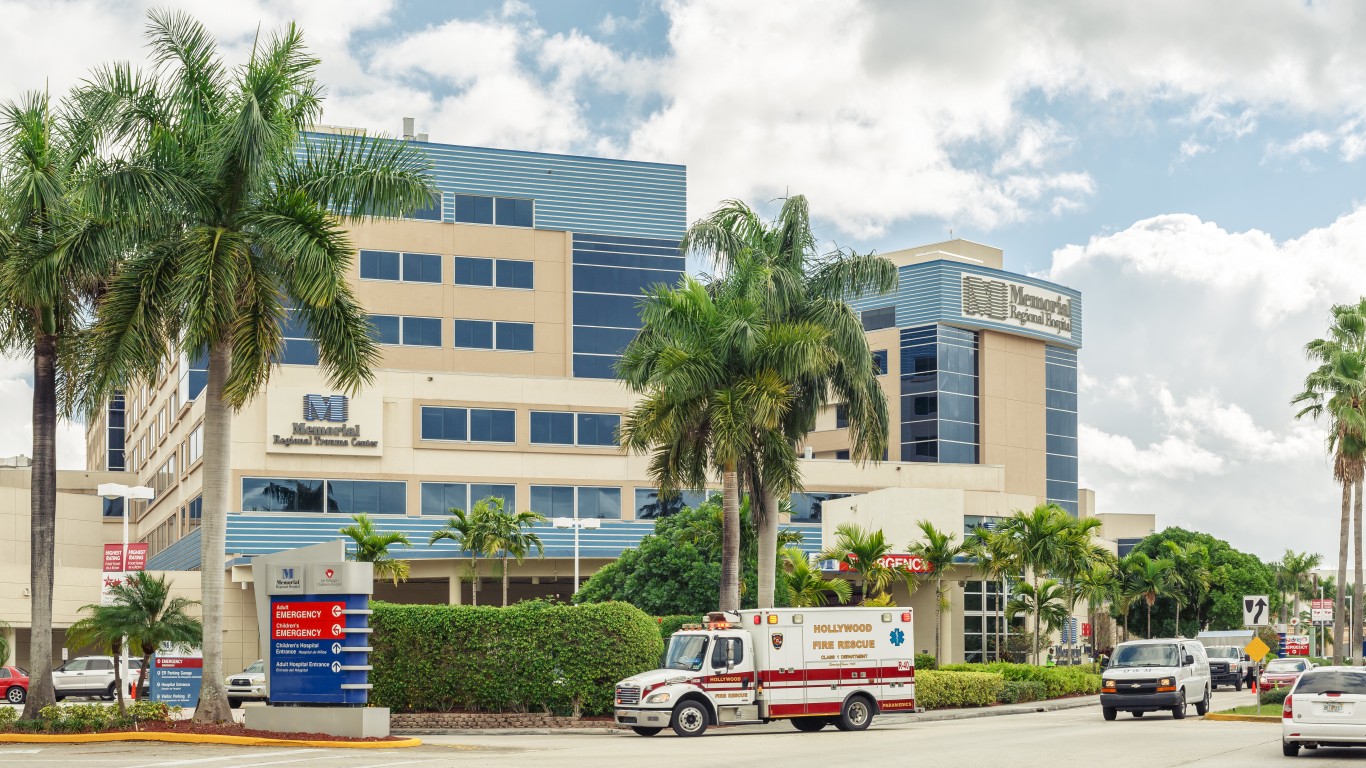
14. Florida
> Median ER waiting time: 155 minutes
> COVID-19 death rate: 335 per 100,000 — 17th highest
> Hospital beds per capita for same year: 2.6 per 1,000 — 23rd highest
> Doctors per capita for same year: 264.6 per 100,000 — 24th highest

13. Illinois
> Median ER waiting time: 157 minutes
> COVID-19 death rate: 294 per 100,000 — 24th lowest
> Hospital beds per capita for same year: 2.5 per 1,000 — 25th highest
> Doctors per capita for same year: 287.1 per 100,000 — 17th highest

12. North Carolina
> Median ER waiting time: 157 minutes
> COVID-19 death rate: 218 per 100,000 — 11th lowest
> Hospital beds per capita for same year: 2.1 per 1,000 — 18th lowest
> Doctors per capita for same year: 257.9 per 100,000 — 23rd lowest
[in-text-ad-2]

11. Oregon
> Median ER waiting time: 157 minutes
> COVID-19 death rate: 162 per 100,000 — 7th lowest
> Hospital beds per capita for same year: 1.7 per 1,000 — the lowest
> Doctors per capita for same year: 296.0 per 100,000 — 15th highest

10. Pennsylvania
> Median ER waiting time: 157 minutes
> COVID-19 death rate: 342 per 100,000 — 12th highest
> Hospital beds per capita for same year: 2.8 per 1,000 — 16th highest
> Doctors per capita for same year: 328.3 per 100,000 — 7th highest
[in-text-ad]

9. California
> Median ER waiting time: 164 minutes
> COVID-19 death rate: 218 per 100,000 — 12th lowest
> Hospital beds per capita for same year: 1.9 per 1,000 — 10th lowest
> Doctors per capita for same year: 273.4 per 100,000 — 20th highest

8. Connecticut
> Median ER waiting time: 166 minutes
> COVID-19 death rate: 298 per 100,000 — 25th lowest
> Hospital beds per capita for same year: 2.0 per 1,000 — 11th lowest
> Doctors per capita for same year: 360.7 per 100,000 — 6th highest

7. New Jersey
> Median ER waiting time: 173 minutes
> COVID-19 death rate: 372 per 100,000 — 4th highest
> Hospital beds per capita for same year: 2.3 per 1,000 — 24th lowest
> Doctors per capita for same year: 317.4 per 100,000 — 9th highest
[in-text-ad-2]

6. Arizona
> Median ER waiting time: 176 minutes
> COVID-19 death rate: 385 per 100,000 — 3rd highest
> Hospital beds per capita for same year: 1.9 per 1,000 — 6th lowest
> Doctors per capita for same year: 245.8 per 100,000 — 19th lowest

5. New York
> Median ER waiting time: 184 minutes
> COVID-19 death rate: 245 per 100,000 — 17th lowest
> Hospital beds per capita for same year: 2.7 per 1,000 — 18th highest
> Doctors per capita for same year: 369.8 per 100,000 — 4th highest
[in-text-ad]

4. Rhode Island
> Median ER waiting time: 185 minutes
> COVID-19 death rate: 322 per 100,000 — 19th highest
> Hospital beds per capita for same year: 2.1 per 1,000 — 17th lowest
> Doctors per capita for same year: 407.5 per 100,000 — 2nd highest

3. Massachusetts
> Median ER waiting time: 189 minutes
> COVID-19 death rate: 344 per 100,000 — 11th highest
> Hospital beds per capita for same year: 2.3 per 1,000 — 25th lowest
> Doctors per capita for same year: 435.4 per 100,000 — the highest

2. Delaware
> Median ER waiting time: 195 minutes
> COVID-19 death rate: 288 per 100,000 — 20th lowest
> Hospital beds per capita for same year: 2.2 per 1,000 — 21st lowest
> Doctors per capita for same year: 257.7 per 100,000 — 22nd lowest
[in-text-ad-2]

1. Maryland
> Median ER waiting time: 228 minutes
> COVID-19 death rate: 235 per 100,000 — 16th lowest
> Hospital beds per capita for same year: 1.8 per 1,000 — 3rd lowest
> Doctors per capita for same year: 363.6 per 100,000 — 5th highest
Credit card companies are pulling out all the stops, with the issuers are offering insane travel rewards and perks.
We’re talking huge sign-up bonuses, points on every purchase, and benefits like lounge access, travel credits, and free hotel nights. For travelers, these rewards can add up to thousands of dollars in flights, upgrades, and luxury experiences every year.
It’s like getting paid to travel — and it’s available to qualified borrowers who know where to look.
We’ve rounded up some of the best travel credit cards on the market. Click here to see the list. Don’t miss these offers — they won’t be this good forever.
Thank you for reading! Have some feedback for us?
Contact the 24/7 Wall St. editorial team.