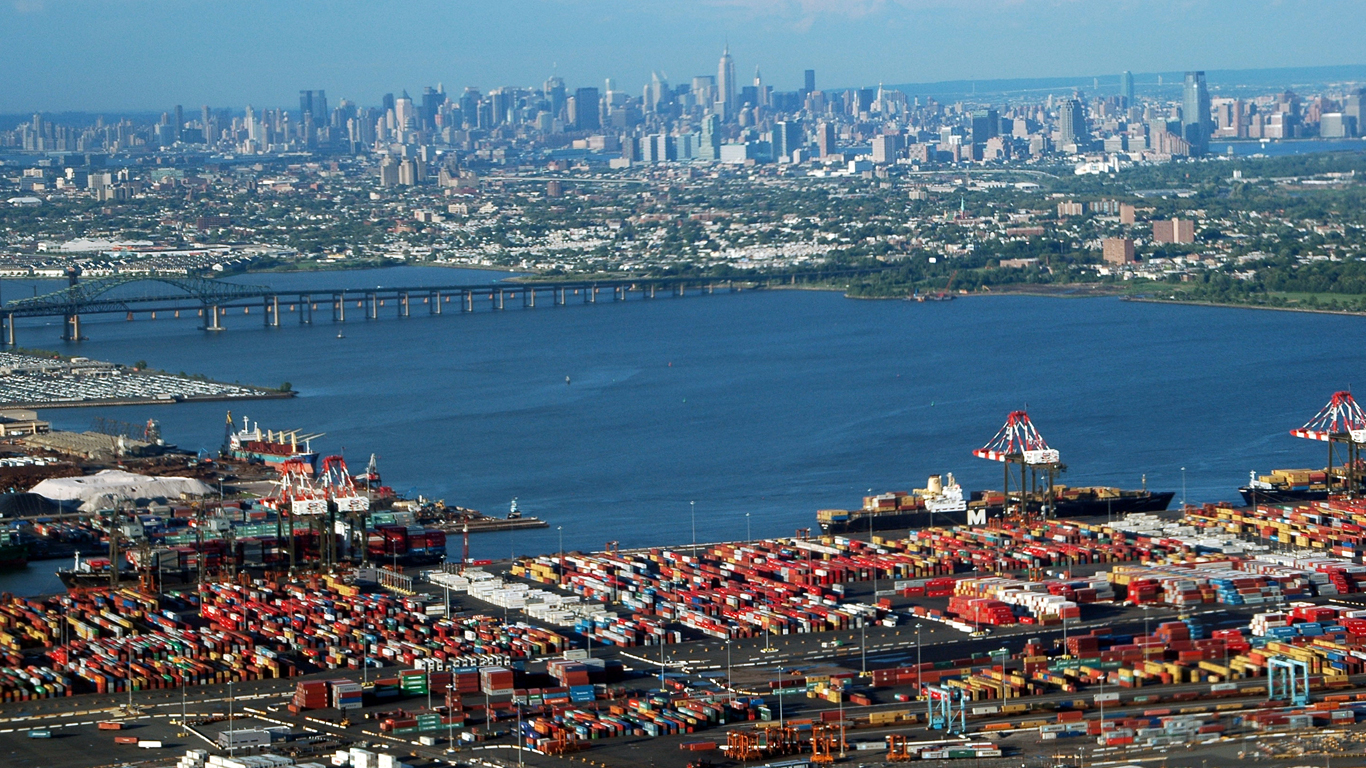
Trade has become an increasingly important part of the U.S. economy over the past several decades, rising from 10.8% of the nation’s GDP in 1970 to 23.4% as of 2020. America’s ports serve as the foundation of the country’s growing international trade sector, handling over 95% of all cargo entering the United States.
Ports are transportation hubs that connect international marine highways to domestic trade routes, and they are often a major source of jobs and revenue in the areas they are located. The busiest ports in America act as key economic infrastructure and can also play an important role in national defense and emergency preparedness. (This is the most import dependent economy in the world.)
To determine America’s busiest ports, 24/7 Wall St. reviewed data from the U.S. Army Corps of Engineers Waterborne Commerce Statistics Center, compiled by the American Association of Port Authorities. U.S. ports were ranked based on the total amount of incoming and outgoing cargo volume in 2019. All other data came from the American Association of Port Authorities.
Petroleum is America’s principal export, accounting for 12.7% of export good value in 2020. As a result, many of the country’s busiest ports are located in the Gulf Coast states, which – together with federal offshore production in the Gulf of Mexico – account for 70.5% of total U.S. crude oil production. As of 2019, 12 of the 25 busiest ports in the United States were situated in the Gulf Coast. (These are 15 countries that control the world’s oil.)
While most of America’s busiest ports engage in both foreign and domestic trade, some inland ports along the country’s major shipping waterways deal exclusively in domestic goods. Three of the 25 busiest U.S. ports – the Port of Huntington Tri-State, the Ports of Cincinnati and Northern Kentucky, and the Port of Metropolitan St. Louis – are inland ports that facilitate domestic trade along the Ohio and Mississippi Rivers.
Click here to see the America’s busiest cities for international trade

25. Port of Pascagoula, MS
> Total cargo volume, 2019: 25.8 million tons
> Foreign trade volume, 2019: 17.0 million tons (65.8% of total)
> Domestic trade volume, 2019: 8.8 million tons (34.2% of total)
[in-text-ad]
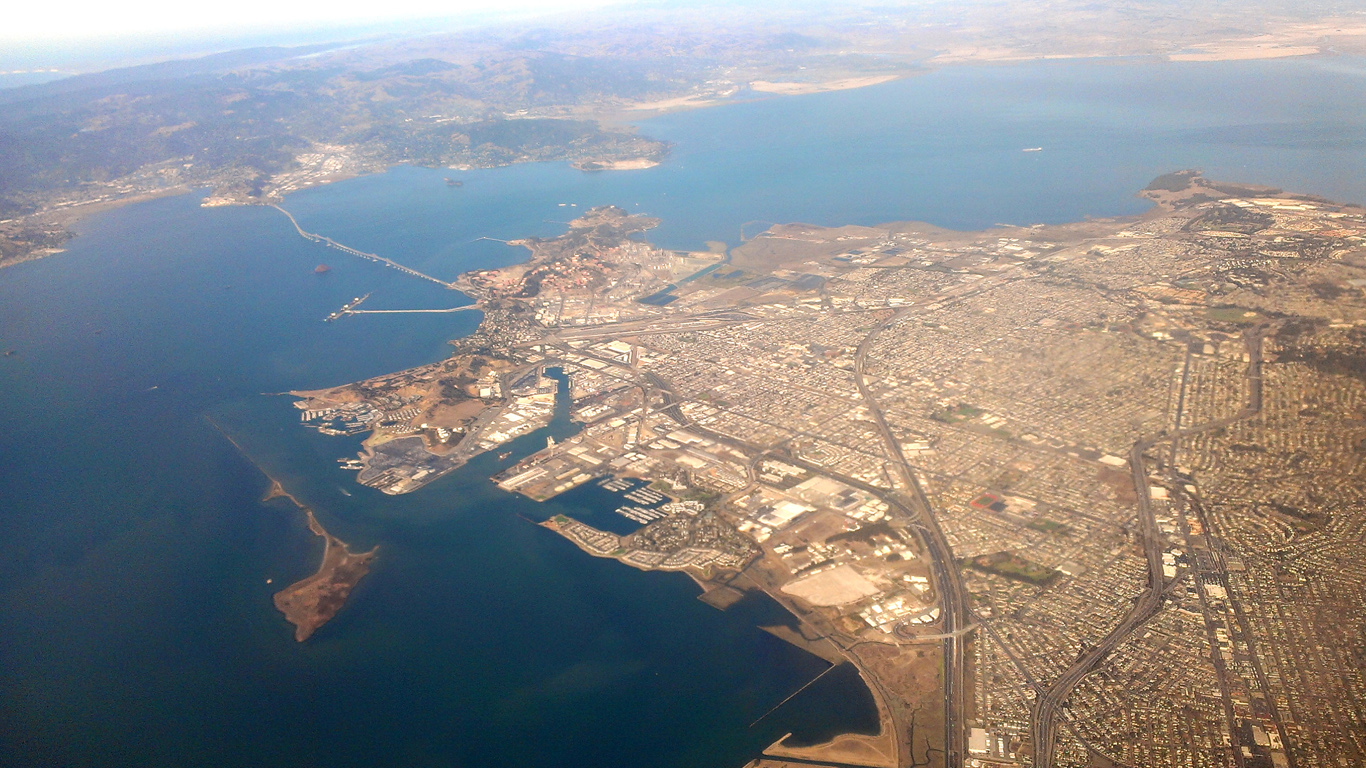
24. Port of Richmond, CA
> Total cargo volume, 2019: 28.5 million tons
> Foreign trade volume, 2019: 21.2 million tons (74.5% of total)
> Domestic trade volume, 2019: 7.3 million tons (25.5% of total)
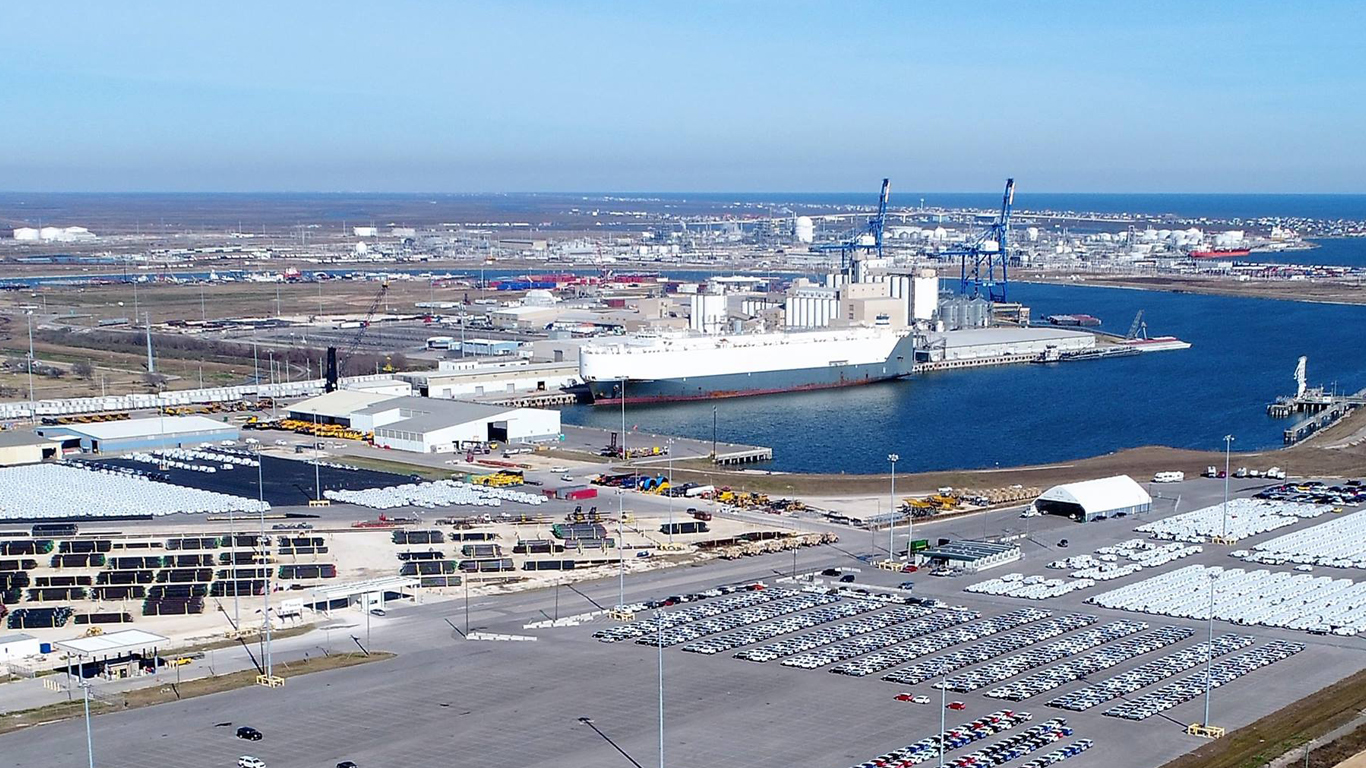
23. Port Freeport, TX
> Total cargo volume, 2019: 29.8 million tons
> Foreign trade volume, 2019: 26.0 million tons (87.0% of total)
> Domestic trade volume, 2019: 3.9 million tons (13.0% of total)
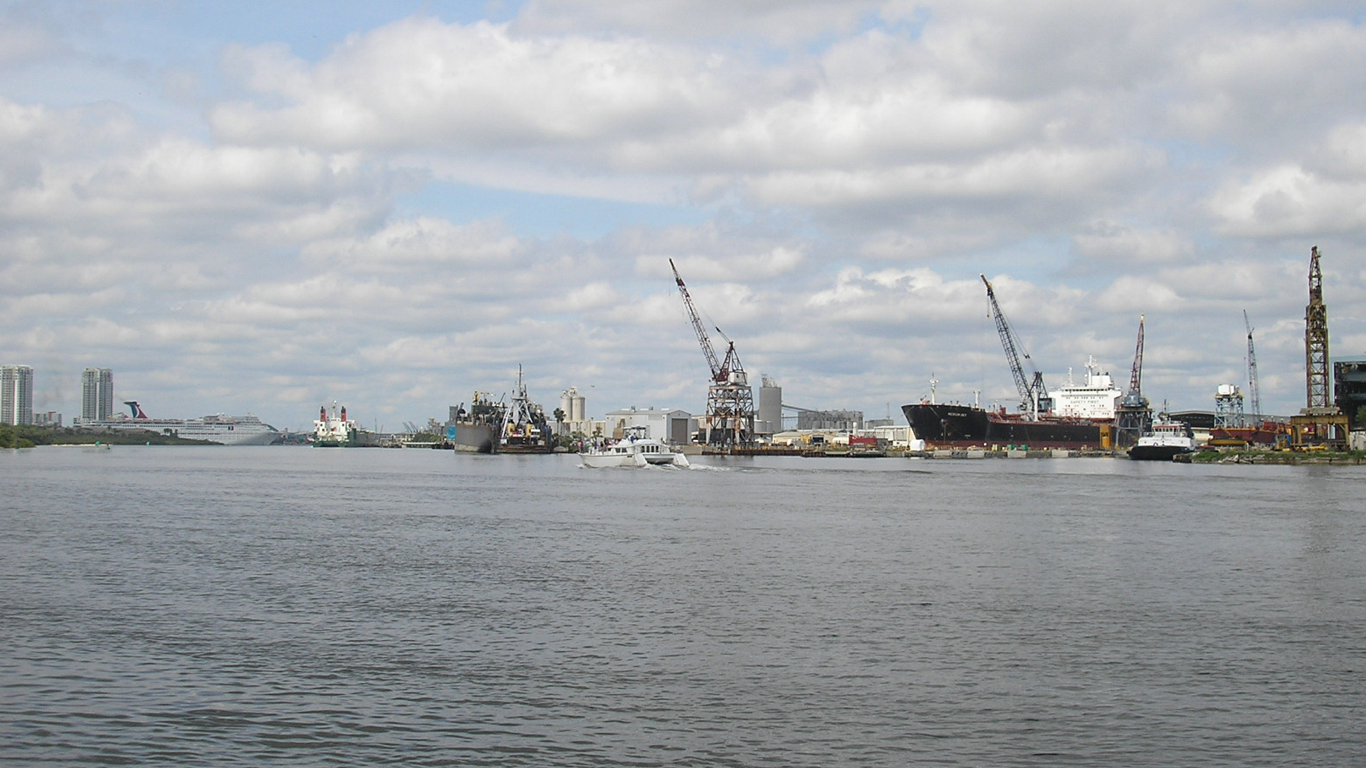
22. Port of Tampa Bay, FL
> Total cargo volume, 2019: 30.0 million tons
> Foreign trade volume, 2019: 11.9 million tons (39.7% of total)
> Domestic trade volume, 2019: 18.1 million tons (60.3% of total)
[in-text-ad-2]

21. Port of Metropolitan St. Louis, MO
> Total cargo volume, 2019: 31.3 million tons
> Foreign trade volume, 2019: 0 tons (0.0% of total)
> Domestic trade volume, 2019: 31.3 million tons (100.0% of total)
20. Port of Duluth-Superior, MN/WI
> Total cargo volume, 2019: 33.7 million tons
> Foreign trade volume, 2019: 7.4 million tons (21.8% of total)
> Domestic trade volume, 2019: 26.4 million tons (78.2% of total)
[in-text-ad]

19. Port of Port Arthur, TX
> Total cargo volume, 2019: 33.9 million tons
> Foreign trade volume, 2019: 22.7 million tons (66.8% of total)
> Domestic trade volume, 2019: 11.3 million tons (33.2% of total)

18. Ports of Cincinnati and Northern Kentucky, OH/KY
> Total cargo volume, 2019: 36.6 million tons
> Foreign trade volume, 2019: 0 tons (0.0% of total)
> Domestic trade volume, 2019: 36.6 million tons (100.0% of total)
17. Port of Huntington Tri-State, KY/OH/WV
> Total cargo volume, 2019: 36.8 million tons
> Foreign trade volume, 2019: 0 tons (0.0% of total)
> Domestic trade volume, 2019: 36.8 million tons (100.0% of total)
[in-text-ad-2]
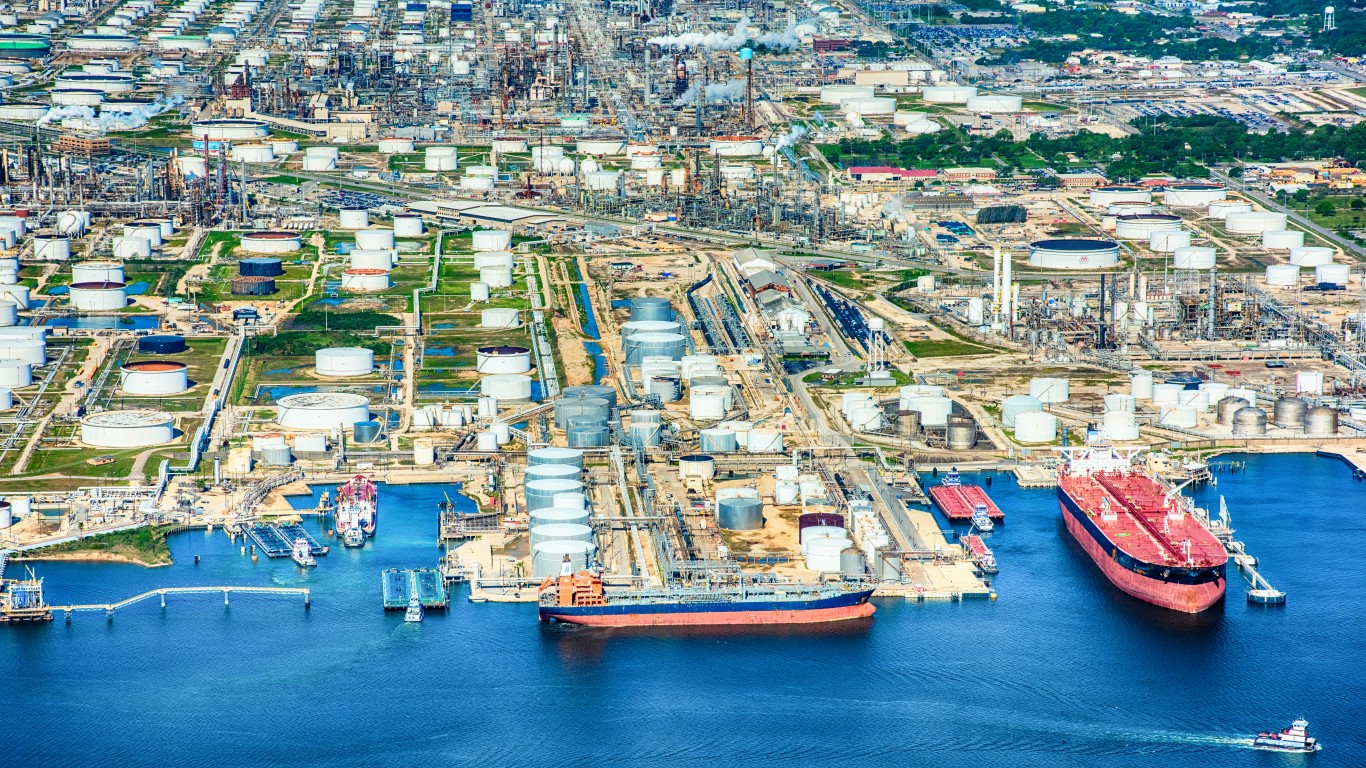
16. Port of Texas City, TX
> Total cargo volume, 2019: 41.3 million tons
> Foreign trade volume, 2019: 24.6 million tons (59.6% of total)
> Domestic trade volume, 2019: 16.7 million tons (40.4% of total)
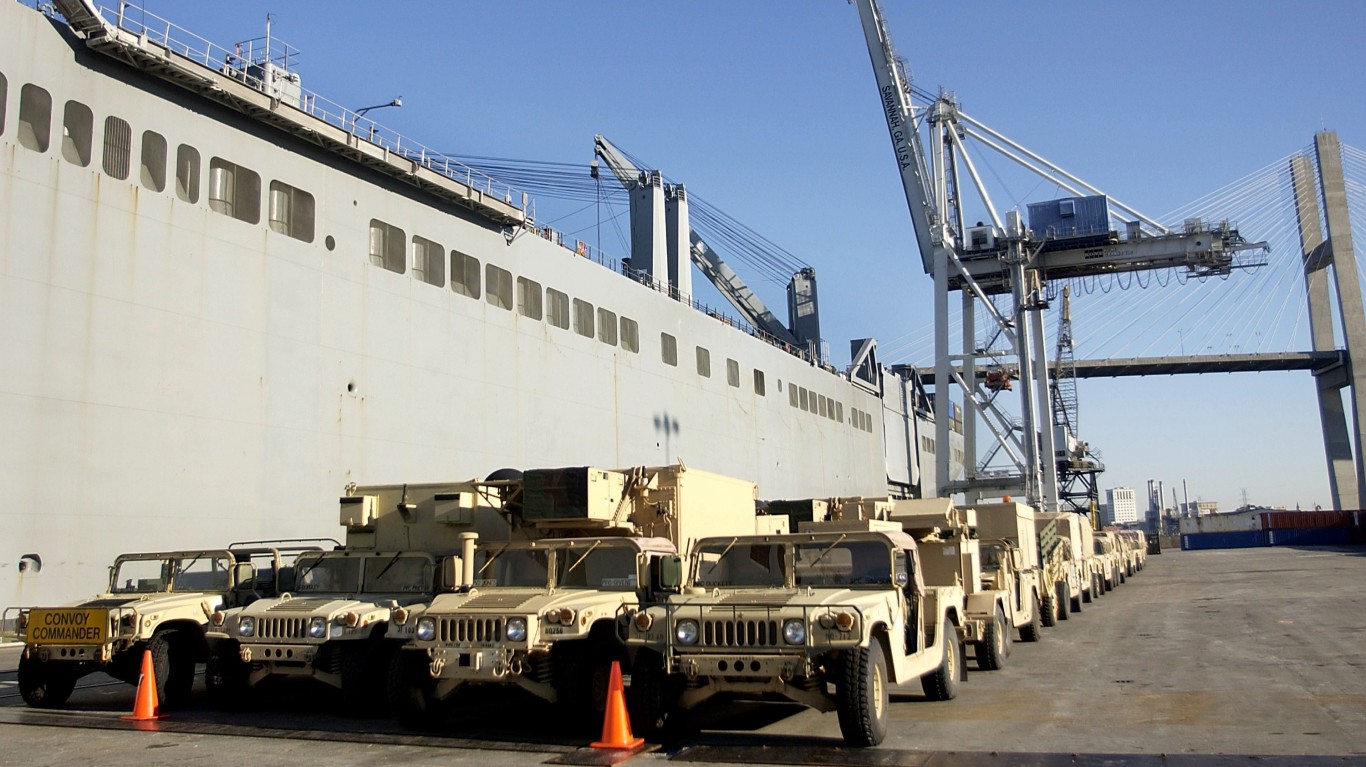
15. Port of Savannah, GA
> Total cargo volume, 2019: 41.9 million tons
> Foreign trade volume, 2019: 41.0 million tons (97.8% of total)
> Domestic trade volume, 2019: 926,459 tons (2.2% of total)
[in-text-ad]
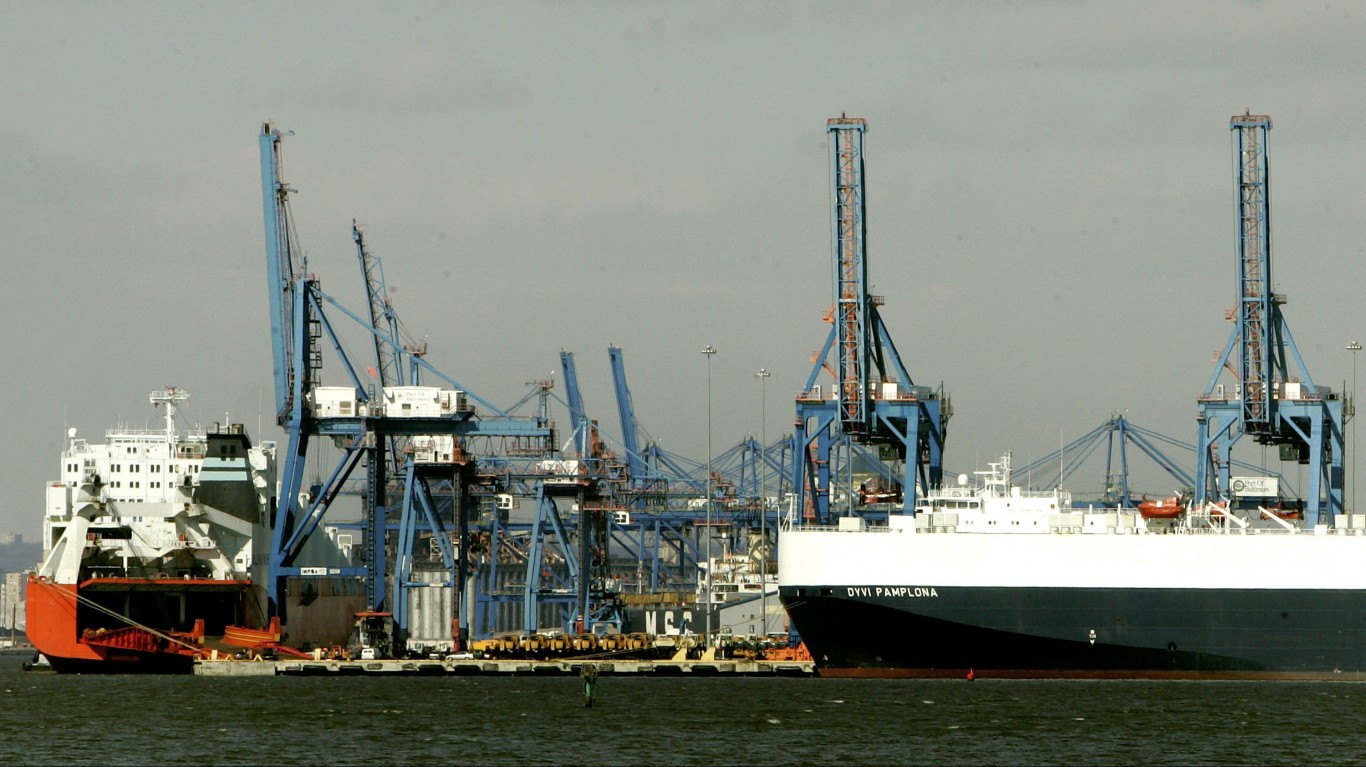
14. Port of Baltimore, MD
> Total cargo volume, 2019: 44.2 million tons
> Foreign trade volume, 2019: 37.6 million tons (85.1% of total)
> Domestic trade volume, 2019: 6.6 million tons (14.9% of total)

13. Plaquemines Port Harbor, LA
> Total cargo volume, 2019: 52.8 million tons
> Foreign trade volume, 2019: 23.8 million tons (45.1% of total)
> Domestic trade volume, 2019: 29.0 million tons (54.9% of total)

12. Port of Mobile, AL
> Total cargo volume, 2019: 56.9 million tons
> Foreign trade volume, 2019: 37.2 million tons (65.4% of total)
> Domestic trade volume, 2019: 19.7 million tons (34.6% of total)
[in-text-ad-2]
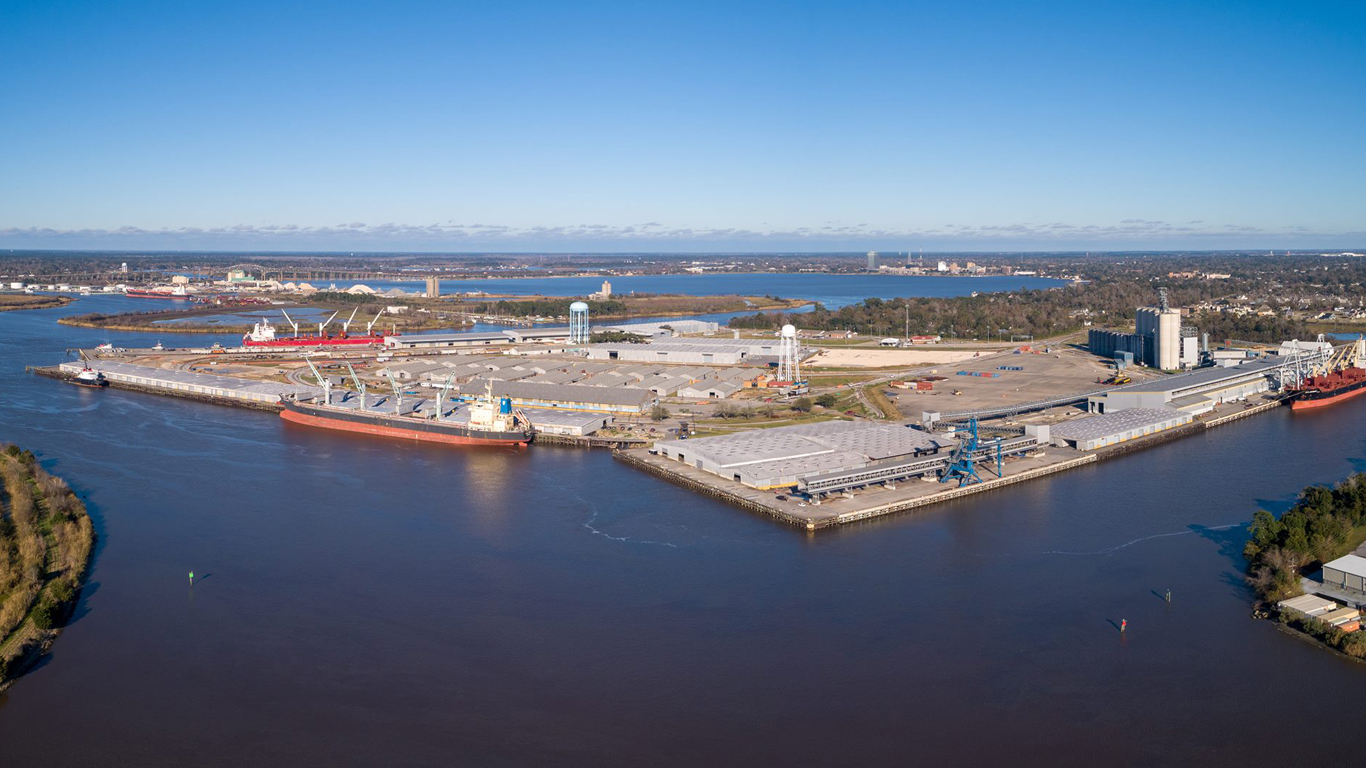
11. Port of Lake Charles, LA
> Total cargo volume, 2019: 58.0 million tons
> Foreign trade volume, 2019: 26.3 million tons (45.2% of total)
> Domestic trade volume, 2019: 31.8 million tons (54.8% of total)
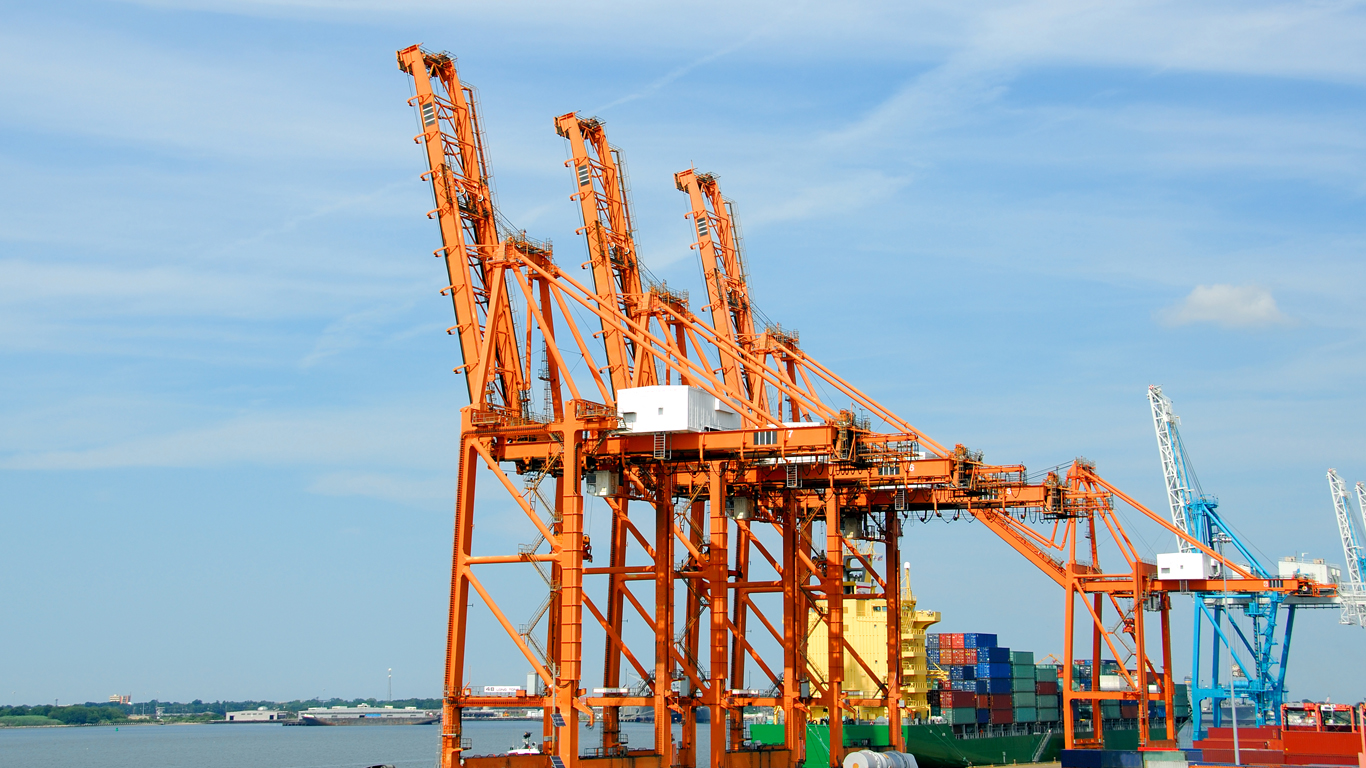
10. Port of Virginia
> Total cargo volume, 2019: 61.7 million tons
> Foreign trade volume, 2019: 57.2 million tons (92.7% of total)
> Domestic trade volume, 2019: 4.5 million tons (7.3% of total)
[in-text-ad]
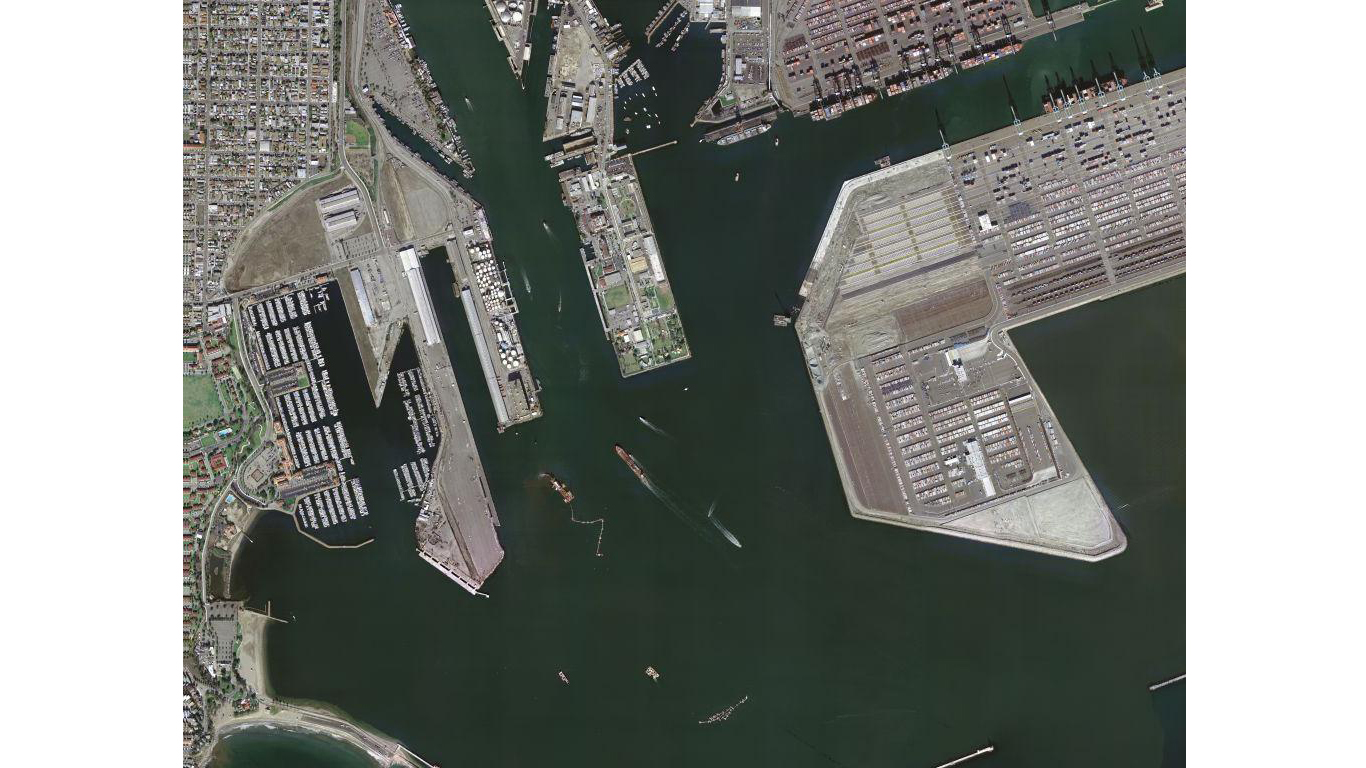
9. Port of Los Angeles, CA
> Total cargo volume, 2019: 63.0 million tons
> Foreign trade volume, 2019: 56.3 million tons (89.3% of total)
> Domestic trade volume, 2019: 6.8 million tons (10.7% of total)
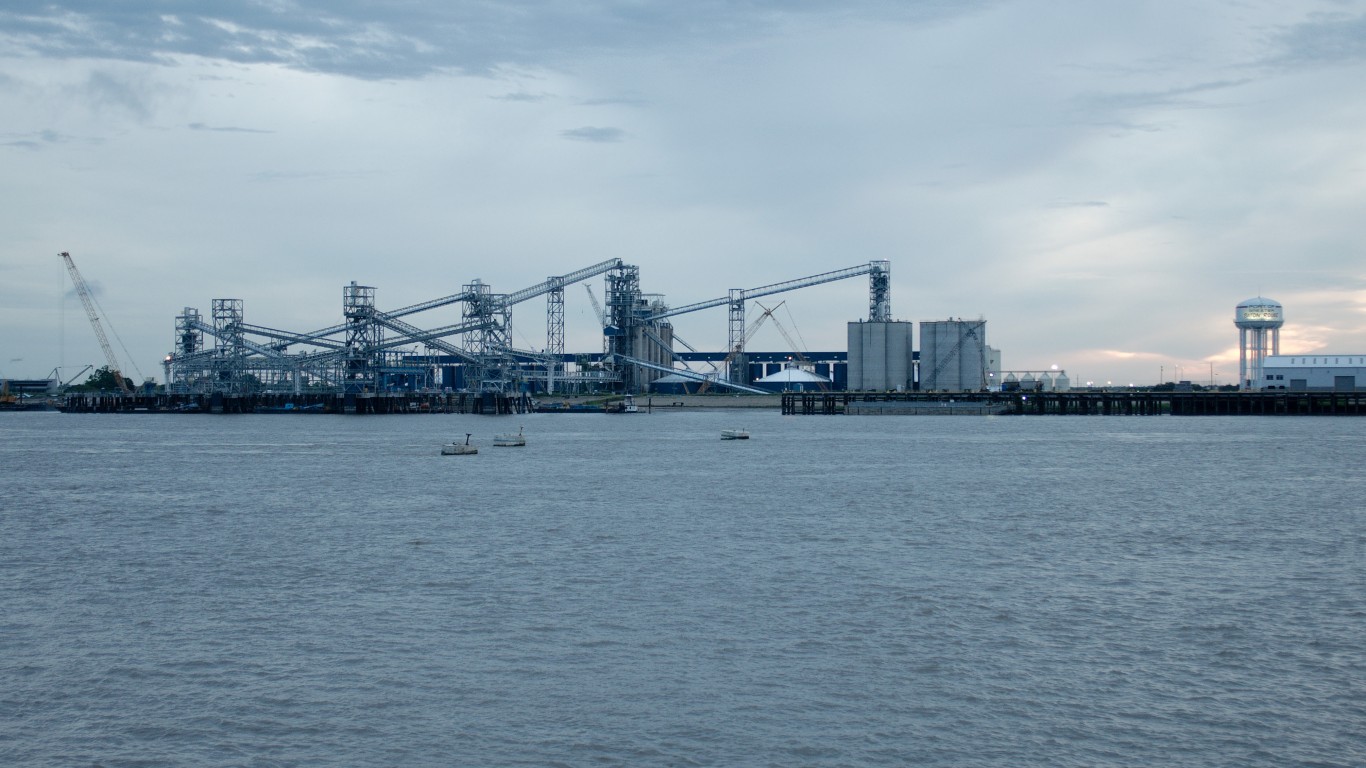
8. Port of Greater Baton Rouge, LA
> Total cargo volume, 2019: 73.4 million tons
> Foreign trade volume, 2019: 30.0 million tons (40.9% of total)
> Domestic trade volume, 2019: 43.4 million tons (59.1% of total)

7. Port of Long Beach, CA
> Total cargo volume, 2019: 80.7 million tons
> Foreign trade volume, 2019: 71.2 million tons (88.2% of total)
> Domestic trade volume, 2019: 9.5 million tons (11.8% of total)
[in-text-ad-2]
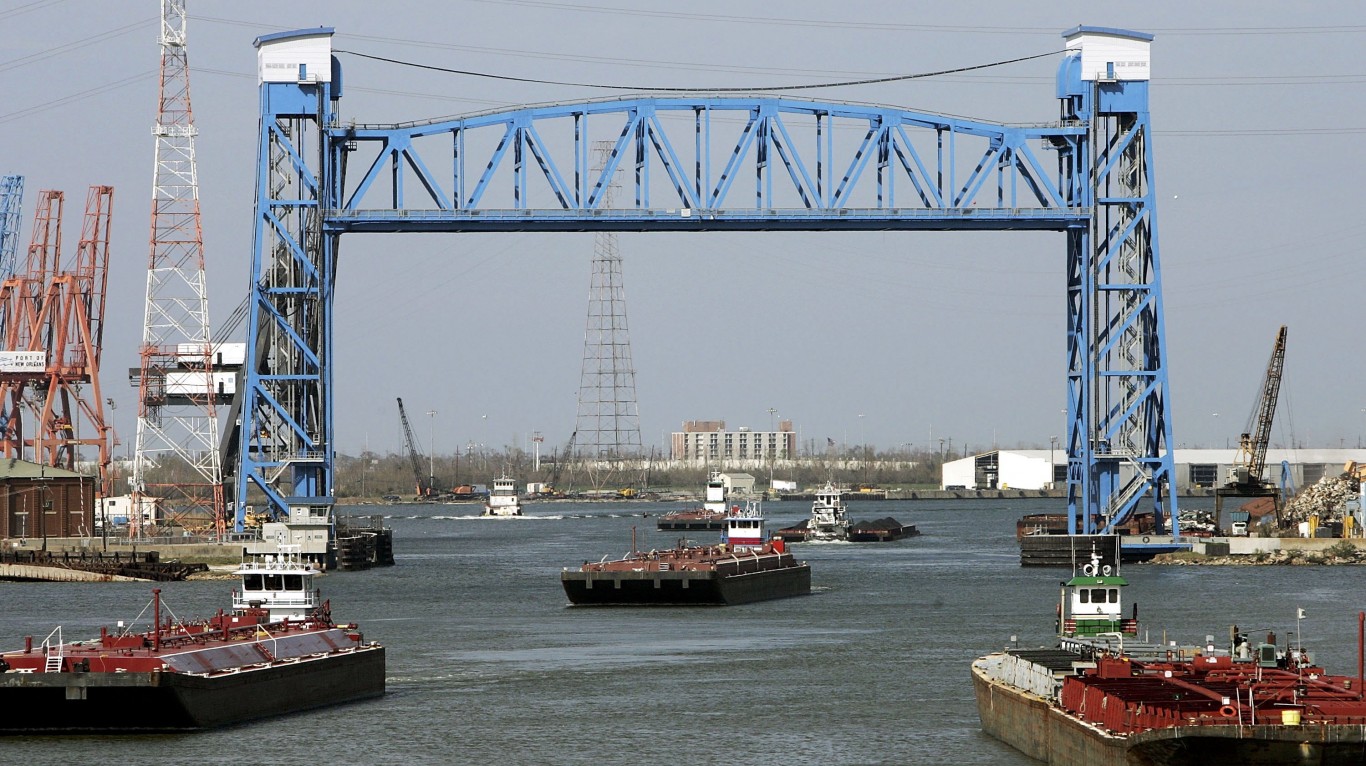
6. Port of New Orleans, LA
> Total cargo volume, 2019: 92.2 million tons
> Foreign trade volume, 2019: 44.0 million tons (47.7% of total)
> Domestic trade volume, 2019: 48.2 million tons (52.3% of total)

5. Port of Beaumont, TX
> Total cargo volume, 2019: 101.1 million tons
> Foreign trade volume, 2019: 64.2 million tons (63.5% of total)
> Domestic trade volume, 2019: 36.9 million tons (36.5% of total)
[in-text-ad]

4. Port of Corpus Christi, TX
> Total cargo volume, 2019: 111.2 million tons
> Foreign trade volume, 2019: 85.4 million tons (76.8% of total)
> Domestic trade volume, 2019: 25.8 million tons (23.2% of total)
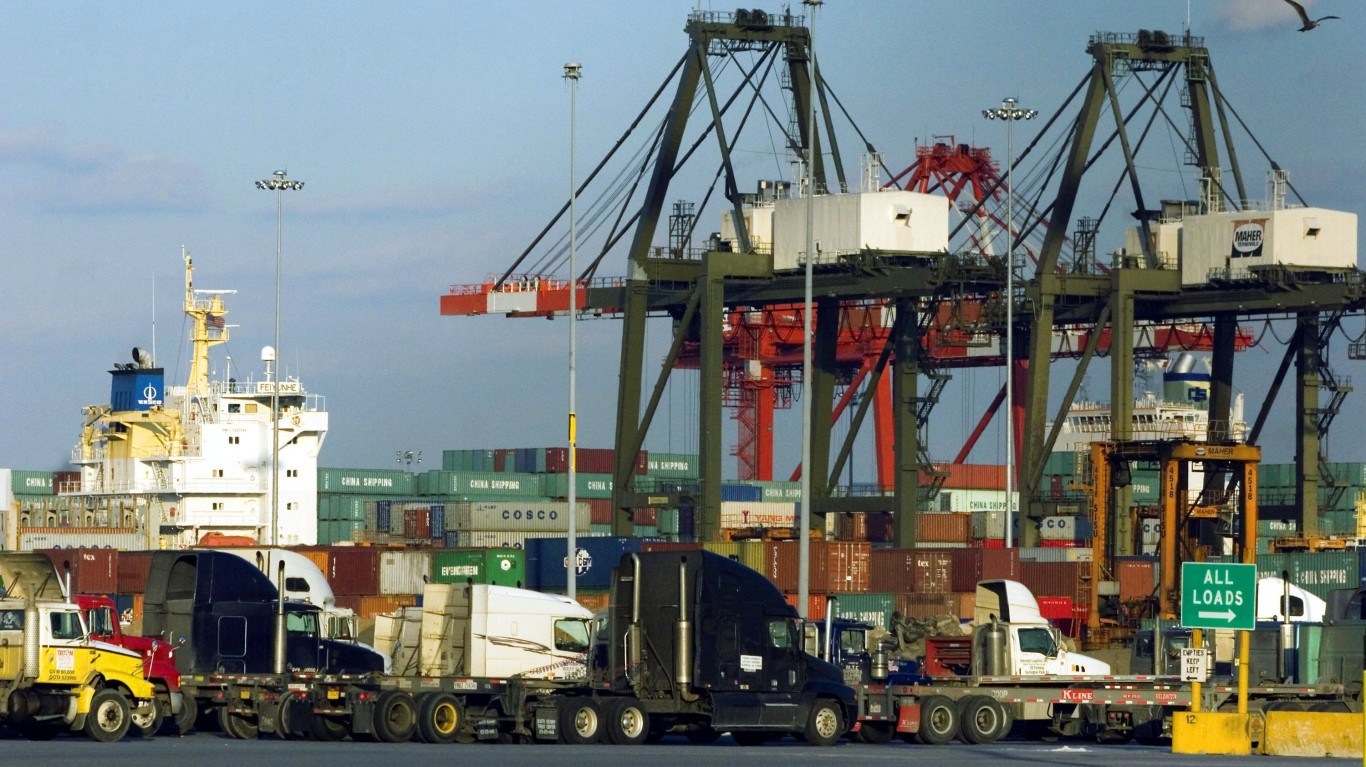
3. Port of New York & New Jersey
> Total cargo volume, 2019: 136.6 million tons
> Foreign trade volume, 2019: 91.3 million tons (66.8% of total)
> Domestic trade volume, 2019: 45.3 million tons (33.2% of total)

2. Port of South Louisiana, LA
> Total cargo volume, 2019: 238.0 million tons
> Foreign trade volume, 2019: 115.6 million tons (48.6% of total)
> Domestic trade volume, 2019: 122.3 million tons (51.4% of total)
[in-text-ad-2]
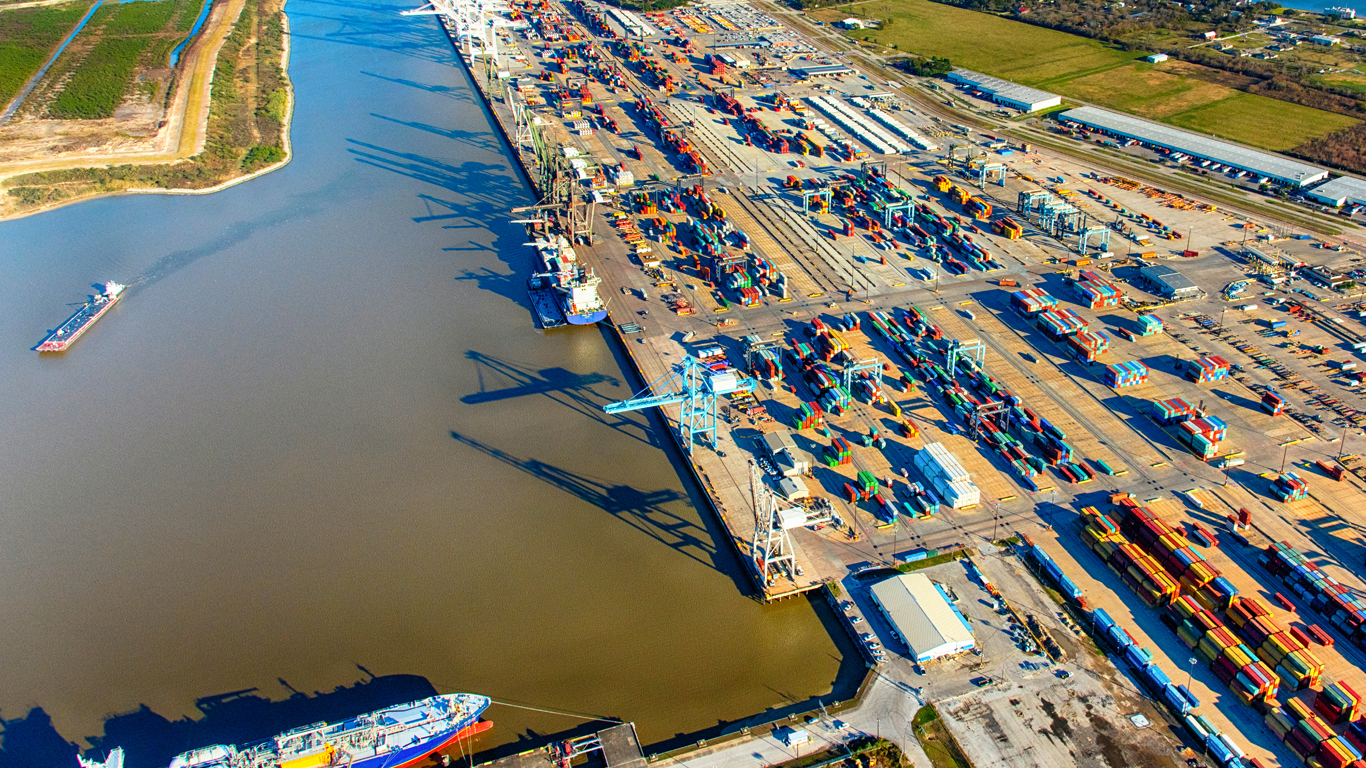
1. Port of Houston, TX
> Total cargo volume, 2019: 284.9 million tons
> Foreign trade volume, 2019: 209.8 million tons (73.6% of total)
> Domestic trade volume, 2019: 75.2 million tons (26.4% of total)
Credit Card Companies Are Doing Something Nuts
Credit card companies are at war. The biggest issuers are handing out free rewards and benefits to win the best customers.
It’s possible to find cards paying unlimited 1.5%, 2%, and even more today. That’s free money for qualified borrowers, and the type of thing that would be crazy to pass up. Those rewards can add up to thousands of dollars every year in free money, and include other benefits as well.
We’ve assembled some of the best credit cards for users today. Don’t miss these offers because they won’t be this good forever.
Flywheel Publishing has partnered with CardRatings for our coverage of credit card products. Flywheel Publishing and CardRatings may receive a commission from card issuers.
Thank you for reading! Have some feedback for us?
Contact the 24/7 Wall St. editorial team.
 24/7 Wall St.

 24/7 Wall St.
 24/7 Wall St.
 24/7 Wall St.