Driven by a surge in homicides and an increase in cases of aggravated assault, the U.S. violent crime rate rose in 2020, according to data from the FBI. One bright spot in the latest data, however, was a year-over-year decline in reported robberies. In a continuation of a multi-decade trend, the number of robberies committed in the U.S. fell by 9%, from about 268,500 in 2019 to 243,600 in 2020.
According to the FBI, robbery is a crime in which force or the threat of force or violence is used to take, or to attempt to take, anything of value from another person. The largest share of robberies in the United States are committed on streets or sidewalks. Handguns are the most commonly used weapon in robberies, and more often than not, among the cases where a suspect can be identified, the offender and victim are strangers to one another.
While cases of robbery are falling in much of the country, there are some exceptions, and in some U.S. cities, robbery rates are on the rise.
Using data from the FBI, 24/7 Wall St. identified the 50 cities where the robbery rate is rising fastest. Cities, defined as having a population greater than 25,000, are ranked by the year-over-year change in the number of robberies per 100,000 people. Among the cities on this list, robbery rates have climbed by as much as 111 incidents per 100,000 people. For context, the U.S. robbery rate fell by 8 incidents per 100,000 in 2020.
Robbery – along with rаpe, aggravated assault, and homicide – is one component of the overall violent crime category. Even though robbery accounts for only a small percentage of all violent crimes, most of the cities on this list also reported an increase in violent crime overall in 2020. Here is a look at the states where crime is soaring.
In the majority of the cities on this list, the overall robbery rate was lower than the national rate in 2019. Following the surge in robberies in 2020, however, all but nine cities on this list now have a higher robbery rate than the current national rate of 74 incidents per 100,000 people. Here is a look at the states with the highest robbery rates.
Click here to see cities where the robbery rate is soaring
Click here to see our detailed methodology

50. Decatur, Illinois
> 1-yr. change in reported robberies per 100K: +26.4
> Robberies reported in 2020: 83 — 252nd highest of 1,122 cities (tied)
> Robberies per 100K people in 2020: 118.3 — 219th highest of 1,122 cities
> 1-yr. change in all violent crime per 100k people: +166.5 — 47th highest of 1,119 cities
> Violent crimes per 100K people in 2020: 696.8 — 158th highest of 1,121 cities
> Population: 72,359
[in-text-ad]

49. Cabot, Arkansas
> 1-yr. change in reported robberies per 100K: +26.4
> Robberies reported in 2020: 10 — 230th lowest of 1,122 cities (tied)
> Robberies per 100K people in 2020: 37.6 — 426th lowest of 1,122 cities
> 1-yr. change in all violent crime per 100k people: +11.5 — 515th highest of 1,119 cities
> Violent crimes per 100K people in 2020: 383.6 — 429th highest of 1,121 cities
> Population: 26,217
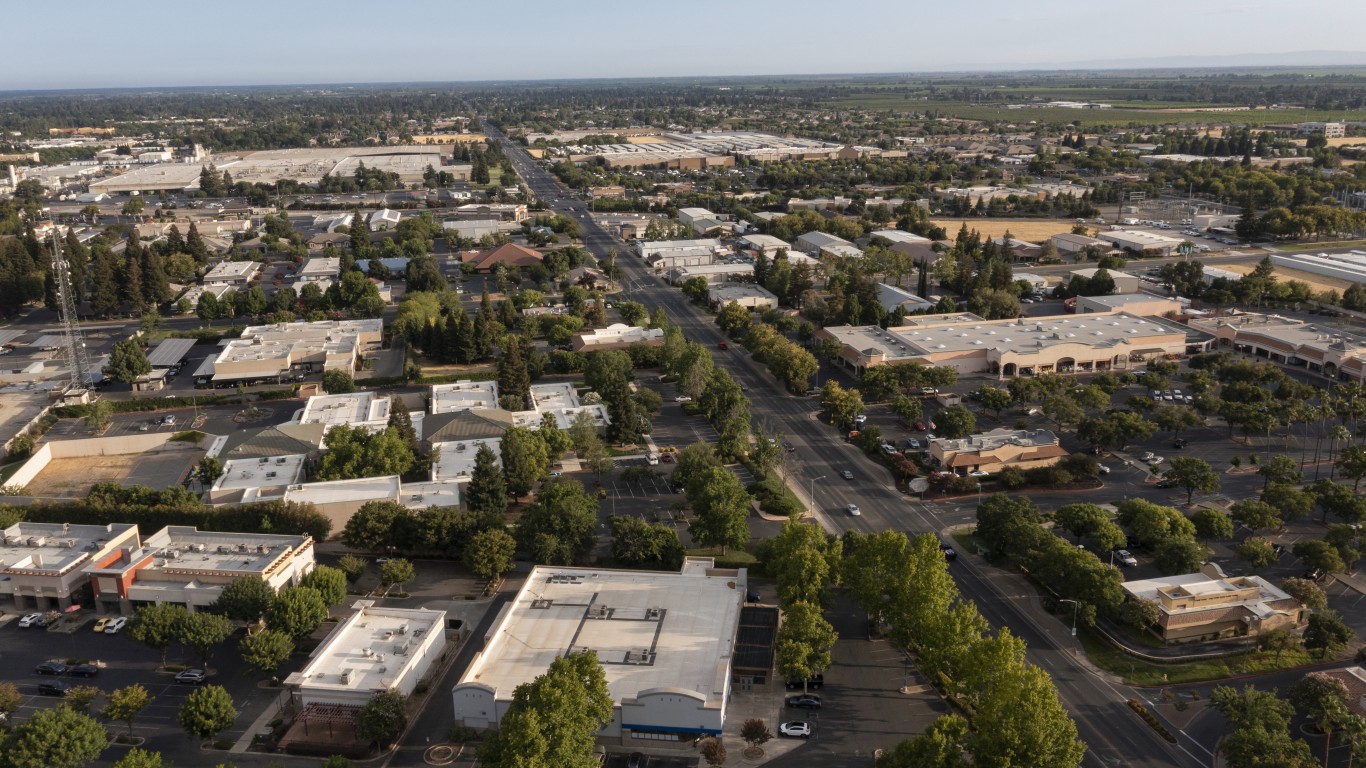
48. Yuba City, California
> 1-yr. change in reported robberies per 100K: +26.8
> Robberies reported in 2020: 70 — 303rd highest of 1,122 cities (tied)
> Robberies per 100K people in 2020: 104.2 — 270th highest of 1,122 cities
> 1-yr. change in all violent crime per 100k people: +1.5 — 495th lowest of 1,119 cities
> Violent crimes per 100K people in 2020: 360.3 — 454th highest of 1,121 cities
> Population: 66,516

47. Holyoke, Massachusetts
> 1-yr. change in reported robberies per 100K: +28.1
> Robberies reported in 2020: 64 — 332nd highest of 1,122 cities (tied)
> Robberies per 100K people in 2020: 160.0 — 121st highest of 1,122 cities
> 1-yr. change in all violent crime per 100k people: +46.3 — 274th highest of 1,119 cities
> Violent crimes per 100K people in 2020: 905.0 — 79th highest of 1,121 cities
> Population: 40,241
[in-text-ad-2]

46. Newark, California
> 1-yr. change in reported robberies per 100K: +28.4
> Robberies reported in 2020: 55 — 372nd highest of 1,122 cities (tied)
> Robberies per 100K people in 2020: 110.1 — 247th highest of 1,122 cities
> 1-yr. change in all violent crime per 100k people: +64.7 — 204th highest of 1,119 cities
> Violent crimes per 100K people in 2020: 238.3 — 462nd lowest of 1,121 cities
> Population: 47,171

45. University Place, Washington
> 1-yr. change in reported robberies per 100K: +28.7
> Robberies reported in 2020: 28 — 550th lowest of 1,122 cities (tied)
> Robberies per 100K people in 2020: 81.5 — 367th highest of 1,122 cities
> 1-yr. change in all violent crime per 100k people: +82.5 — 153rd highest of 1,119 cities
> Violent crimes per 100K people in 2020: 340.7 — 484th highest of 1,121 cities
> Population: 33,326
[in-text-ad]

44. Dubuque, Iowa
> 1-yr. change in reported robberies per 100K: +29.4
> Robberies reported in 2020: 26 — 526th lowest of 1,122 cities (tied)
> Robberies per 100K people in 2020: 44.9 — 494th lowest of 1,122 cities
> 1-yr. change in all violent crime per 100k people: +209.2 — 27th highest of 1,119 cities
> Violent crimes per 100K people in 2020: 398.9 — 406th highest of 1,121 cities
> Population: 58,196
43. Watertown, New York
> 1-yr. change in reported robberies per 100K: +29.5
> Robberies reported in 2020: 21 — 454th lowest of 1,122 cities (tied)
> Robberies per 100K people in 2020: 85.3 — 353rd highest of 1,122 cities
> 1-yr. change in all violent crime per 100k people: +121.6 — 92nd highest of 1,119 cities
> Violent crimes per 100K people in 2020: 735.1 — 143rd highest of 1,121 cities
> Population: 25,622

42. Raleigh, North Carolina
> 1-yr. change in reported robberies per 100K: +29.7
> Robberies reported in 2020: 468 — 48th highest of 1,122 cities
> Robberies per 100K people in 2020: 97.0 — 304th highest of 1,122 cities
> 1-yr. change in all violent crime per 100k people: +136.4 — 75th highest of 1,119 cities
> Violent crimes per 100K people in 2020: 392.1 — 415th highest of 1,121 cities
> Population: 464,485
[in-text-ad-2]
41. Kenosha, Wisconsin
> 1-yr. change in reported robberies per 100K: +30.1
> Robberies reported in 2020: 83 — 252nd highest of 1,122 cities (tied)
> Robberies per 100K people in 2020: 83.0 — 365th highest of 1,122 cities
> 1-yr. change in all violent crime per 100k people: +80.8 — 157th highest of 1,119 cities
> Violent crimes per 100K people in 2020: 391.0 — 418th highest of 1,121 cities
> Population: 99,688

40. San Dimas, California
> 1-yr. change in reported robberies per 100K: +30.3
> Robberies reported in 2020: 25 — 510th lowest of 1,122 cities (tied)
> Robberies per 100K people in 2020: 74.3 — 409th highest of 1,122 cities
> 1-yr. change in all violent crime per 100k people: +17.6 — 460th highest of 1,119 cities
> Violent crimes per 100K people in 2020: 246.7 — 472nd lowest of 1,121 cities
> Population: 34,048
[in-text-ad]
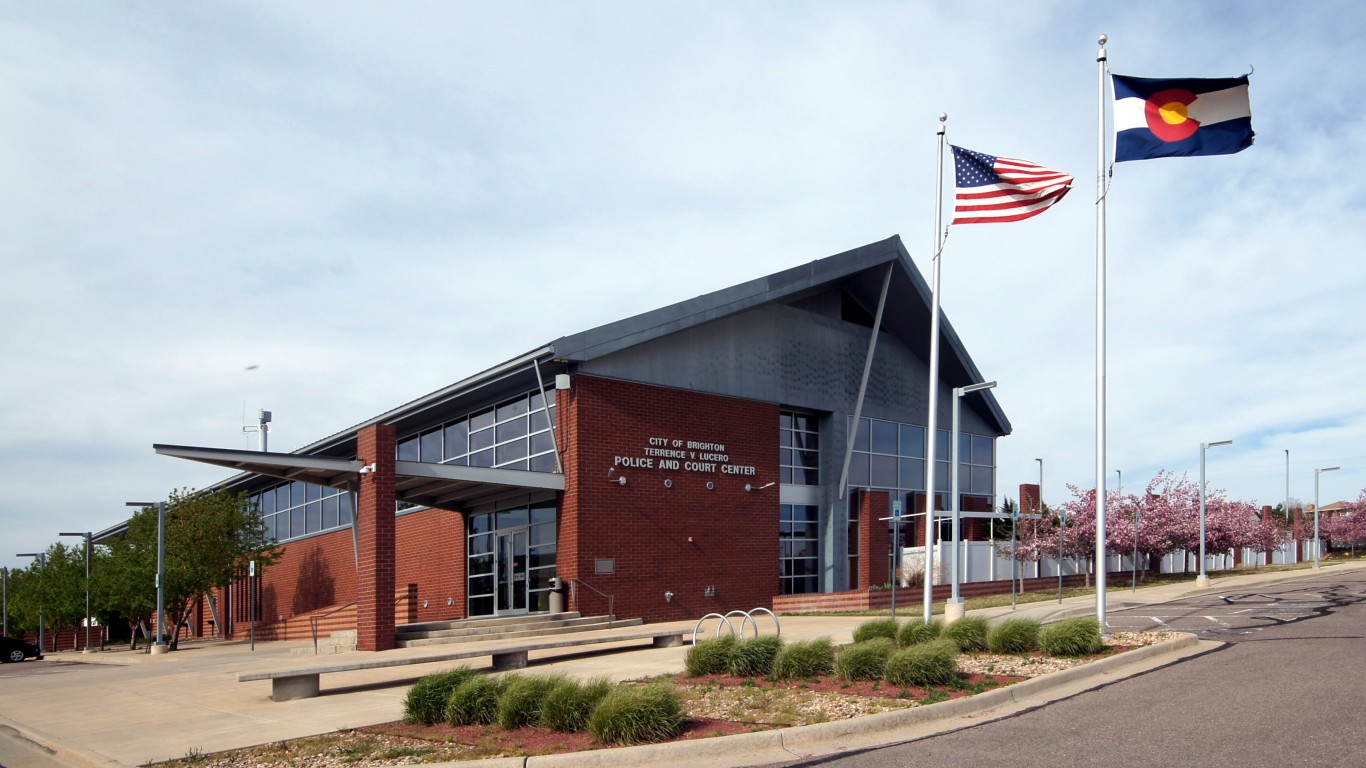
39. Brighton, Colorado
> 1-yr. change in reported robberies per 100K: +30.5
> Robberies reported in 2020: 18 — 412th lowest of 1,122 cities (tied)
> Robberies per 100K people in 2020: 42.3 — 471st lowest of 1,122 cities
> 1-yr. change in all violent crime per 100k people: +124.9 — 87th highest of 1,119 cities
> Violent crimes per 100K people in 2020: 451.4 — 345th highest of 1,121 cities
> Population: 39,836

38. Alexandria, Louisiana
> 1-yr. change in reported robberies per 100K: +32.2
> Robberies reported in 2020: 145 — 149th highest of 1,122 cities (tied)
> Robberies per 100K people in 2020: 315.3 — 14th highest of 1,122 cities
> 1-yr. change in all violent crime per 100k people: +278.6 — 12th highest of 1,119 cities
> Violent crimes per 100K people in 2020: 1,848.4 — 7th highest of 1,121 cities
> Population: 47,012

37. Lawndale, California
> 1-yr. change in reported robberies per 100K: +32.4
> Robberies reported in 2020: 50 — 391st highest of 1,122 cities (tied)
> Robberies per 100K people in 2020: 154.6 — 134th highest of 1,122 cities
> 1-yr. change in all violent crime per 100k people: +94.4 — 128th highest of 1,119 cities
> Violent crimes per 100K people in 2020: 476.1 — 315th highest of 1,121 cities
> Population: 32,819
[in-text-ad-2]
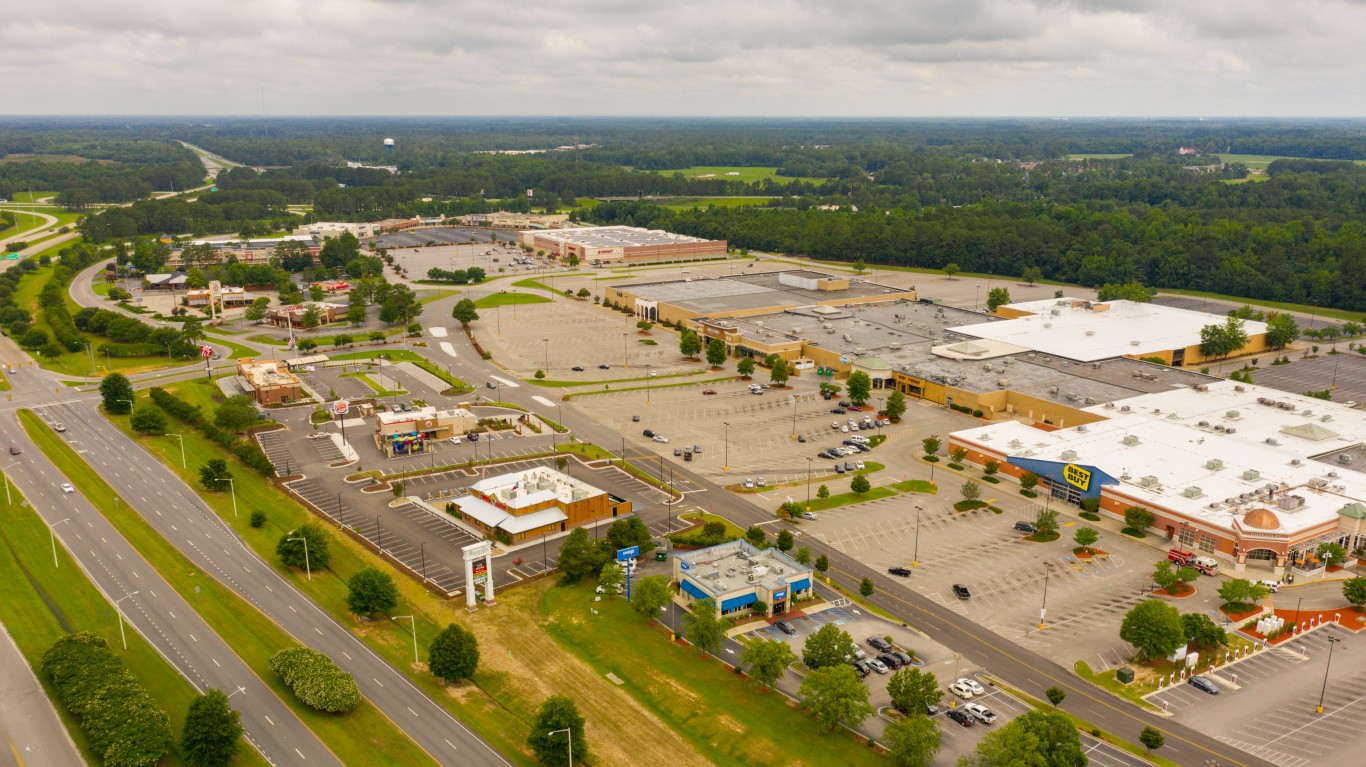
36. Florence, South Carolina
> 1-yr. change in reported robberies per 100K: +32.5
> Robberies reported in 2020: 72 — 293rd highest of 1,122 cities (tied)
> Robberies per 100K people in 2020: 186.5 — 83rd highest of 1,122 cities
> 1-yr. change in all violent crime per 100k people: +268.5 — 14th highest of 1,119 cities
> Violent crimes per 100K people in 2020: 1,456.1 — 15th highest of 1,121 cities
> Population: 38,487
35. Temple Terrace, Florida
> 1-yr. change in reported robberies per 100K: +33.1
> Robberies reported in 2020: 23 — 483rd lowest of 1,122 cities (tied)
> Robberies per 100K people in 2020: 85.5 — 350th highest of 1,122 cities
> 1-yr. change in all violent crime per 100k people: +2.1 — 507th lowest of 1,119 cities
> Violent crimes per 100K people in 2020: 267.8 — 518th lowest of 1,121 cities
> Population: 26,539
[in-text-ad]

34. Aurora, Colorado
> 1-yr. change in reported robberies per 100K: +33.3
> Robberies reported in 2020: 775 — 34th highest of 1,122 cities
> Robberies per 100K people in 2020: 200.9 — 66th highest of 1,122 cities
> 1-yr. change in all violent crime per 100k people: +165.0 — 49th highest of 1,119 cities
> Violent crimes per 100K people in 2020: 900.4 — 83rd highest of 1,121 cities
> Population: 369,111

33. Balch Springs, Texas
> 1-yr. change in reported robberies per 100K: +33.4
> Robberies reported in 2020: 41 — 455th highest of 1,122 cities (tied)
> Robberies per 100K people in 2020: 162.8 — 115th highest of 1,122 cities
> 1-yr. change in all violent crime per 100k people: +67.8 — 195th highest of 1,119 cities
> Violent crimes per 100K people in 2020: 714.6 — 148th highest of 1,121 cities
> Population: 25,190
32. Boulder, Colorado
> 1-yr. change in reported robberies per 100K: +33.4
> Robberies reported in 2020: 72 — 293rd highest of 1,122 cities (tied)
> Robberies per 100K people in 2020: 67.5 — 454th highest of 1,122 cities
> 1-yr. change in all violent crime per 100k people: +65.6 — 201st highest of 1,119 cities
> Violent crimes per 100K people in 2020: 321.8 — 517th highest of 1,121 cities
> Population: 106,392
[in-text-ad-2]
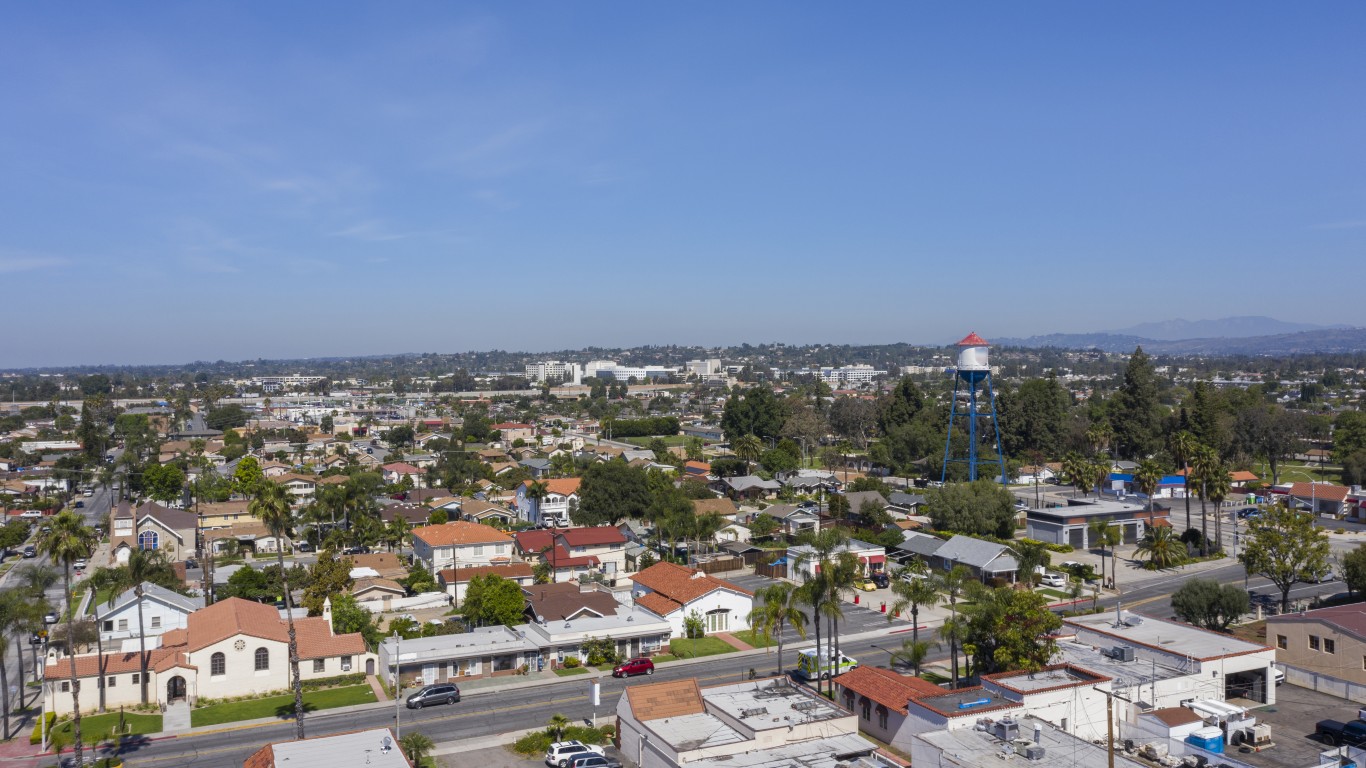
31. Placentia, California
> 1-yr. change in reported robberies per 100K: +33.7
> Robberies reported in 2020: 45 — 420th highest of 1,122 cities (tied)
> Robberies per 100K people in 2020: 87.8 — 341st highest of 1,122 cities
> 1-yr. change in all violent crime per 100k people: +81.6 — 156th highest of 1,119 cities
> Violent crimes per 100K people in 2020: 452.6 — 343rd highest of 1,121 cities
> Population: 51,818

30. Menlo Park, California
> 1-yr. change in reported robberies per 100K: +34.1
> Robberies reported in 2020: 25 — 510th lowest of 1,122 cities (tied)
> Robberies per 100K people in 2020: 71.4 — 425th highest of 1,122 cities
> 1-yr. change in all violent crime per 100k people: +5.2 — 549th lowest of 1,119 cities
> Violent crimes per 100K people in 2020: 148.6 — 282nd lowest of 1,121 cities
> Population: 34,138
[in-text-ad]

29. Merced, California
> 1-yr. change in reported robberies per 100K: +35.1
> Robberies reported in 2020: 133 — 161st highest of 1,122 cities
> Robberies per 100K people in 2020: 158.0 — 125th highest of 1,122 cities
> 1-yr. change in all violent crime per 100k people: +154.2 — 60th highest of 1,119 cities
> Violent crimes per 100K people in 2020: 798.1 — 119th highest of 1,121 cities
> Population: 82,662

28. Morrisville, North Carolina
> 1-yr. change in reported robberies per 100K: +36.0
> Robberies reported in 2020: 13 — 314th lowest of 1,122 cities (tied)
> Robberies per 100K people in 2020: 43.0 — 477th lowest of 1,122 cities
> 1-yr. change in all violent crime per 100k people: +37.6 — 312th highest of 1,119 cities
> Violent crimes per 100K people in 2020: 79.3 — 112th lowest of 1,121 cities
> Population: 26,280

27. Chattanooga, Tennessee
> 1-yr. change in reported robberies per 100K: +37.7
> Robberies reported in 2020: 268 — 84th highest of 1,122 cities (tied)
> Robberies per 100K people in 2020: 145.5 — 149th highest of 1,122 cities
> 1-yr. change in all violent crime per 100k people: +289.2 — 10th highest of 1,119 cities
> Violent crimes per 100K people in 2020: 1,359.3 — 24th highest of 1,121 cities
> Population: 179,690
[in-text-ad-2]
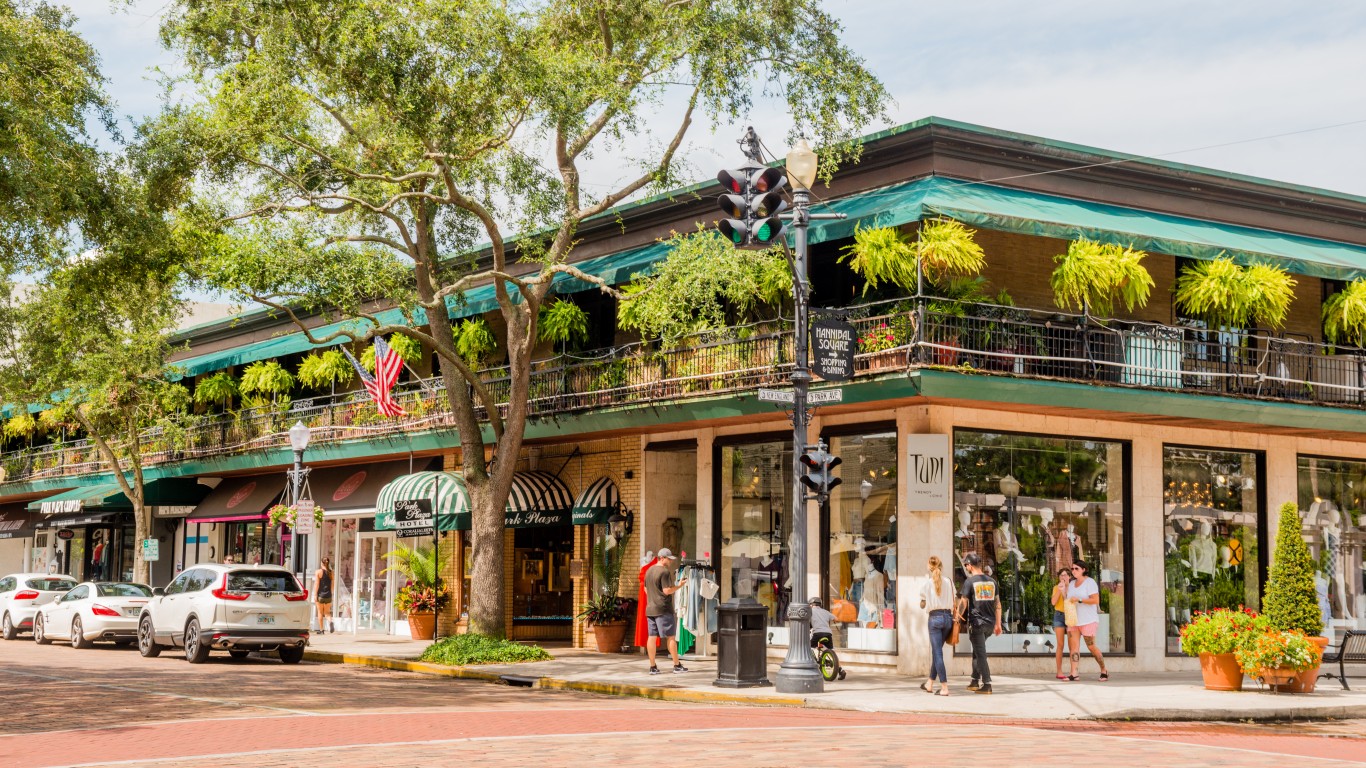
26. Winter Park, Florida
> 1-yr. change in reported robberies per 100K: +38.9
> Robberies reported in 2020: 25 — 510th lowest of 1,122 cities (tied)
> Robberies per 100K people in 2020: 80.2 — 374th highest of 1,122 cities
> 1-yr. change in all violent crime per 100k people: +56.7 — 237th highest of 1,119 cities
> Violent crimes per 100K people in 2020: 279.0 — 535th lowest of 1,121 cities
> Population: 30,522

25. Campbell, California
> 1-yr. change in reported robberies per 100K: +39.1
> Robberies reported in 2020: 37 — 493rd highest of 1,122 cities (tied)
> Robberies per 100K people in 2020: 88.3 — 339th highest of 1,122 cities
> 1-yr. change in all violent crime per 100k people: +54.0 — 249th highest of 1,119 cities
> Violent crimes per 100K people in 2020: 262.4 — 505th lowest of 1,121 cities
> Population: 42,221
[in-text-ad]

24. Murray, Utah
> 1-yr. change in reported robberies per 100K: +39.2
> Robberies reported in 2020: 50 — 391st highest of 1,122 cities (tied)
> Robberies per 100K people in 2020: 101.7 — 286th highest of 1,122 cities
> 1-yr. change in all violent crime per 100k people: +42.9 — 286th highest of 1,119 cities
> Violent crimes per 100K people in 2020: 482.0 — 306th highest of 1,121 cities
> Population: 49,105

23. Ridgecrest, California
> 1-yr. change in reported robberies per 100K: +41.2
> Robberies reported in 2020: 19 — 424th lowest of 1,122 cities (tied)
> Robberies per 100K people in 2020: 65.2 — 471st highest of 1,122 cities
> 1-yr. change in all violent crime per 100k people: +54.6 — 244th highest of 1,119 cities
> Violent crimes per 100K people in 2020: 542.6 — 245th highest of 1,121 cities
> Population: 28,755
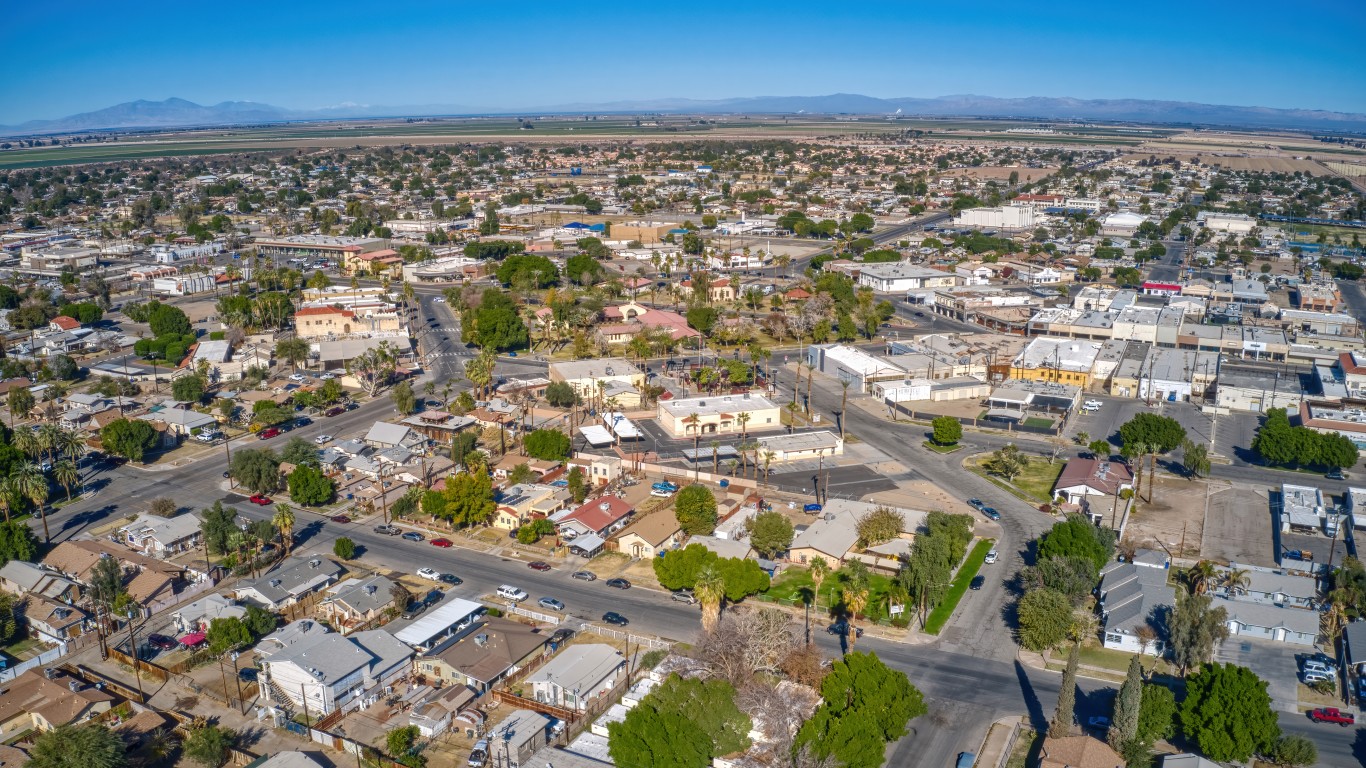
22. Brawley, California
> 1-yr. change in reported robberies per 100K: +41.7
> Robberies reported in 2020: 19 — 424th lowest of 1,122 cities (tied)
> Robberies per 100K people in 2020: 72.1 — 418th highest of 1,122 cities
> 1-yr. change in all violent crime per 100k people: -3.5 — 441st lowest of 1,119 cities
> Violent crimes per 100K people in 2020: 455.2 — 338th highest of 1,121 cities
> Population: 26,076
[in-text-ad-2]

21. Salt Lake City, Utah
> 1-yr. change in reported robberies per 100K: +41.8
> Robberies reported in 2020: 487 — 47th highest of 1,122 cities
> Robberies per 100K people in 2020: 240.9 — 39th highest of 1,122 cities
> 1-yr. change in all violent crime per 100k people: +210.1 — 26th highest of 1,119 cities
> Violent crimes per 100K people in 2020: 922.4 — 74th highest of 1,121 cities
> Population: 197,756
20. Cleveland, Tennessee
> 1-yr. change in reported robberies per 100K: +42.4
> Robberies reported in 2020: 62 — 340th highest of 1,122 cities (tied)
> Robberies per 100K people in 2020: 134.8 — 168th highest of 1,122 cities
> 1-yr. change in all violent crime per 100k people: -33.7 — 220th lowest of 1,119 cities
> Violent crimes per 100K people in 2020: 987.1 — 59th highest of 1,121 cities
> Population: 44,595
[in-text-ad]
19. West Springfield Town, Massachusetts
> 1-yr. change in reported robberies per 100K: +42.6
> Robberies reported in 2020: 27 — 541st lowest of 1,122 cities (tied)
> Robberies per 100K people in 2020: 94.9 — 314th highest of 1,122 cities
> 1-yr. change in all violent crime per 100k people: -10.8 — 371st lowest of 1,119 cities
> Violent crimes per 100K people in 2020: 471.2 — 320th highest of 1,121 cities
> Population: 28,609
18. Fridley, Minnesota
> 1-yr. change in reported robberies per 100K: +42.8
> Robberies reported in 2020: 32 — 530th highest of 1,122 cities (tied)
> Robberies per 100K people in 2020: 114.7 — 232nd highest of 1,122 cities
> 1-yr. change in all violent crime per 100k people: +24.1 — 407th highest of 1,119 cities
> Violent crimes per 100K people in 2020: 340.6 — 486th highest of 1,121 cities
> Population: 27,668

17. Racine, Wisconsin
> 1-yr. change in reported robberies per 100K: +43.7
> Robberies reported in 2020: 86 — 239th highest of 1,122 cities (tied)
> Robberies per 100K people in 2020: 112.3 — 241st highest of 1,122 cities
> 1-yr. change in all violent crime per 100k people: +164.1 — 50th highest of 1,119 cities
> Violent crimes per 100K people in 2020: 540.7 — 248th highest of 1,121 cities
> Population: 77,081
[in-text-ad-2]
16. Rochester, New Hampshire
> 1-yr. change in reported robberies per 100K: +43.8
> Robberies reported in 2020: 25 — 510th lowest of 1,122 cities (tied)
> Robberies per 100K people in 2020: 78.7 — 380th highest of 1,122 cities
> 1-yr. change in all violent crime per 100k people: -71.5 — 91st lowest of 1,119 cities
> Violent crimes per 100K people in 2020: 226.7 — 440th lowest of 1,121 cities
> Population: 30,955
15. Lebanon, Tennessee
> 1-yr. change in reported robberies per 100K: +44.0
> Robberies reported in 2020: 26 — 526th lowest of 1,122 cities (tied)
> Robberies per 100K people in 2020: 68.7 — 446th highest of 1,122 cities
> 1-yr. change in all violent crime per 100k people: +160.9 — 56th highest of 1,119 cities
> Violent crimes per 100K people in 2020: 570.9 — 223rd highest of 1,121 cities
> Population: 33,159
[in-text-ad]

14. Spartanburg, South Carolina
> 1-yr. change in reported robberies per 100K: +46.9
> Robberies reported in 2020: 94 — 222nd highest of 1,122 cities (tied)
> Robberies per 100K people in 2020: 250.9 — 33rd highest of 1,122 cities
> 1-yr. change in all violent crime per 100k people: +243.9 — 17th highest of 1,119 cities
> Violent crimes per 100K people in 2020: 1,430.5 — 19th highest of 1,121 cities
> Population: 37,424

13. Rapid City, South Dakota
> 1-yr. change in reported robberies per 100K: +48.7
> Robberies reported in 2020: 104 — 200th highest of 1,122 cities (tied)
> Robberies per 100K people in 2020: 132.5 — 174th highest of 1,122 cities
> 1-yr. change in all violent crime per 100k people: +150.1 — 61st highest of 1,119 cities
> Violent crimes per 100K people in 2020: 857.4 — 94th highest of 1,121 cities
> Population: 75,258
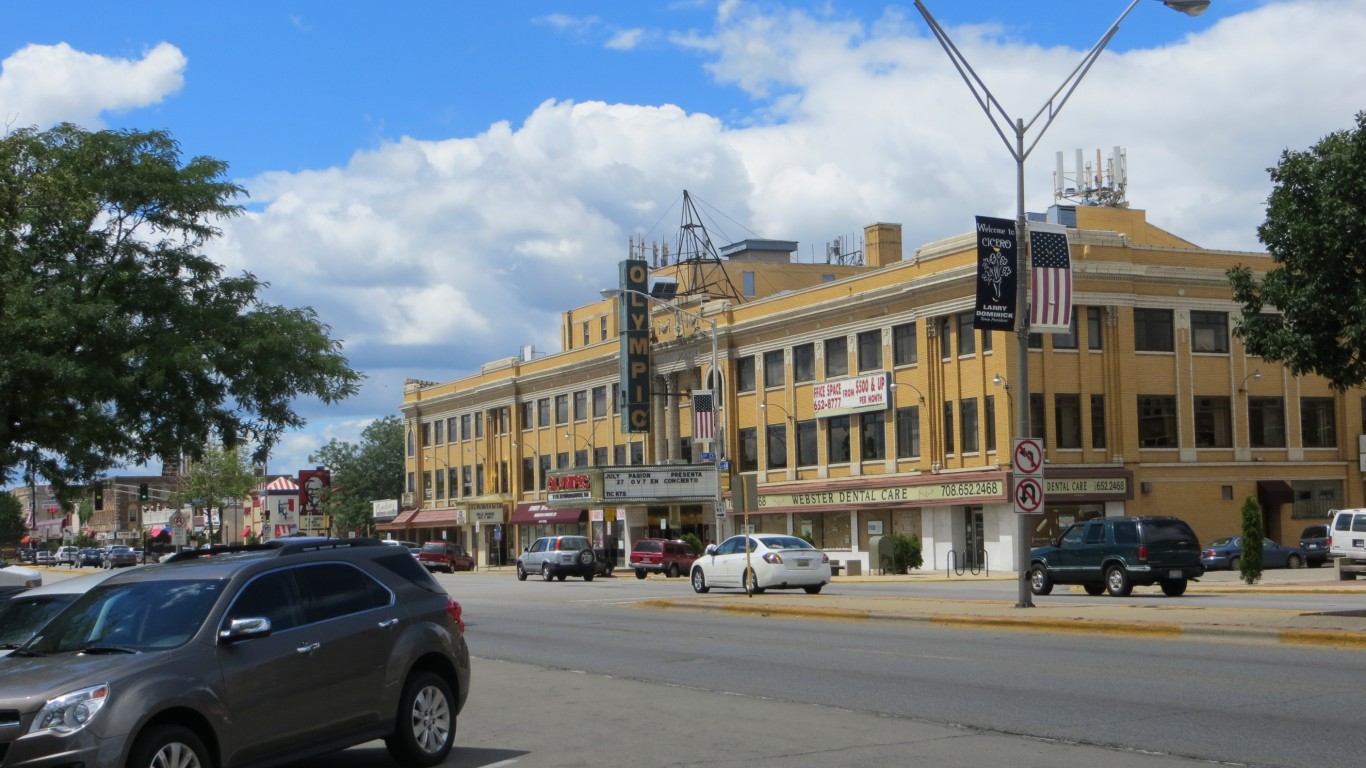
12. Cicero, Illinois
> 1-yr. change in reported robberies per 100K: +52.1
> Robberies reported in 2020: 126 — 164th highest of 1,122 cities (tied)
> Robberies per 100K people in 2020: 156.7 — 127th highest of 1,122 cities
> 1-yr. change in all violent crime per 100k people: +86.7 — 142nd highest of 1,119 cities
> Violent crimes per 100K people in 2020: 404.1 — 400th highest of 1,121 cities
> Population: 82,330
[in-text-ad-2]
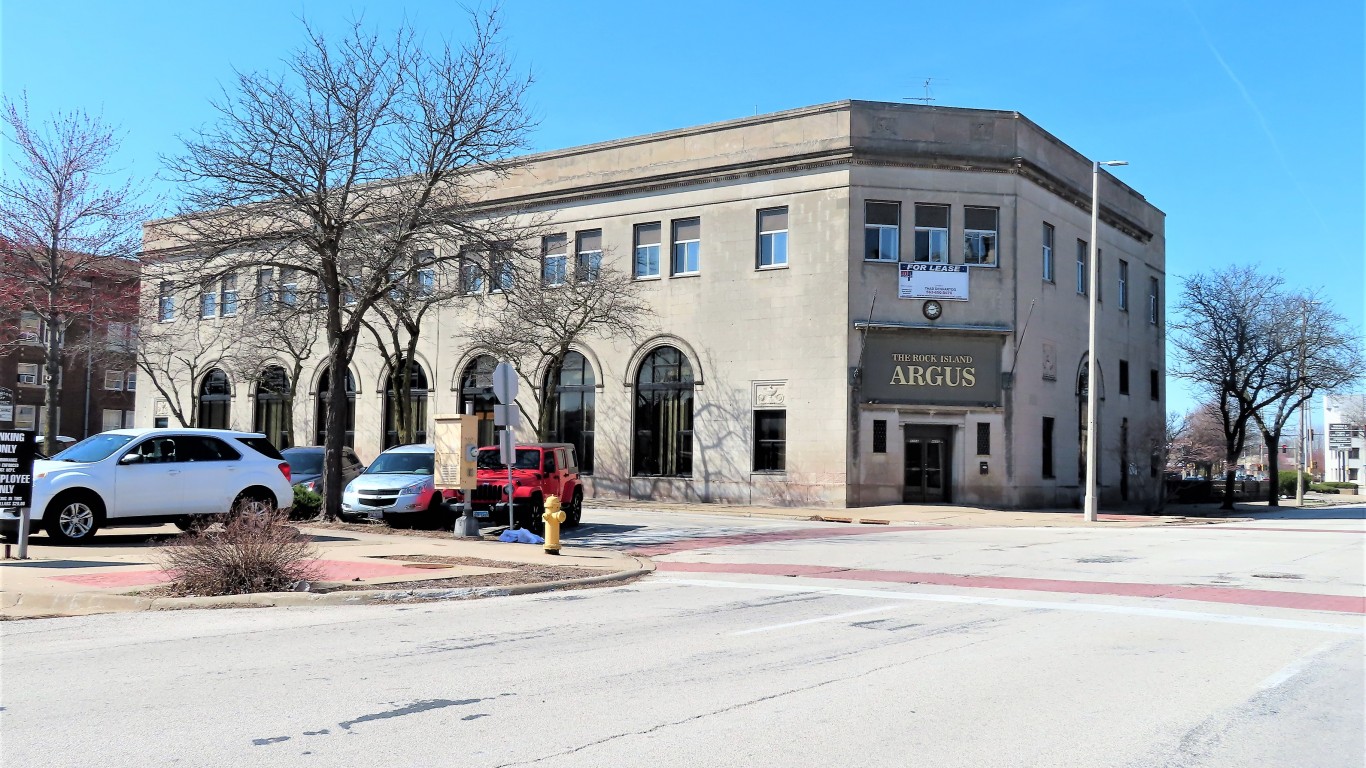
11. Rock Island, Illinois
> 1-yr. change in reported robberies per 100K: +57.9
> Robberies reported in 2020: 50 — 391st highest of 1,122 cities (tied)
> Robberies per 100K people in 2020: 135.2 — 165th highest of 1,122 cities
> 1-yr. change in all violent crime per 100k people: +205.5 — 28th highest of 1,119 cities
> Violent crimes per 100K people in 2020: 576.0 — 216th highest of 1,121 cities
> Population: 38,111

10. St. Paul, Minnesota
> 1-yr. change in reported robberies per 100K: +58.6
> Robberies reported in 2020: 723 — 38th highest of 1,122 cities
> Robberies per 100K people in 2020: 233.3 — 43rd highest of 1,122 cities
> 1-yr. change in all violent crime per 100k people: +184.0 — 39th highest of 1,119 cities
> Violent crimes per 100K people in 2020: 748.7 — 136th highest of 1,121 cities
> Population: 304,547
[in-text-ad]
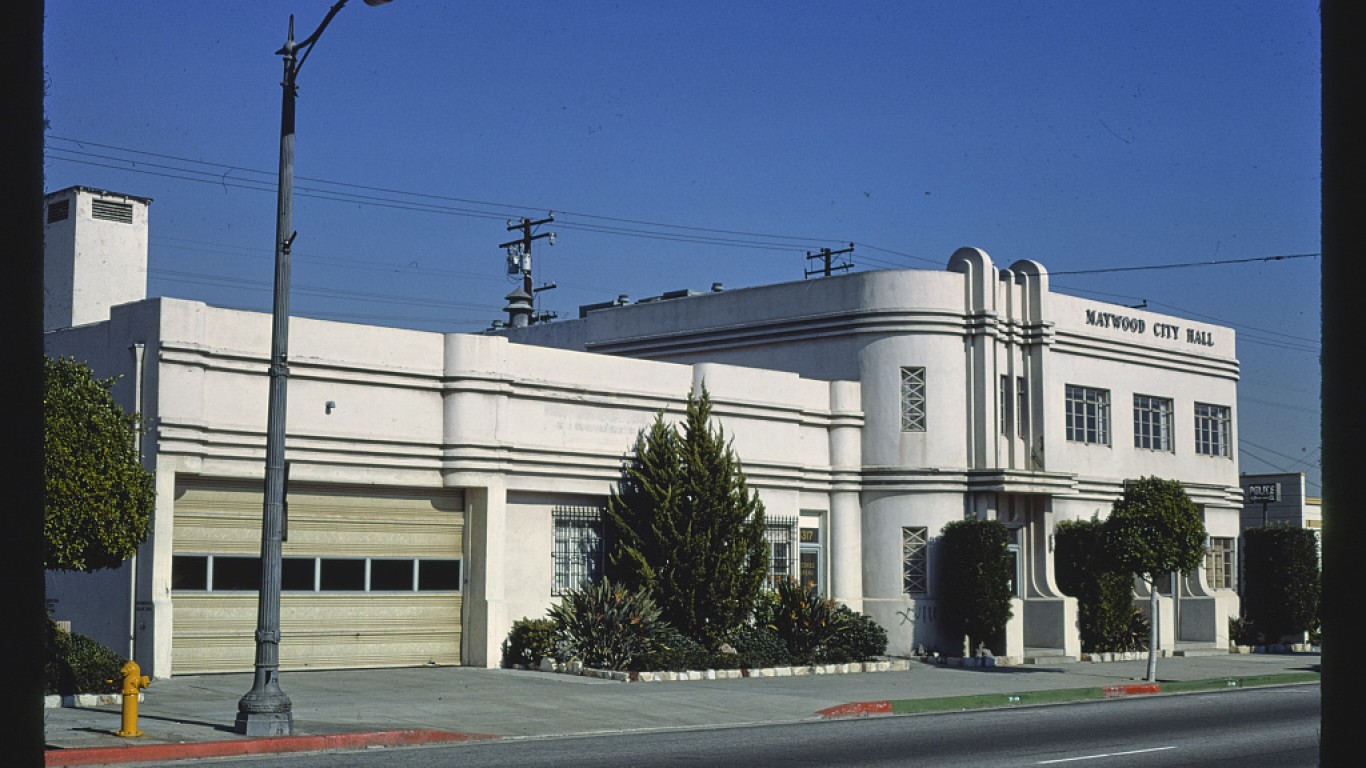
9. Maywood, California
> 1-yr. change in reported robberies per 100K: +64.3
> Robberies reported in 2020: 40 — 461st highest of 1,122 cities (tied)
> Robberies per 100K people in 2020: 148.5 — 145th highest of 1,122 cities
> 1-yr. change in all violent crime per 100k people: +104.7 — 112th highest of 1,119 cities
> Violent crimes per 100K people in 2020: 434.5 — 366th highest of 1,121 cities
> Population: 27,332
8. Roseville, Minnesota
> 1-yr. change in reported robberies per 100K: +68.4
> Robberies reported in 2020: 59 — 351st highest of 1,122 cities (tied)
> Robberies per 100K people in 2020: 160.9 — 119th highest of 1,122 cities
> 1-yr. change in all violent crime per 100k people: +90.4 — 137th highest of 1,119 cities
> Violent crimes per 100K people in 2020: 316.3 — 529th highest of 1,121 cities
> Population: 36,026
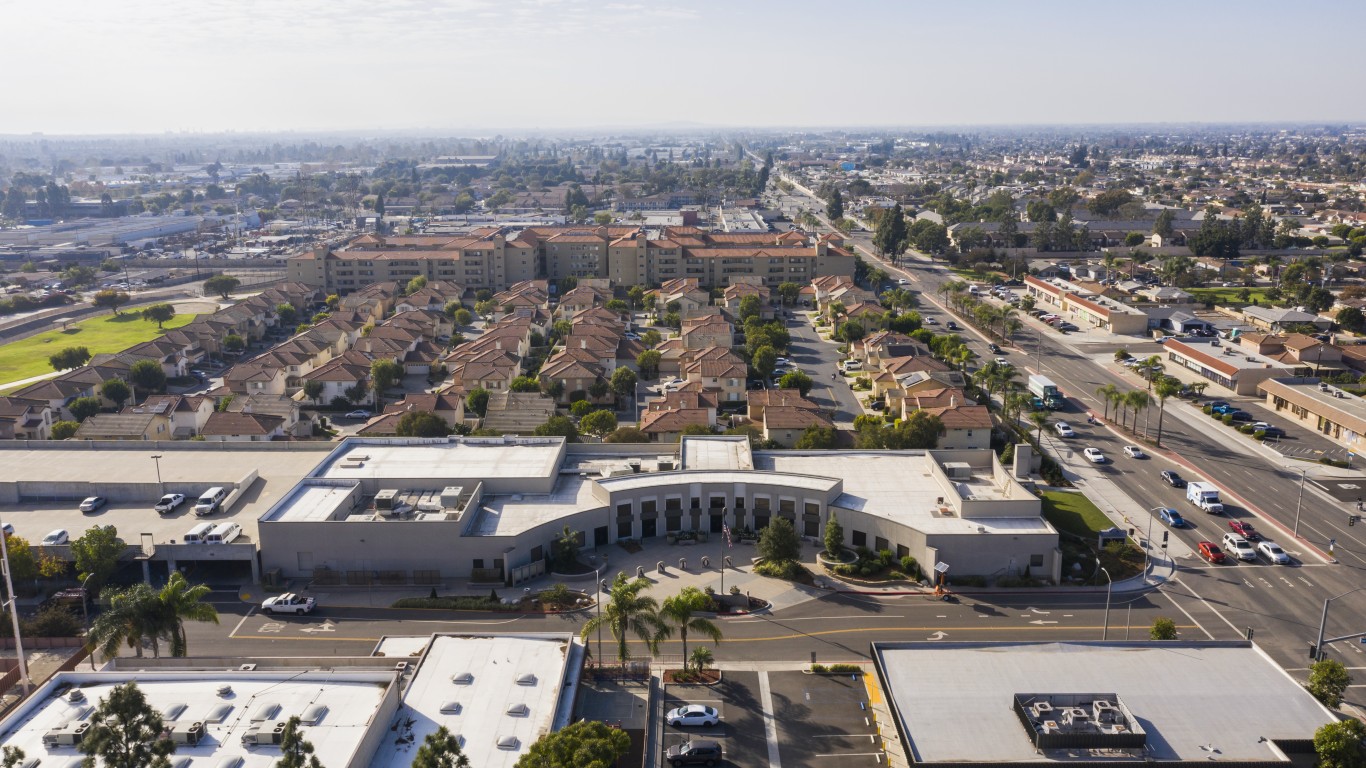
7. Stanton, California
> 1-yr. change in reported robberies per 100K: +68.4
> Robberies reported in 2020: 57 — 363rd highest of 1,122 cities (tied)
> Robberies per 100K people in 2020: 149.3 — 143rd highest of 1,122 cities
> 1-yr. change in all violent crime per 100k people: +87.2 — 141st highest of 1,119 cities
> Violent crimes per 100K people in 2020: 335.4 — 492nd highest of 1,121 cities
> Population: 38,377
[in-text-ad-2]
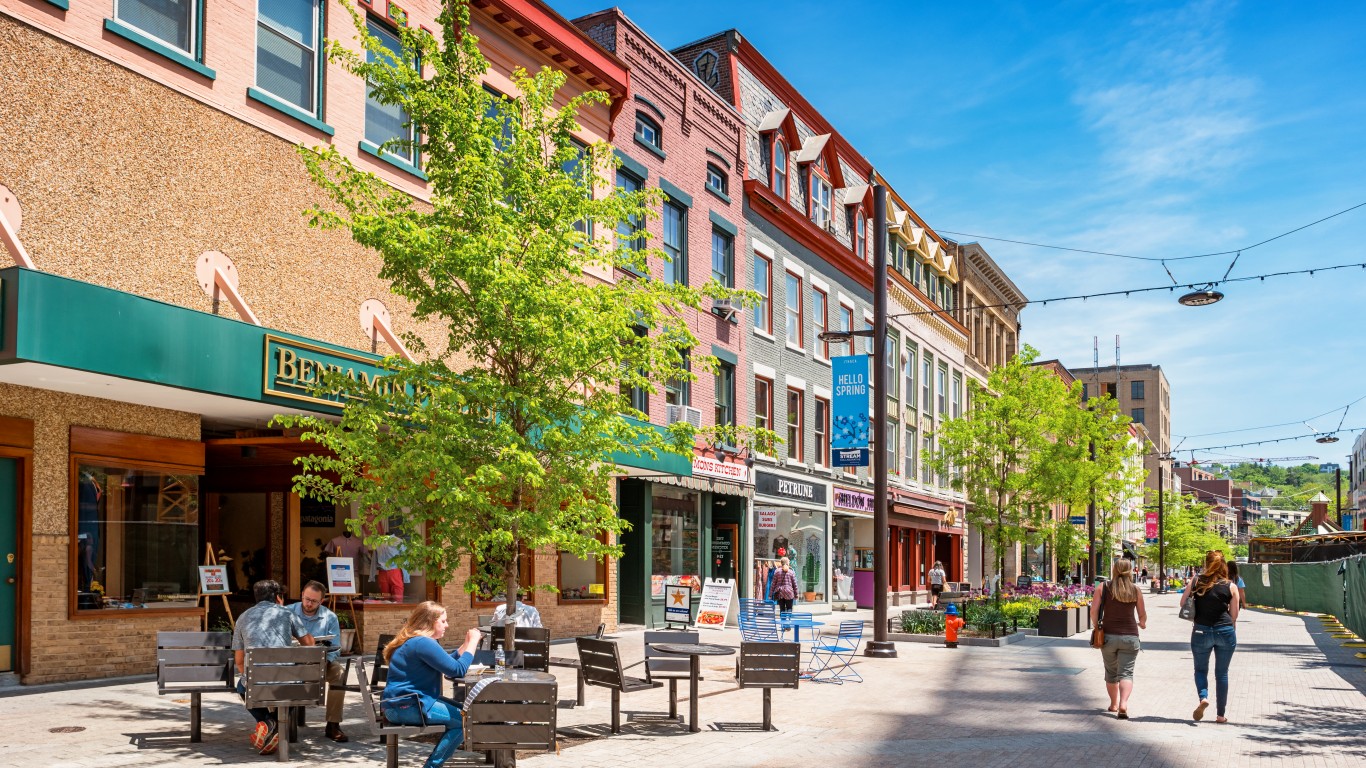
6. Ithaca, New York
> 1-yr. change in reported robberies per 100K: +71.3
> Robberies reported in 2020: 31 — 538th highest of 1,122 cities (tied)
> Robberies per 100K people in 2020: 100.2 — 291st highest of 1,122 cities
> 1-yr. change in all violent crime per 100k people: +185.1 — 36th highest of 1,119 cities
> Violent crimes per 100K people in 2020: 316.9 — 528th highest of 1,121 cities
> Population: 30,569

5. North Charleston, South Carolina
> 1-yr. change in reported robberies per 100K: +72.0
> Robberies reported in 2020: 318 — 69th highest of 1,122 cities
> Robberies per 100K people in 2020: 270.6 — 27th highest of 1,122 cities
> 1-yr. change in all violent crime per 100k people: +178.6 — 42nd highest of 1,119 cities
> Violent crimes per 100K people in 2020: 1,144.7 — 43rd highest of 1,121 cities
> Population: 111,501
[in-text-ad]

4. Des Moines, Washington
> 1-yr. change in reported robberies per 100K: +76.7
> Robberies reported in 2020: 56 — 368th highest of 1,122 cities (tied)
> Robberies per 100K people in 2020: 171.5 — 102nd highest of 1,122 cities
> 1-yr. change in all violent crime per 100k people: +70.9 — 188th highest of 1,119 cities
> Violent crimes per 100K people in 2020: 333.8 — 496th highest of 1,121 cities
> Population: 31,734

3. South Salt Lake, Utah
> 1-yr. change in reported robberies per 100K: +91.4
> Robberies reported in 2020: 73 — 289th highest of 1,122 cities (tied)
> Robberies per 100K people in 2020: 282.8 — 23rd highest of 1,122 cities
> 1-yr. change in all violent crime per 100k people: +163.7 — 52nd highest of 1,119 cities
> Violent crimes per 100K people in 2020: 964.5 — 64th highest of 1,121 cities
> Population: 25,017
2. Melrose Park, Illinois
> 1-yr. change in reported robberies per 100K: +94.1
> Robberies reported in 2020: 40 — 461st highest of 1,122 cities (tied)
> Robberies per 100K people in 2020: 162.4 — 118th highest of 1,122 cities
> 1-yr. change in all violent crime per 100k people: +35.4 — 328th highest of 1,119 cities
> Violent crimes per 100K people in 2020: 333.0 — 498th highest of 1,121 cities
> Population: 25,605
[in-text-ad-2]

1. Minneapolis, Minnesota
> 1-yr. change in reported robberies per 100K: +110.5
> Robberies reported in 2020: 1,782 — 14th highest of 1,122 cities
> Robberies per 100K people in 2020: 409.5 — 4th highest of 1,122 cities
> 1-yr. change in all violent crime per 100k people: +229.1 — 21st highest of 1,119 cities
> Violent crimes per 100K people in 2020: 1,154.9 — 41st highest of 1,121 cities
> Population: 420,324
Methodology
To determine the cities where the robbery rate is rising, 24/7 Wall St. reviewed the change in robbery rate per 100,000 people from the FBI’s 2019 and 2020 Uniform Crime Reports.
We included cities that have more than 25,000 people based on five-year estimates from the U.S. Census Bureau’s 2019 American Community Survey. Limited data was available in the 2020 UCR for areas in Alabama, Maryland, Pennsylvania, and Illinois, though cities in these states were not excluded from analysis. Because some state and local agencies changed reporting practices between 2019 and 2020, the figures are not comparable, and these areas were excluded.
Population figures are five-year estimates from the U.S. Census Bureau’s 2019 American Community Survey. However, these estimates were not used to calculate crime rates. Crime rates per 100,000 people were calculated using population figures provided by the FBI in the 2020 and 2019 UCR.
Take Charge of Your Retirement In Just A Few Minutes (Sponsor)
Retirement planning doesn’t have to feel overwhelming. The key is finding expert guidance—and SmartAsset’s made it easier than ever for you to connect with a vetted financial advisor.
Here’s how it works:
- Answer a Few Simple Questions. Tell us a bit about your goals and preferences—it only takes a few minutes!
- Get Matched with Vetted Advisors Our smart tool matches you with up to three pre-screened, vetted advisors who serve your area and are held to a fiduciary standard to act in your best interests. Click here to begin
- Choose Your Fit Review their profiles, schedule an introductory call (or meet in person), and select the advisor who feel is right for you.
Why wait? Start building the retirement you’ve always dreamed of. Click here to get started today!
Thank you for reading! Have some feedback for us?
Contact the 24/7 Wall St. editorial team.
 24/7 Wall St.
 24/7 Wall St.
 24/7 Wall St.