Special Report
American Towns Where the Robbery Rate Is Falling

Published:
Last Updated:

Driven by a surge in homicides and an increase in cases of aggravated assault, the U.S. violent crime rate rose in 2020, according to data from the FBI. One bright spot in the latest data was a decline in reported robberies. In a continuation of a multi-decade trend, the number of robberies committed in the U.S. fell by 9%, from about 268,500 in 2019 to 243,600 in 2020.
According to the FBI, robbery is a crime in which force or the threat of force or violence is used to take, or attempt to take, anything of value from another person. The largest share of robberies in the United States are committed on streets or sidewalks. Handguns are the most commonly used weapon in robberies, and more often than not, among the cases where a suspect can be identified, the offender and victim are strangers to one another.
The decline in the national robbery rate is being led by particularly steep drops in certain American towns.
Using data from the FBI, 24/7 Wall St. identified the 50 American towns where the robbery rate is falling fastest. Towns – defined as places with populations between 2,500 and 25,000 people or more – are ranked by the year-over-year change in the number of robberies per 100,000 people. Among the towns on this list, robbery rates have fallen by as much as 394 incidents per 100,000 people. For context, the U.S. robbery rate fell by 8 incidents per 100,000 in 2020.
Robbery – along with rаpe, aggravated assault, and homicide – is one component of the overall violent crime category. Even though robbery accounts for only a small percentage of all violent crimes, most of the towns on this list also reported a decline in violent crime overall in 2020. Here is a look at the states where crime is soaring.
The majority of towns on this list are in the South, including eight in North Carolina alone. In over half of the towns on this list, the robbery rate is lower than the national rate of 74 incidents per 100,000 people. One year earlier, each of these towns had a higher than average robbery rate. Here is a look at the states with the highest robbery rates.
Click here to see the American towns where the robbery rate is falling
Click here to read our detailed methodology
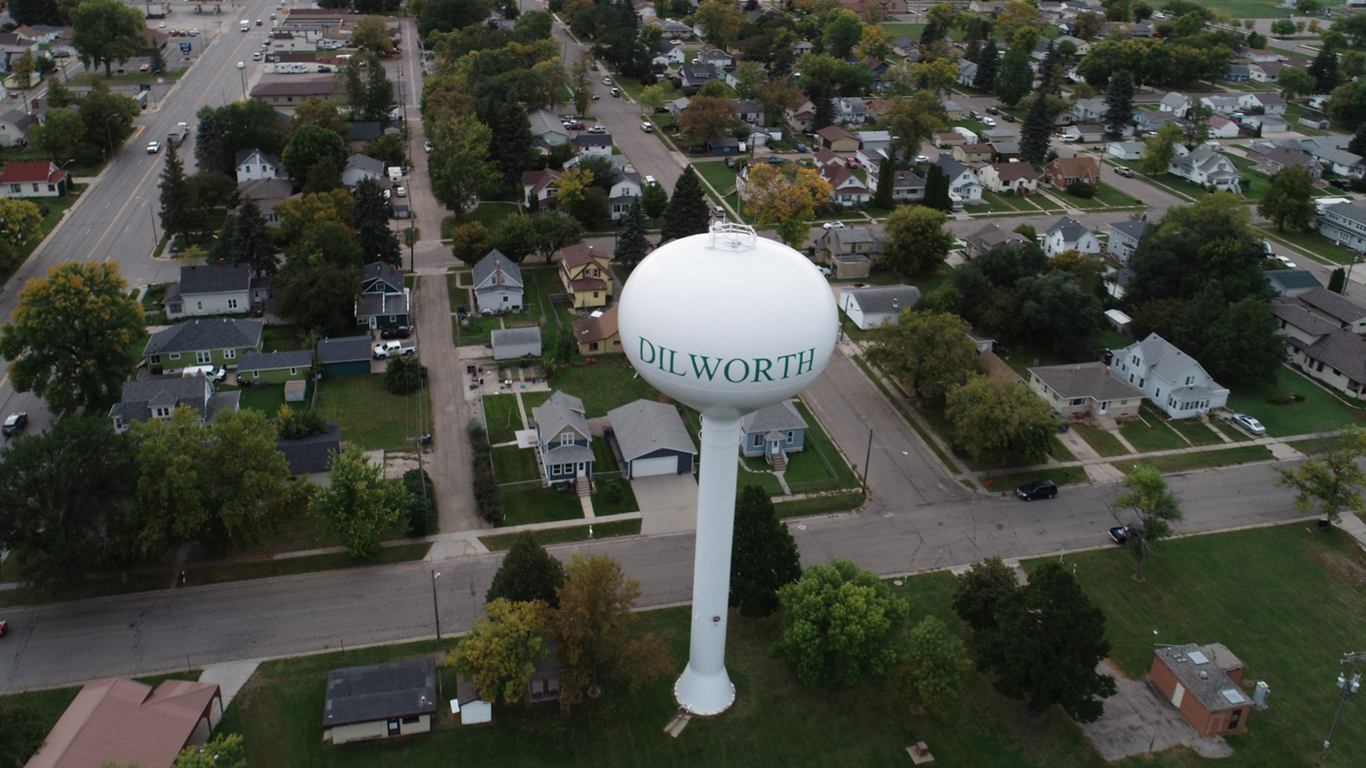
50. Dilworth, Minnesota
> Change in reported robbery rate, 2019-2020: -89.0
> Robberies reported in 2020: 1 — 1,127th lowest of 2,901 towns (tied)
> Robberies per 100K people in 2020: 22.4 — 1,146th highest of 2,901 towns
> 1-yr. change in all violent crime per 100k people: +67.8 — 705th highest of 2,893 towns
> Violent crimes per 100K people in 2020: 201.4 — 1,369th highest of 2,899 towns
> Population: 4,410
[in-text-ad]
49. Springfield, Florida
> Change in reported robbery rate, 2019-2020: -89.8
> Robberies reported in 2020: 4 — 595th highest of 2,901 towns (tied)
> Robberies per 100K people in 2020: 46.8 — 587th highest of 2,901 towns
> 1-yr. change in all violent crime per 100k people: +131.4 — 377th highest of 2,893 towns
> Violent crimes per 100K people in 2020: 667.3 — 261st highest of 2,899 towns
> Population: 9,319
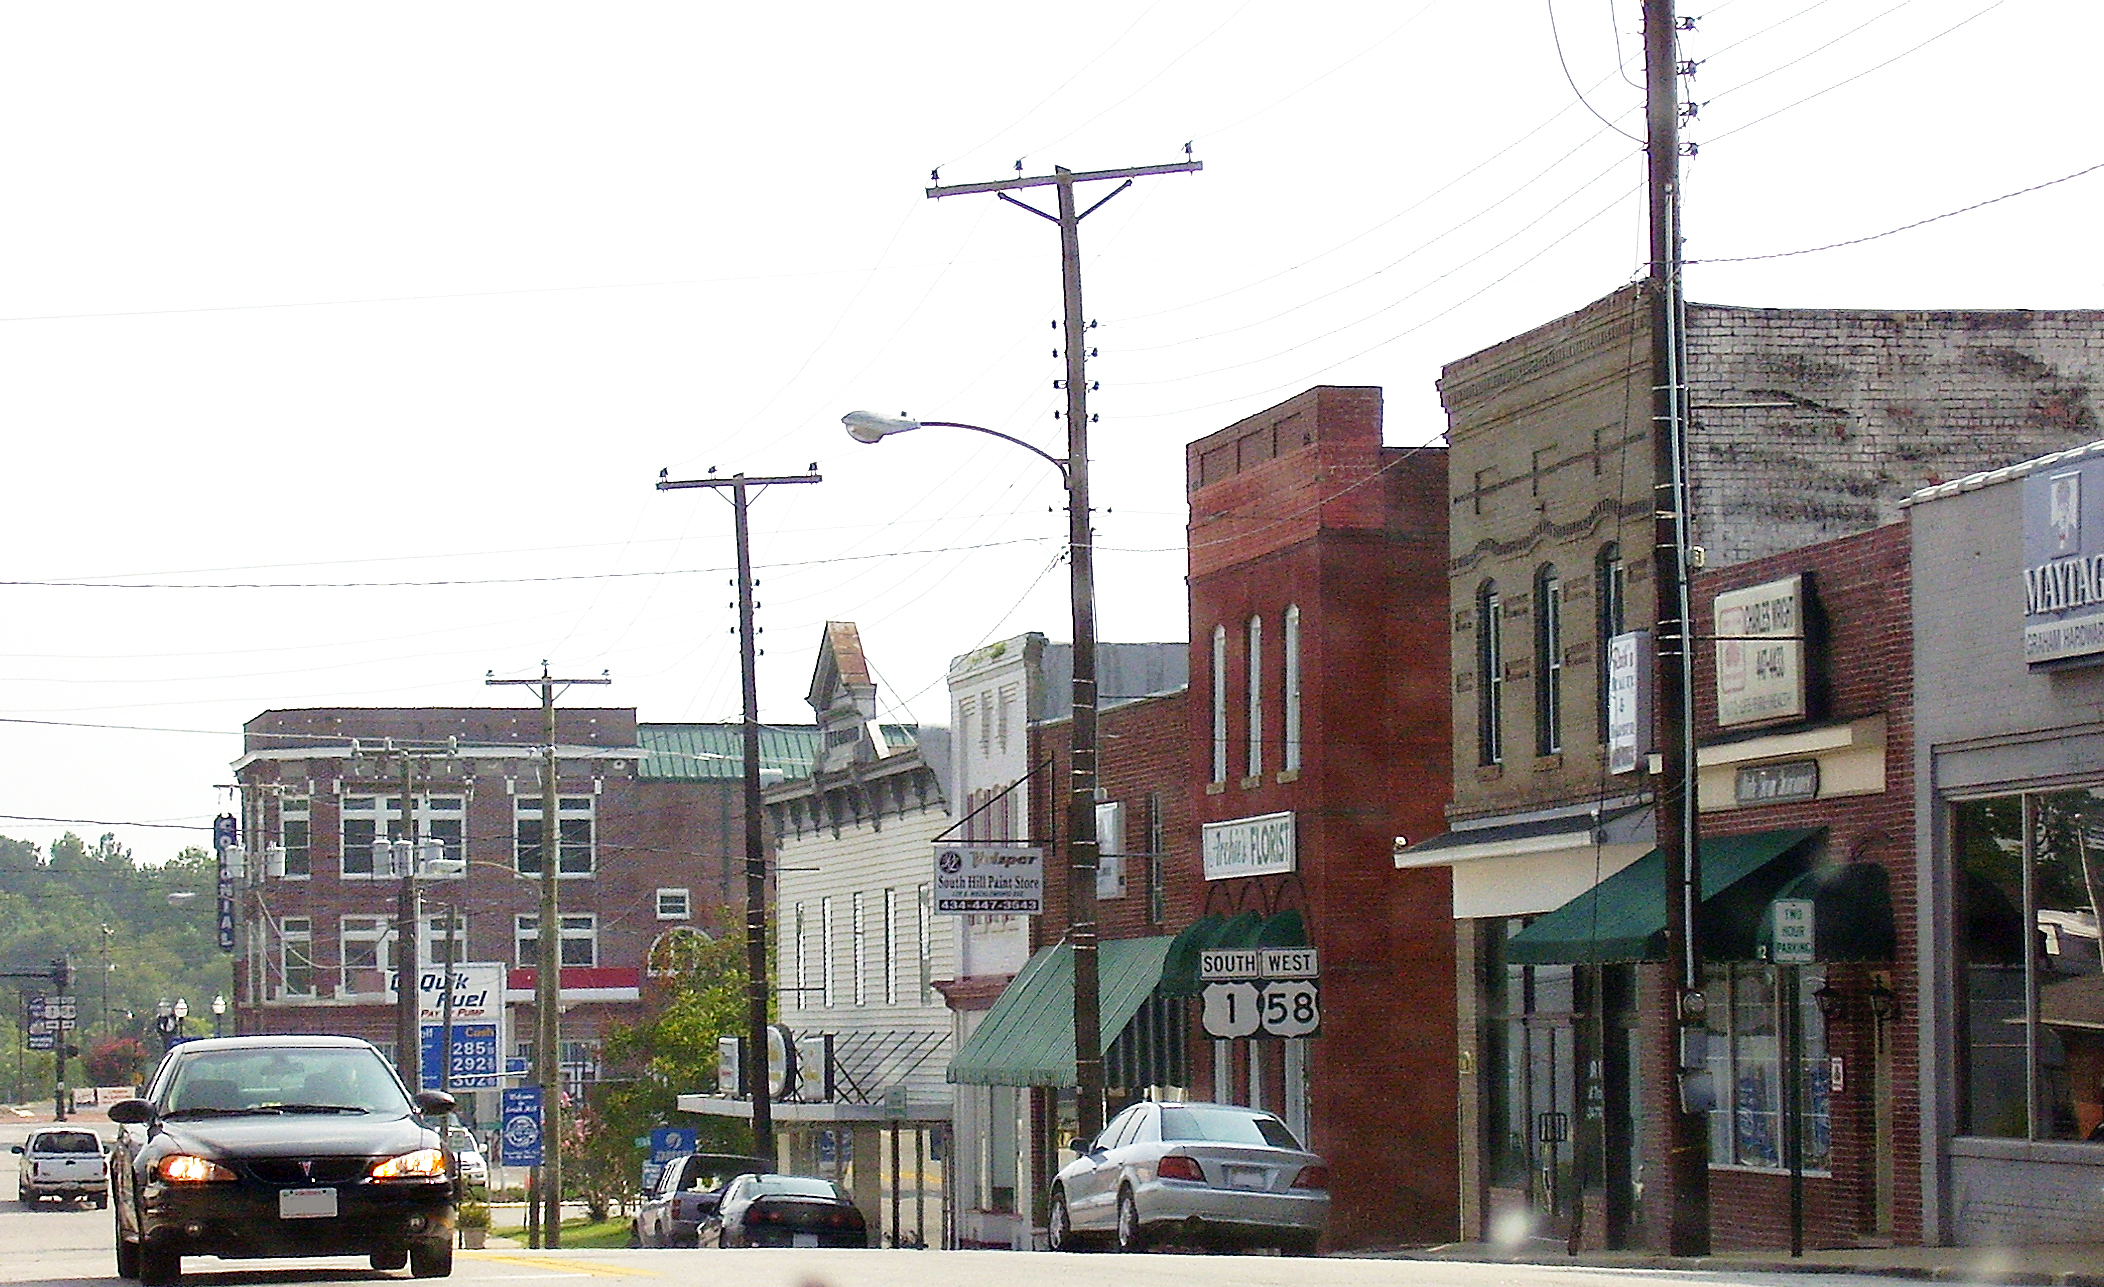
48. South Hill, Virginia
> Change in reported robbery rate, 2019-2020: -92.1
> Robberies reported in 2020: 3 — 731st highest of 2,901 towns (tied)
> Robberies per 100K people in 2020: 69.4 — 348th highest of 2,901 towns
> 1-yr. change in all violent crime per 100k people: +301.3 — 92nd highest of 2,893 towns
> Violent crimes per 100K people in 2020: 485.9 — 449th highest of 2,899 towns
> Population: 4,377
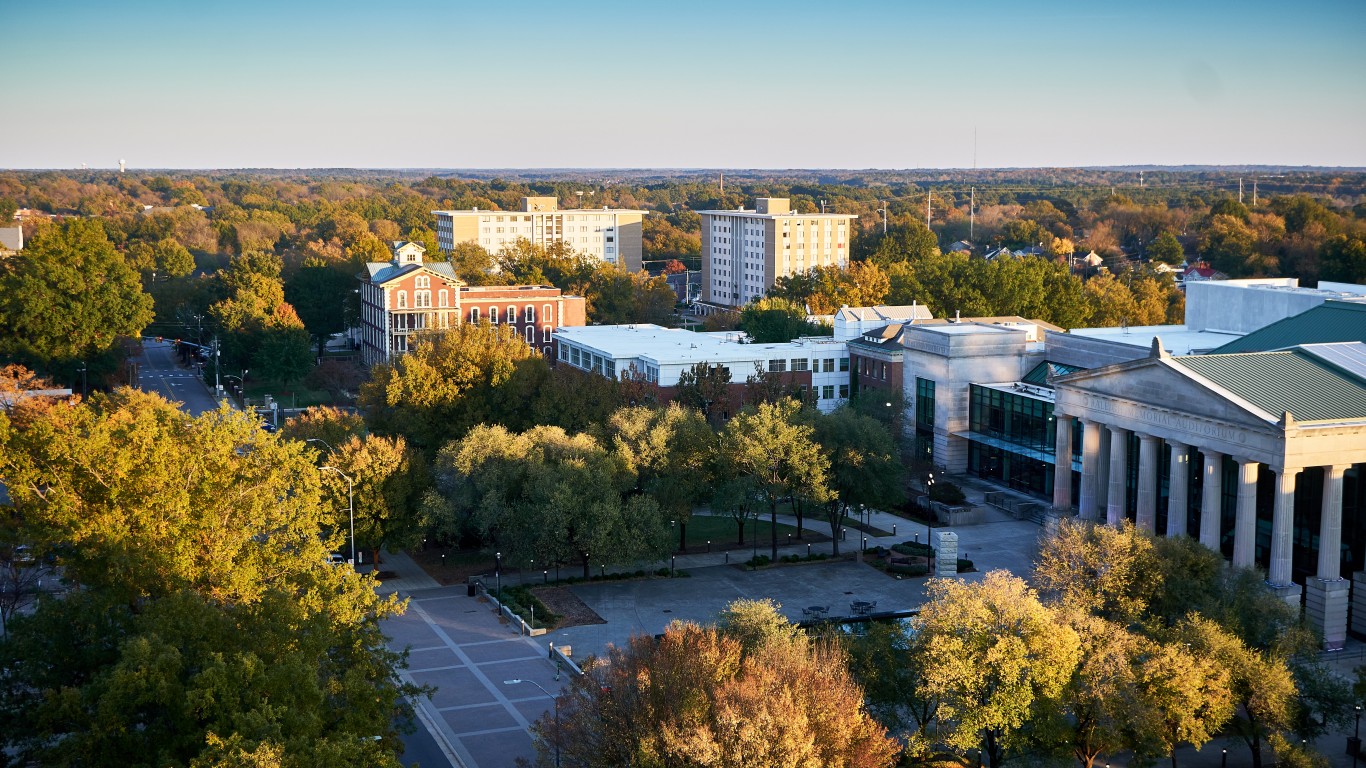
47. Dunn, North Carolina
> Change in reported robbery rate, 2019-2020: -92.1
> Robberies reported in 2020: 14 — 142nd highest of 2,901 towns (tied)
> Robberies per 100K people in 2020: 143.4 — 90th highest of 2,901 towns
> 1-yr. change in all violent crime per 100k people: +205.1 — 190th highest of 2,893 towns
> Violent crimes per 100K people in 2020: 778.4 — 189th highest of 2,899 towns
> Population: 9,664
[in-text-ad-2]

46. North Wilkesboro, North Carolina
> Change in reported robbery rate, 2019-2020: -94.8
> Robberies reported in 2020: 0 reported — the lowest of 2,901 towns (tied)
> Robberies per 100K people in 2020: 0.0 reported — the lowest of 2,901 towns (tied)
> 1-yr. change in all violent crime per 100k people: -92.9 — 433rd lowest of 2,893 towns
> Violent crimes per 100K people in 2020: 286.3 — 915th highest of 2,899 towns
> Population: 4,194
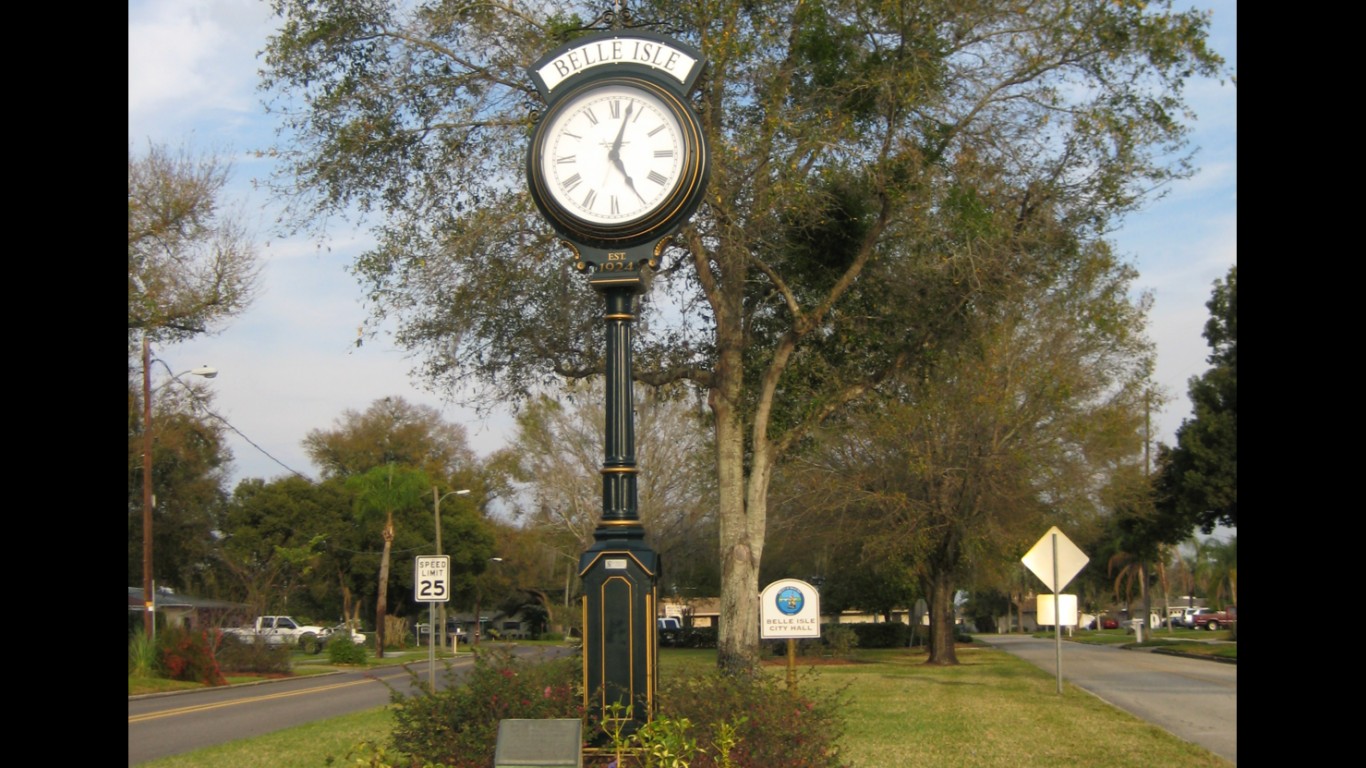
45. Belle Isle, Florida
> Change in reported robbery rate, 2019-2020: -95.8
> Robberies reported in 2020: 2 — 922nd highest of 2,901 towns (tied)
> Robberies per 100K people in 2020: 27.1 — 1,012th highest of 2,901 towns
> 1-yr. change in all violent crime per 100k people: -15.5 — 1,145th lowest of 2,893 towns
> Violent crimes per 100K people in 2020: 202.9 — 1,349th highest of 2,899 towns
> Population: 7,010
[in-text-ad]
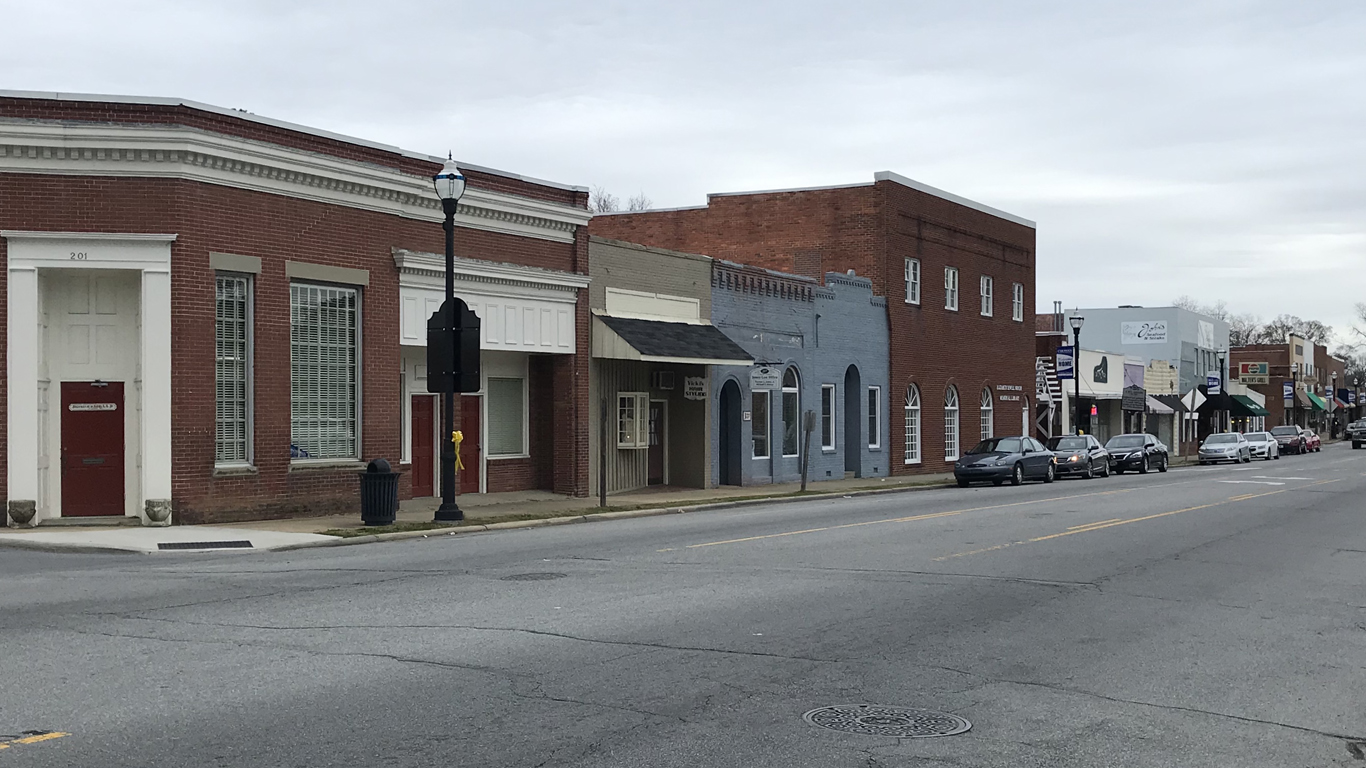
44. Murfreesboro, North Carolina
> Change in reported robbery rate, 2019-2020: -96.6
> Robberies reported in 2020: 1 — 1,127th lowest of 2,901 towns (tied)
> Robberies per 100K people in 2020: 33.6 — 833rd highest of 2,901 towns
> 1-yr. change in all violent crime per 100k people: +38.7 — 943rd highest of 2,893 towns
> Violent crimes per 100K people in 2020: 201.5 — 1,367th highest of 2,899 towns (tied)
> Population: 3,044
43. Richton Park, Illinois
> Change in reported robbery rate, 2019-2020: -96.6
> Robberies reported in 2020: 8 — 301st highest of 2,901 towns (tied)
> Robberies per 100K people in 2020: 60.4 — 434th highest of 2,901 towns
> 1-yr. change in all violent crime per 100k people: -154.3 — 228th lowest of 2,893 towns
> Violent crimes per 100K people in 2020: 294.3 — 897th highest of 2,899 towns
> Population: 13,504
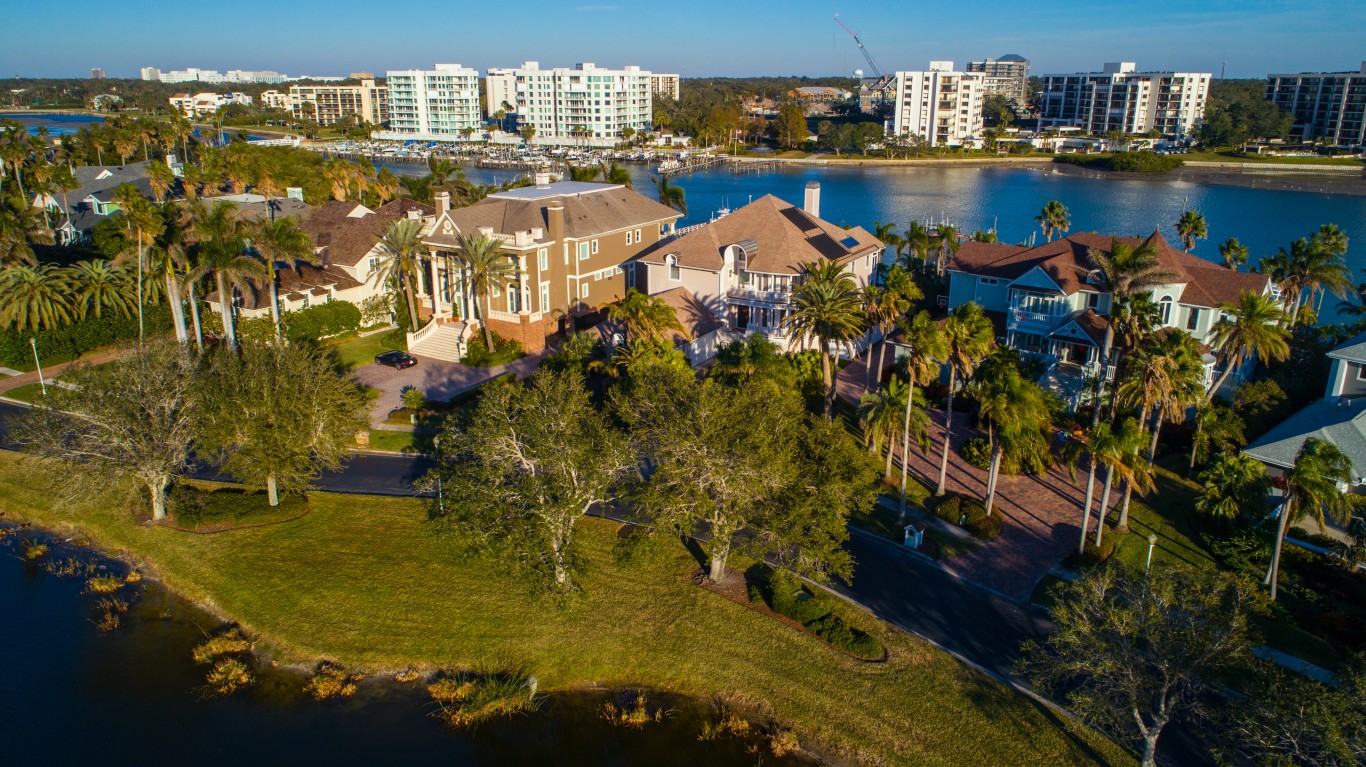
42. Belleview, Florida
> Change in reported robbery rate, 2019-2020: -98.6
> Robberies reported in 2020: 1 — 1,127th lowest of 2,901 towns (tied)
> Robberies per 100K people in 2020: 19.3 — 1,236th highest of 2,901 towns
> 1-yr. change in all violent crime per 100k people: +187.3 — 223rd highest of 2,893 towns
> Violent crimes per 100K people in 2020: 580.5 — 341st highest of 2,899 towns
> Population: 4,927
[in-text-ad-2]

41. Kingstree, South Carolina
> Change in reported robbery rate, 2019-2020: -99.2
> Robberies reported in 2020: 1 — 1,127th lowest of 2,901 towns (tied)
> Robberies per 100K people in 2020: 32.9 — 848th highest of 2,901 towns
> 1-yr. change in all violent crime per 100k people: +229.0 — 156th highest of 2,893 towns
> Violent crimes per 100K people in 2020: 790.8 — 184th highest of 2,899 towns
> Population: 3,096
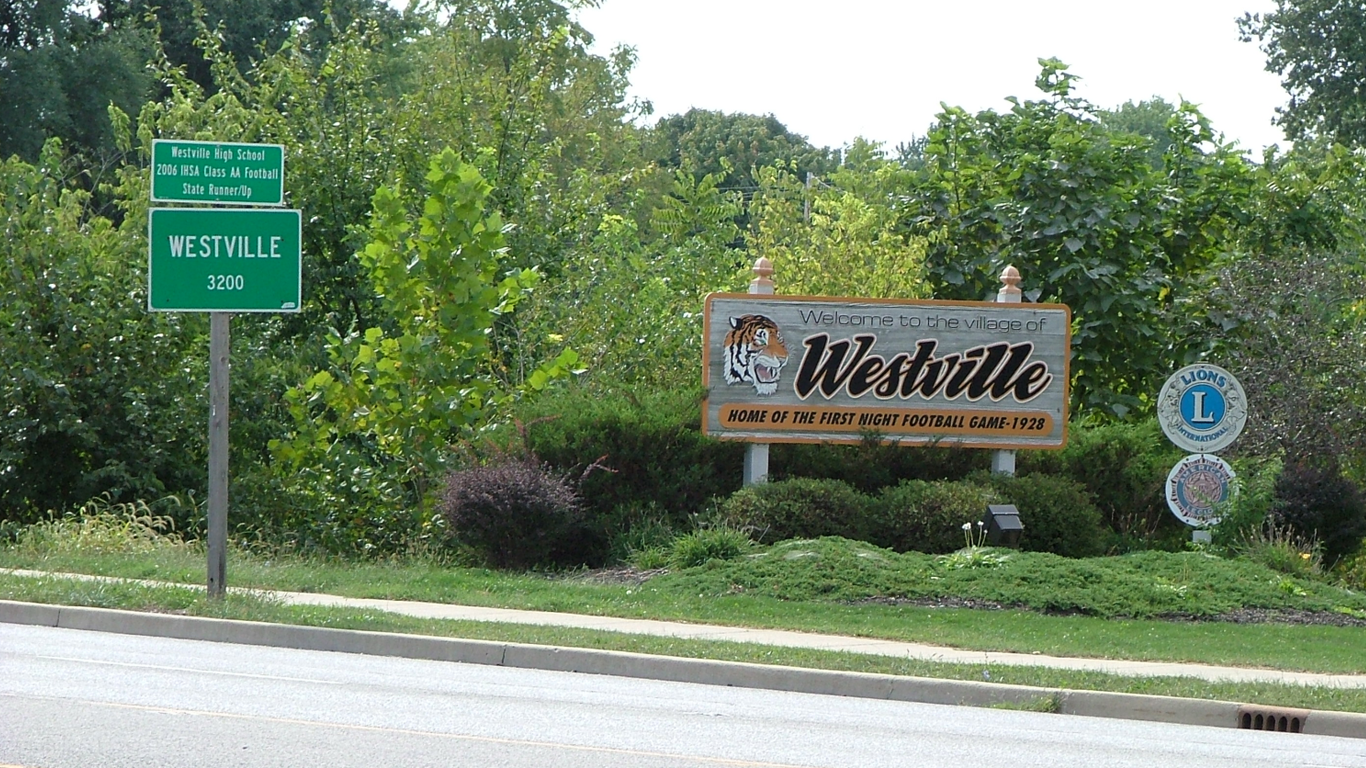
40. Westville, Illinois
> Change in reported robbery rate, 2019-2020: -101.2
> Robberies reported in 2020: 0 reported — the lowest of 2,901 towns (tied)
> Robberies per 100K people in 2020: 0.0 reported — the lowest of 2,901 towns (tied)
> 1-yr. change in all violent crime per 100k people: -367.4 — 40th lowest of 2,893 towns
> Violent crimes per 100K people in 2020: 239.9 — 1,128th highest of 2,899 towns
> Population: 3,219
[in-text-ad]

39. Riverdale, Illinois
> Change in reported robbery rate, 2019-2020: -103.5
> Robberies reported in 2020: 36 — 16th highest of 2,901 towns
> Robberies per 100K people in 2020: 276.4 — 17th highest of 2,901 towns
> 1-yr. change in all violent crime per 100k people: -198.2 — 148th lowest of 2,893 towns
> Violent crimes per 100K people in 2020: 667.9 — 260th highest of 2,899 towns
> Population: 12,793
38. Penns Grove, New Jersey
> Change in reported robbery rate, 2019-2020: -104.3
> Robberies reported in 2020: 9 — 266th highest of 2,901 towns (tied)
> Robberies per 100K people in 2020: 190.6 — 41st highest of 2,901 towns
> 1-yr. change in all violent crime per 100k people: +48.1 — 871st highest of 2,893 towns
> Violent crimes per 100K people in 2020: 1,122.6 — 86th highest of 2,899 towns
> Population: 4,816

37. South Padre Island, Texas
> Change in reported robbery rate, 2019-2020: -105.7
> Robberies reported in 2020: 3 — 731st highest of 2,901 towns (tied)
> Robberies per 100K people in 2020: 108.2 — 165th highest of 2,901 towns (tied)
> 1-yr. change in all violent crime per 100k people: -17.4 — 1,110th lowest of 2,893 towns
> Violent crimes per 100K people in 2020: 1,551.2 — 31st highest of 2,899 towns
> Population: 2,818
[in-text-ad-2]

36. Mount Morris, Michigan
> Change in reported robbery rate, 2019-2020: -105.9
> Robberies reported in 2020: 0 reported — the lowest of 2,901 towns (tied)
> Robberies per 100K people in 2020: 0.0 reported — the lowest of 2,901 towns (tied)
> 1-yr. change in all violent crime per 100k people: -492.4 — 20th lowest of 2,893 towns
> Violent crimes per 100K people in 2020: 389.8 — 609th highest of 2,899 towns
> Population: 2,881
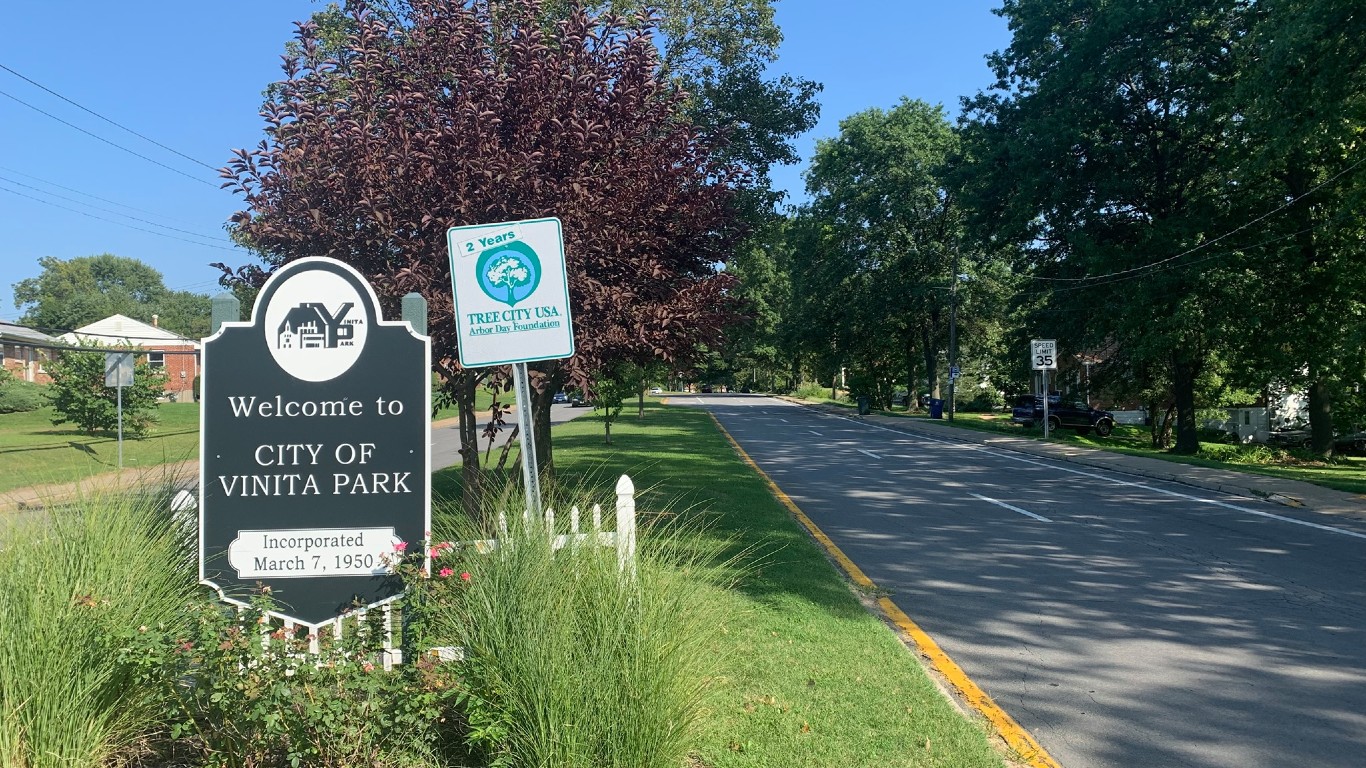
35. Vinita Park, Missouri
> Change in reported robbery rate, 2019-2020: -108.8
> Robberies reported in 2020: 21 — 62nd highest of 2,901 towns (tied)
> Robberies per 100K people in 2020: 191.8 — 40th highest of 2,901 towns
> 1-yr. change in all violent crime per 100k people: +12.8 — 1,326th highest of 2,893 towns
> Violent crimes per 100K people in 2020: 1,461.1 — 35th highest of 2,899 towns
> Population: 1,619
[in-text-ad]

34. Holly Ridge, North Carolina
> Change in reported robbery rate, 2019-2020: -108.9
> Robberies reported in 2020: 1 — 1,127th lowest of 2,901 towns (tied)
> Robberies per 100K people in 2020: 32.5 — 866th highest of 2,901 towns
> 1-yr. change in all violent crime per 100k people: -220.6 — 130th lowest of 2,893 towns
> Violent crimes per 100K people in 2020: 97.5 — 789th lowest of 2,899 towns
> Population: 2,421
33. Marshville, North Carolina
> Change in reported robbery rate, 2019-2020: -109.2
> Robberies reported in 2020: 0 reported — the lowest of 2,901 towns (tied)
> Robberies per 100K people in 2020: 0.0 reported — the lowest of 2,901 towns (tied)
> 1-yr. change in all violent crime per 100k people: -228.3 — 120th lowest of 2,893 towns
> Violent crimes per 100K people in 2020: 354.0 — 713th highest of 2,899 towns
> Population: 2,714
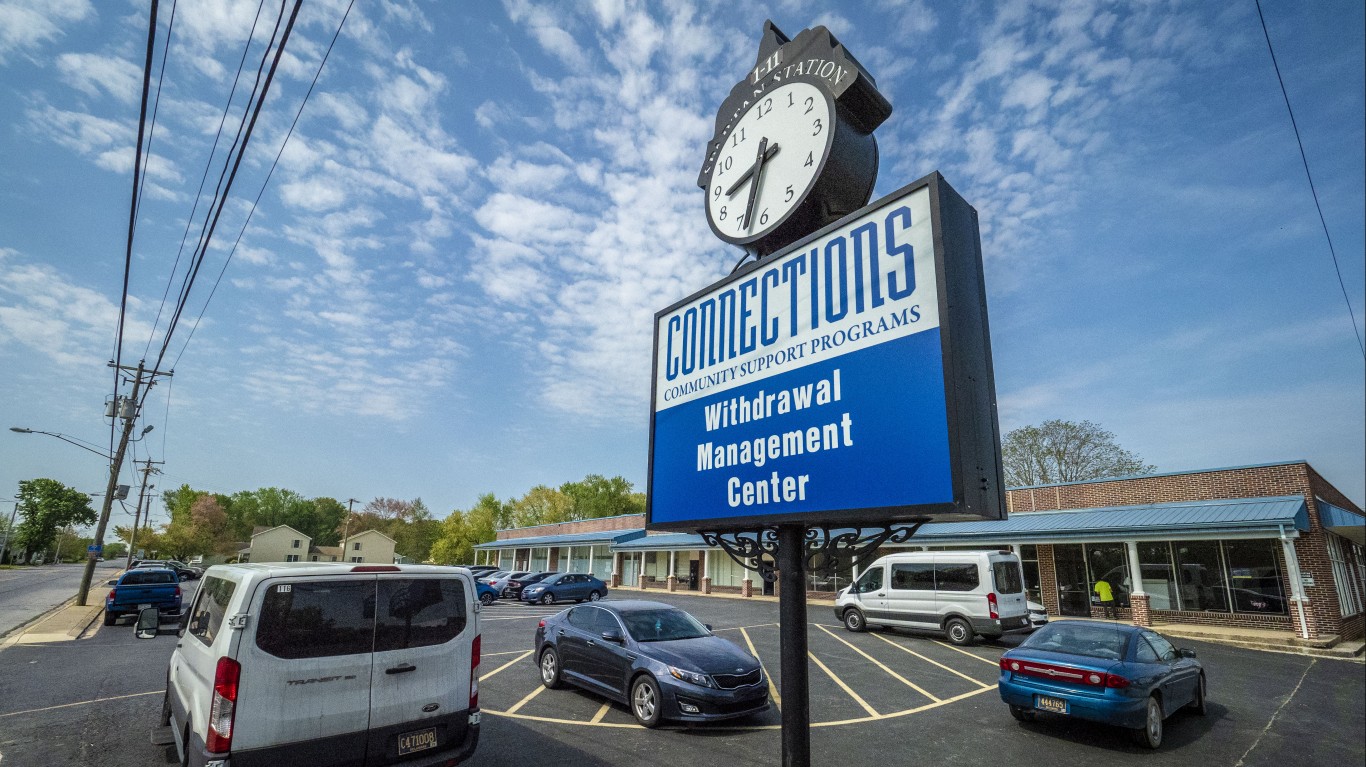
32. Harrington, Delaware
> Change in reported robbery rate, 2019-2020: -109.4
> Robberies reported in 2020: 2 — 922nd highest of 2,901 towns (tied)
> Robberies per 100K people in 2020: 54.9 — 487th highest of 2,901 towns
> 1-yr. change in all violent crime per 100k people: -272.7 — 85th lowest of 2,893 towns
> Violent crimes per 100K people in 2020: 685.7 — 243rd highest of 2,899 towns
> Population: 3,652
[in-text-ad-2]

31. Loris, South Carolina
> Change in reported robbery rate, 2019-2020: -109.5
> Robberies reported in 2020: 0 reported — the lowest of 2,901 towns (tied)
> Robberies per 100K people in 2020: 0.0 reported — the lowest of 2,901 towns (tied)
> 1-yr. change in all violent crime per 100k people: -456.3 — 25th lowest of 2,893 towns
> Violent crimes per 100K people in 2020: 784.6 — 186th highest of 2,899 towns
> Population: 2,673
30. Laurel, Delaware
> Change in reported robbery rate, 2019-2020: -110.0
> Robberies reported in 2020: 10 — 222nd highest of 2,901 towns (tied)
> Robberies per 100K people in 2020: 225.7 — 28th highest of 2,901 towns
> 1-yr. change in all violent crime per 100k people: -507.2 — 16th lowest of 2,893 towns
> Violent crimes per 100K people in 2020: 880.2 — 148th highest of 2,899 towns
> Population: 4,179
[in-text-ad]
29. Lindenwold, New Jersey
> Change in reported robbery rate, 2019-2020: -110.6
> Robberies reported in 2020: 31 — 25th highest of 2,901 towns (tied)
> Robberies per 100K people in 2020: 180.2 — 50th highest of 2,901 towns
> 1-yr. change in all violent crime per 100k people: -81.7 — 496th lowest of 2,893 towns
> Violent crimes per 100K people in 2020: 633.5 — 295th highest of 2,899 towns
> Population: 17,320

28. Lamesa, Texas
> Change in reported robbery rate, 2019-2020: -111.4
> Robberies reported in 2020: 2 — 922nd highest of 2,901 towns (tied)
> Robberies per 100K people in 2020: 21.9 — 1,162nd highest of 2,901 towns
> 1-yr. change in all violent crime per 100k people: -208.4 — 141st lowest of 2,893 towns
> Violent crimes per 100K people in 2020: 614.1 — 311th highest of 2,899 towns
> Population: 9,221
27. Chipley, Florida
> Change in reported robbery rate, 2019-2020: -112.5
> Robberies reported in 2020: 1 — 1,127th lowest of 2,901 towns (tied)
> Robberies per 100K people in 2020: 27.7 — 996th highest of 2,901 towns
> 1-yr. change in all violent crime per 100k people: -313.4 — 64th lowest of 2,893 towns
> Violent crimes per 100K people in 2020: 415.5 — 561st highest of 2,899 towns
> Population: 3,525
[in-text-ad-2]

26. Milton, West Virginia
> Change in reported robbery rate, 2019-2020: -115.9
> Robberies reported in 2020: 0 reported — the lowest of 2,901 towns (tied)
> Robberies per 100K people in 2020: 0.0 reported — the lowest of 2,901 towns (tied)
> 1-yr. change in all violent crime per 100k people: -151.4 — 237th lowest of 2,893 towns
> Violent crimes per 100K people in 2020: 196.3 — 1,399th highest of 2,899 towns
> Population: 2,586
25. Westminster, South Carolina
> Change in reported robbery rate, 2019-2020: -116.7
> Robberies reported in 2020: 0 reported — the lowest of 2,901 towns (tied)
> Robberies per 100K people in 2020: 0.0 reported — the lowest of 2,901 towns (tied)
> 1-yr. change in all violent crime per 100k people: +147.5 — 315th highest of 2,893 towns
> Violent crimes per 100K people in 2020: 536.6 — 389th highest of 2,899 towns (tied)
> Population: 2,536
[in-text-ad]

24. Hudson Oaks, Texas
> Change in reported robbery rate, 2019-2020: -119.3
> Robberies reported in 2020: 0 reported — the lowest of 2,901 towns (tied)
> Robberies per 100K people in 2020: 0.0 reported — the lowest of 2,901 towns (tied)
> 1-yr. change in all violent crime per 100k people: -238.6 — 112th lowest of 2,893 towns
> Violent crimes per 100K people in 2020: 0.0 reported — the lowest of 2,899 towns (tied)
> Population: 2,383
23. Hartsville, South Carolina
> Change in reported robbery rate, 2019-2020: -119.6
> Robberies reported in 2020: 6 — 413th highest of 2,901 towns (tied)
> Robberies per 100K people in 2020: 79.8 — 269th highest of 2,901 towns
> 1-yr. change in all violent crime per 100k people: -265.0 — 90th lowest of 2,893 towns
> Violent crimes per 100K people in 2020: 1,170.4 — 73rd highest of 2,899 towns
> Population: 7,616
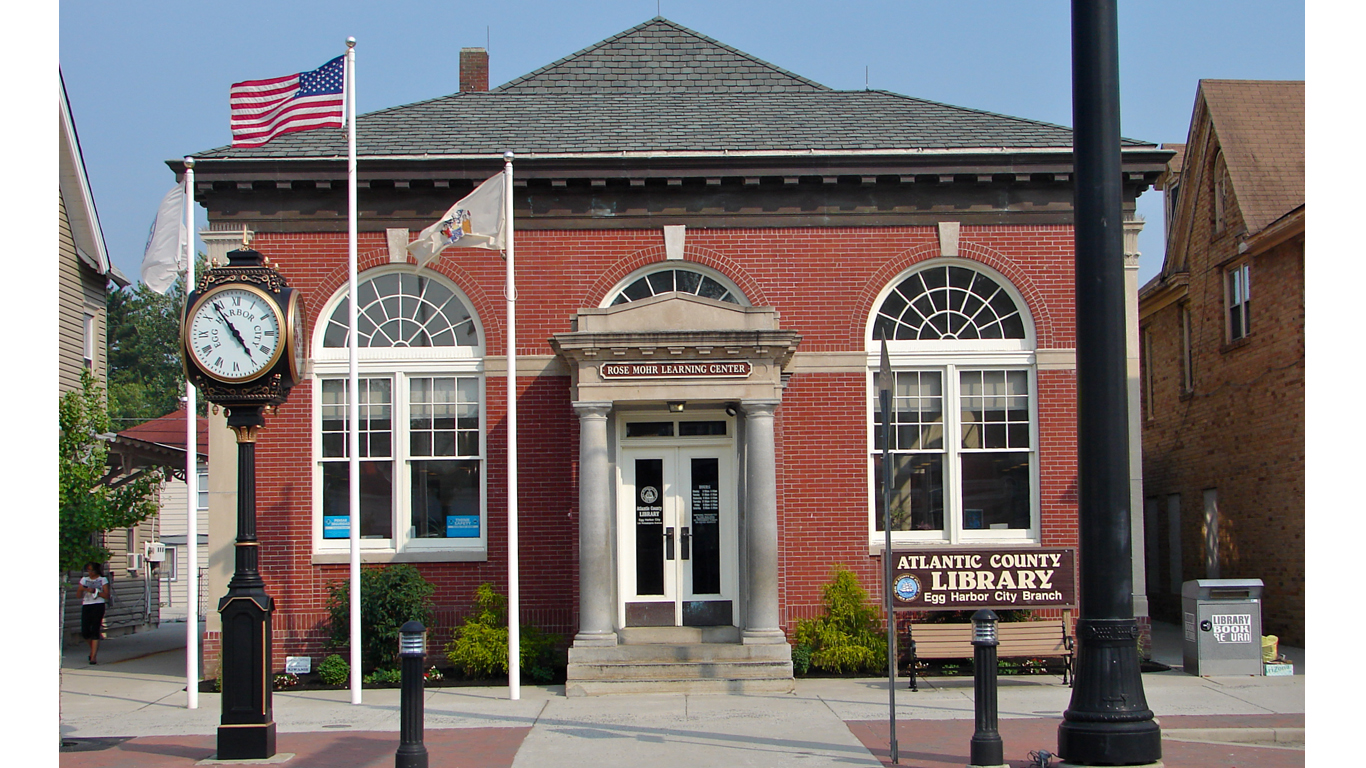
22. Egg Harbor City, New Jersey
> Change in reported robbery rate, 2019-2020: -120.4
> Robberies reported in 2020: 6 — 413th highest of 2,901 towns (tied)
> Robberies per 100K people in 2020: 148.8 — 78th highest of 2,901 towns
> 1-yr. change in all violent crime per 100k people: -142.0 — 264th lowest of 2,893 towns
> Violent crimes per 100K people in 2020: 372.1 — 662nd highest of 2,899 towns
> Population: 4,100
[in-text-ad-2]
21. Abbeville, Louisiana
> Change in reported robbery rate, 2019-2020: -122.9
> Robberies reported in 2020: 8 — 301st highest of 2,901 towns (tied)
> Robberies per 100K people in 2020: 66.6 — 366th highest of 2,901 towns
> 1-yr. change in all violent crime per 100k people: +191.6 — 211th highest of 2,893 towns
> Violent crimes per 100K people in 2020: 1,023.5 — 108th highest of 2,899 towns
> Population: 12,236

20. Beaufort, South Carolina
> Change in reported robbery rate, 2019-2020: -126.3
> Robberies reported in 2020: 5 — 506th highest of 2,901 towns (tied)
> Robberies per 100K people in 2020: 36.9 — 742nd highest of 2,901 towns
> 1-yr. change in all violent crime per 100k people: +56.6 — 797th highest of 2,893 towns
> Violent crimes per 100K people in 2020: 486.7 — 448th highest of 2,899 towns
> Population: 13,404
[in-text-ad]
19. Bridgeton, New Jersey
> Change in reported robbery rate, 2019-2020: -127.3
> Robberies reported in 2020: 82 — 2nd highest of 2,901 towns
> Robberies per 100K people in 2020: 341.2 — 8th highest of 2,901 towns
> 1-yr. change in all violent crime per 100k people: +57.2 — 792nd highest of 2,893 towns
> Violent crimes per 100K people in 2020: 973.7 — 120th highest of 2,899 towns
> Population: 24,540
18. Mount Olive, North Carolina
> Change in reported robbery rate, 2019-2020: -128.2
> Robberies reported in 2020: 2 — 922nd highest of 2,901 towns (tied)
> Robberies per 100K people in 2020: 43.7 — 623rd highest of 2,901 towns
> 1-yr. change in all violent crime per 100k people: -339.5 — 53rd lowest of 2,893 towns
> Violent crimes per 100K people in 2020: 262.4 — 1,021st highest of 2,899 towns
> Population: 4,674
17. East Alton, Illinois
> Change in reported robbery rate, 2019-2020: -133.0
> Robberies reported in 2020: 2 — 922nd highest of 2,901 towns (tied)
> Robberies per 100K people in 2020: 33.8 — 823rd highest of 2,901 towns
> 1-yr. change in all violent crime per 100k people: +38.9 — 942nd highest of 2,893 towns
> Violent crimes per 100K people in 2020: 439.2 — 519th highest of 2,899 towns
> Population: 6,061
[in-text-ad-2]
16. Clementon, New Jersey
> Change in reported robbery rate, 2019-2020: -142.4
> Robberies reported in 2020: 1 — 1,127th lowest of 2,901 towns (tied)
> Robberies per 100K people in 2020: 20.2 — 1,208th highest of 2,901 towns (tied)
> 1-yr. change in all violent crime per 100k people: -183.5 — 163rd lowest of 2,893 towns
> Violent crimes per 100K people in 2020: 80.8 — 660th lowest of 2,899 towns
> Population: 4,918
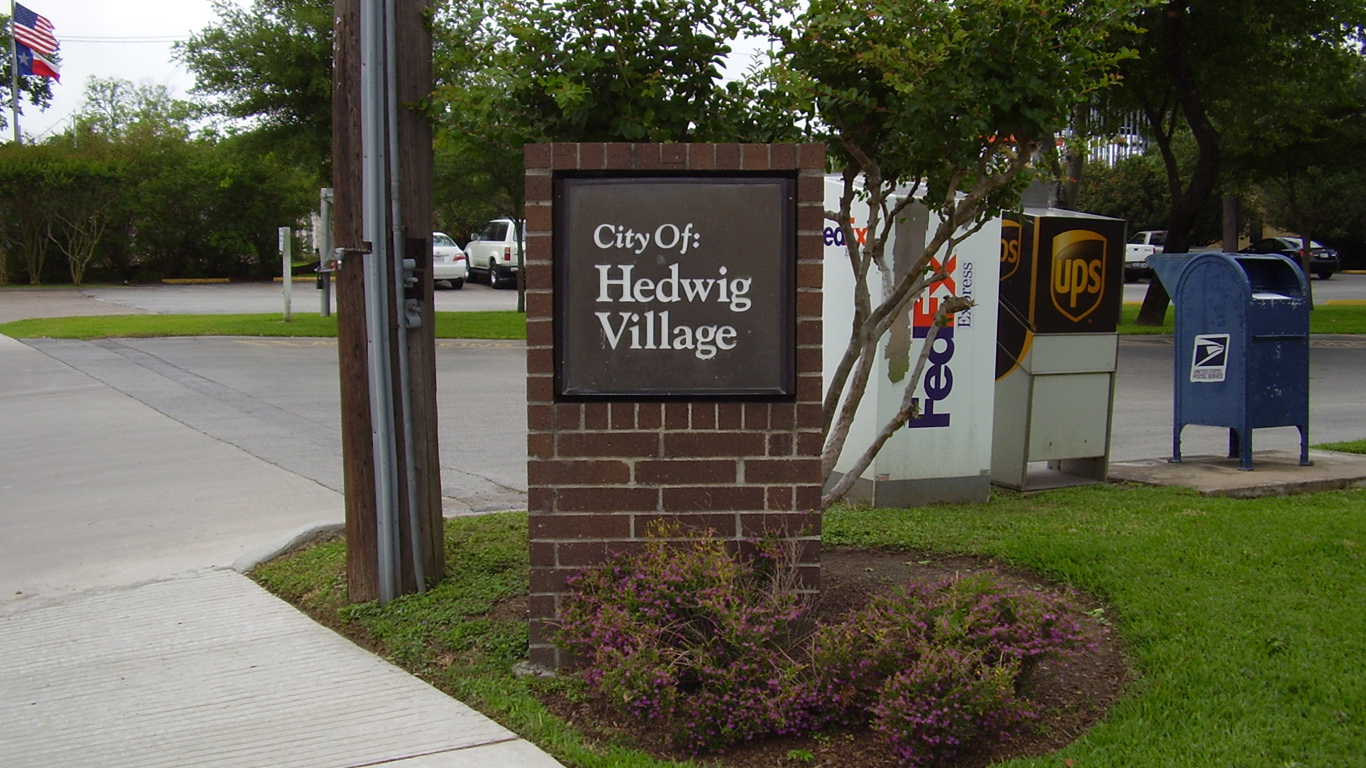
15. Hedwig Village, Texas
> Change in reported robbery rate, 2019-2020: -147.9
> Robberies reported in 2020: 2 — 922nd highest of 2,901 towns (tied)
> Robberies per 100K people in 2020: 75.7 — 303rd highest of 2,901 towns
> 1-yr. change in all violent crime per 100k people: -34.4 — 890th lowest of 2,893 towns
> Violent crimes per 100K people in 2020: 189.2 — 1,448th lowest of 2,899 towns
> Population: 2,671
[in-text-ad]
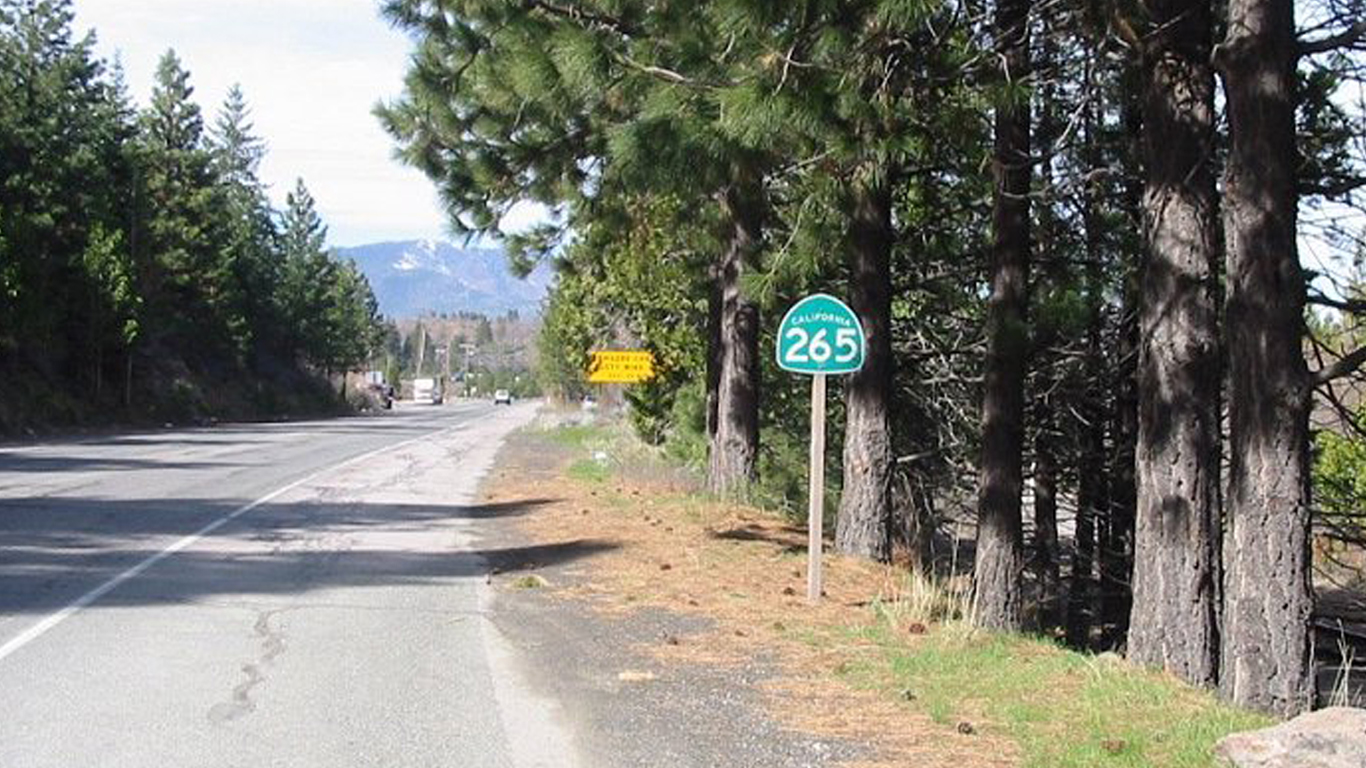
14. Weed, California
> Change in reported robbery rate, 2019-2020: -149.6
> Robberies reported in 2020: 0 reported — the lowest of 2,901 towns (tied)
> Robberies per 100K people in 2020: 0.0 reported — the lowest of 2,901 towns (tied)
> 1-yr. change in all violent crime per 100k people: -938.5 — 4th lowest of 2,893 towns
> Violent crimes per 100K people in 2020: 333.5 — 773rd highest of 2,899 towns
> Population: 2,669
13. Spencer, North Carolina
> Change in reported robbery rate, 2019-2020: -154.4
> Robberies reported in 2020: 0 reported — the lowest of 2,901 towns (tied)
> Robberies per 100K people in 2020: 0.0 reported — the lowest of 2,901 towns (tied)
> 1-yr. change in all violent crime per 100k people: -63.3 — 629th lowest of 2,893 towns
> Violent crimes per 100K people in 2020: 276.4 — 953rd highest of 2,899 towns
> Population: 3,230

12. Pantego, Texas
> Change in reported robbery rate, 2019-2020: -156.5
> Robberies reported in 2020: 0 reported — the lowest of 2,901 towns (tied)
> Robberies per 100K people in 2020: 0.0 reported — the lowest of 2,901 towns (tied)
> 1-yr. change in all violent crime per 100k people: -154.0 — 230th lowest of 2,893 towns
> Violent crimes per 100K people in 2020: 276.4 — 954th highest of 2,899 towns
> Population: 2,531
[in-text-ad-2]

11. Highland Park, Michigan
> Change in reported robbery rate, 2019-2020: -158.3
> Robberies reported in 2020: 26 — 41st highest of 2,901 towns (tied)
> Robberies per 100K people in 2020: 243.4 — 25th highest of 2,901 towns
> 1-yr. change in all violent crime per 100k people: -145.4 — 258th lowest of 2,893 towns
> Violent crimes per 100K people in 2020: 1,919.5 — 13th highest of 2,899 towns
> Population: 10,867
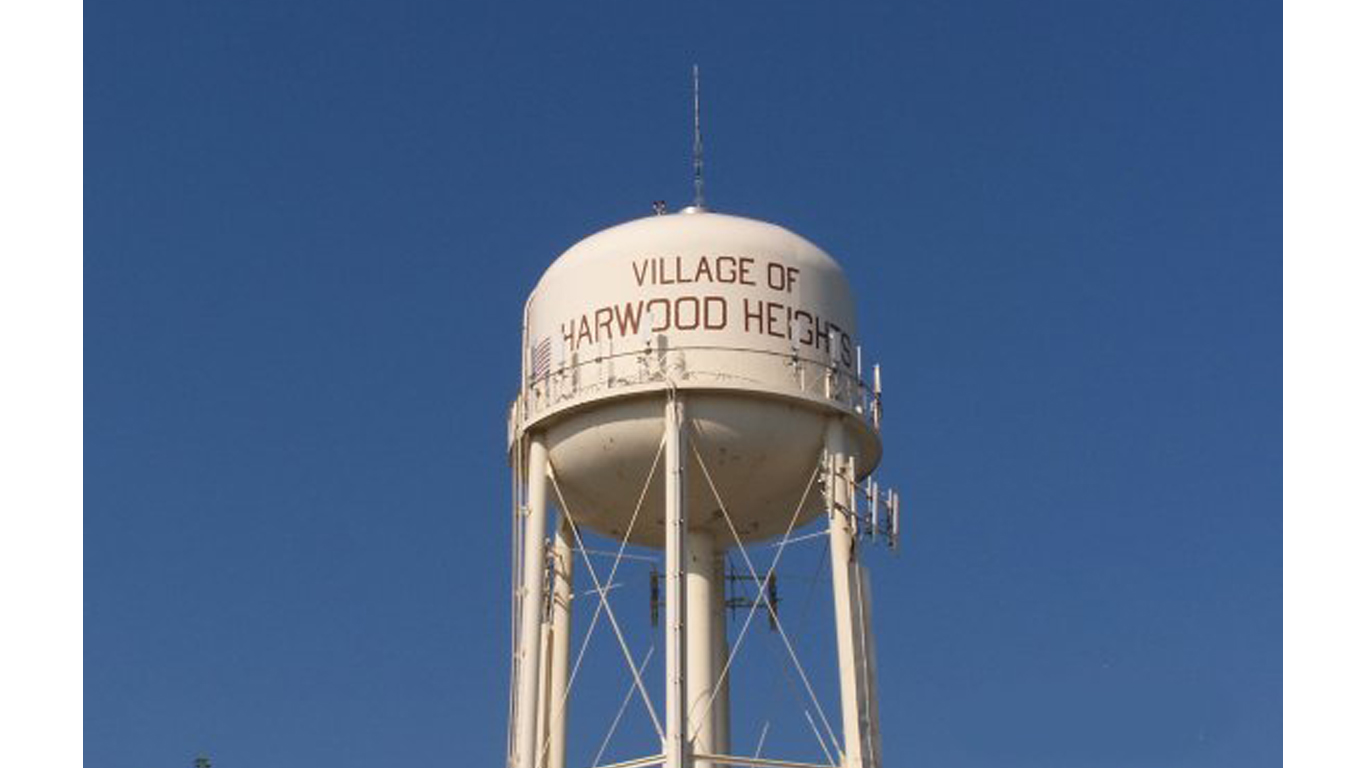
10. Harwood Heights, Illinois
> Change in reported robbery rate, 2019-2020: -166.7
> Robberies reported in 2020: 2 — 922nd highest of 2,901 towns (tied)
> Robberies per 100K people in 2020: 24.1 — 1,089th highest of 2,901 towns
> 1-yr. change in all violent crime per 100k people: -321.1 — 59th lowest of 2,893 towns
> Violent crimes per 100K people in 2020: 72.3 — 576th lowest of 2,899 towns
> Population: 8,487
[in-text-ad]
9. Jerseyville, Illinois
> Change in reported robbery rate, 2019-2020: -170.6
> Robberies reported in 2020: 0 reported — the lowest of 2,901 towns (tied)
> Robberies per 100K people in 2020: 0.0 reported — the lowest of 2,901 towns (tied)
> 1-yr. change in all violent crime per 100k people: -255.2 — 99th lowest of 2,893 towns
> Violent crimes per 100K people in 2020: 146.8 — 1,185th lowest of 2,899 towns (tied)
> Population: 8,161

8. Lockland, Ohio
> Change in reported robbery rate, 2019-2020: -172.9
> Robberies reported in 2020: 6 — 413th highest of 2,901 towns (tied)
> Robberies per 100K people in 2020: 174.4 — 54th highest of 2,901 towns
> 1-yr. change in all violent crime per 100k people: +3.0 — 1,431st highest of 2,893 towns
> Violent crimes per 100K people in 2020: 697.7 — 226th highest of 2,899 towns
> Population: 3,450
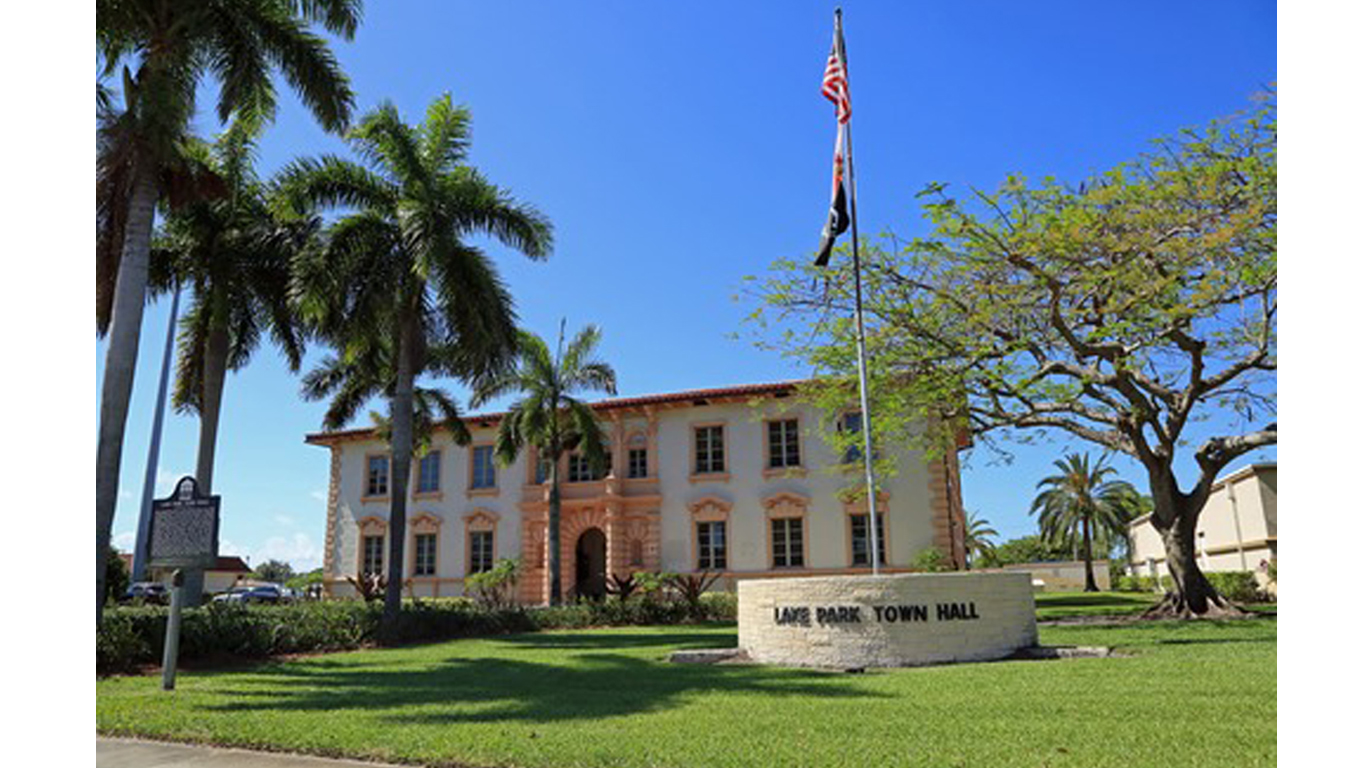
7. Lake Park, Florida
> Change in reported robbery rate, 2019-2020: -194.9
> Robberies reported in 2020: 15 — 127th highest of 2,901 towns (tied)
> Robberies per 100K people in 2020: 174.2 — 56th highest of 2,901 towns
> 1-yr. change in all violent crime per 100k people: -306.8 — 67th lowest of 2,893 towns
> Violent crimes per 100K people in 2020: 685.1 — 244th highest of 2,899 towns
> Population: 8,508
[in-text-ad-2]
6. Muskegon Heights, Michigan
> Change in reported robbery rate, 2019-2020: -205.4
> Robberies reported in 2020: 14 — 142nd highest of 2,901 towns (tied)
> Robberies per 100K people in 2020: 130.5 — 114th highest of 2,901 towns
> 1-yr. change in all violent crime per 100k people: -449.0 — 27th lowest of 2,893 towns
> Violent crimes per 100K people in 2020: 1,715.8 — 20th highest of 2,899 towns
> Population: 10,748

5. Kotzebue, Alaska
> Change in reported robbery rate, 2019-2020: -213.9
> Robberies reported in 2020: 0 reported — the lowest of 2,901 towns (tied)
> Robberies per 100K people in 2020: 0.0 reported — the lowest of 2,901 towns (tied)
> 1-yr. change in all violent crime per 100k people: -1,676.2 — the lowest of 2,893 towns
> Violent crimes per 100K people in 2020: 677.1 — 252nd highest of 2,899 towns
> Population: 3,287
[in-text-ad]

4. Burns, Oregon
> Change in reported robbery rate, 2019-2020: -215.7
> Robberies reported in 2020: 0 reported — the lowest of 2,901 towns (tied)
> Robberies per 100K people in 2020: 0.0 reported — the lowest of 2,901 towns (tied)
> 1-yr. change in all violent crime per 100k people: -288.5 — 76th lowest of 2,893 towns
> Violent crimes per 100K people in 2020: 179.0 — 1,395th lowest of 2,899 towns
> Population: 2,740
3. Bishopville, South Carolina
> Change in reported robbery rate, 2019-2020: -342.2
> Robberies reported in 2020: 1 — 1,127th lowest of 2,901 towns (tied)
> Robberies per 100K people in 2020: 33.7 — 828th highest of 2,901 towns
> 1-yr. change in all violent crime per 100k people: -1,591.8 — 2nd lowest of 2,893 towns
> Violent crimes per 100K people in 2020: 1,346.3 — 40th highest of 2,899 towns
> Population: 3,103
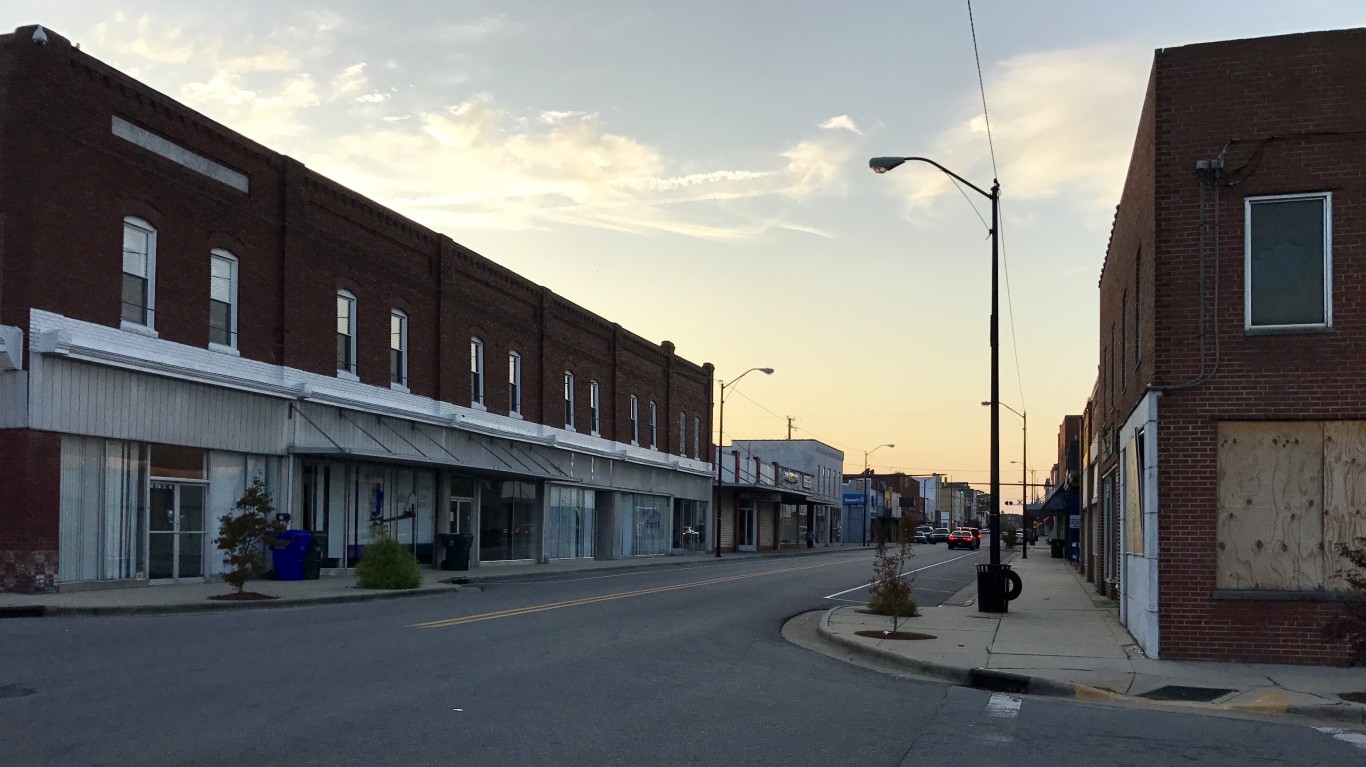
2. Ahoskie, North Carolina
> Change in reported robbery rate, 2019-2020: -355.7
> Robberies reported in 2020: 3 — 731st highest of 2,901 towns (tied)
> Robberies per 100K people in 2020: 63.4 — 398th highest of 2,901 towns
> 1-yr. change in all violent crime per 100k people: -286.1 — 77th lowest of 2,893 towns
> Violent crimes per 100K people in 2020: 887.4 — 146th highest of 2,899 towns
> Population: 4,848
[in-text-ad-2]

1. Emeryville, California
> Change in reported robbery rate, 2019-2020: -393.6
> Robberies reported in 2020: 65 — 5th highest of 2,901 towns
> Robberies per 100K people in 2020: 527.3 — 3rd highest of 2,901 towns
> 1-yr. change in all violent crime per 100k people: -472.9 — 23rd lowest of 2,893 towns
> Violent crimes per 100K people in 2020: 867.9 — 151st highest of 2,899 towns
> Population: 11,899
Methodology
To determine the towns where the robbery rate is falling, 24/7 Wall St. reviewed the change in robberies per 100,000 people from the FBI’s 2019 and 2020 Uniform Crime Reports. Crime rates were calculated using population figures provided by the FBI in the 2020 and 2019 UCR.
We defined towns based on population thresholds — having at least 2,500 people and less than 25,000 people — using five-year estimates from the U.S. Census Bureau’s 2019 American Community Survey. Limited data was available in the 2020 UCR for areas in Alabama, Maryland, Pennsylvania, and Illinois, though towns in these states were not excluded from analysis. Because some state and local agencies changed reporting practices between 2019 and 2020, the figures are not comparable, and the areas were excluded.
Population figures are five-year estimates from the U.S. Census Bureau’s 2019 American Community Survey. However, these estimates were not used to calculate crime rates.
Are You Ahead, or Behind on Retirement? (sponsor)
If you’re one of the over 4 Million Americans set to retire this year, you may want to pay attention. Many people have worked their whole lives preparing to retire without ever knowing the answer to the most important question: are you ahead, or behind on your retirement goals?
Don’t make the same mistake. It’s an easy question to answer. A quick conversation with a financial advisor can help you unpack your savings, spending, and goals for your money. With SmartAsset’s free tool, you can connect with vetted financial advisors in minutes.
Why wait? Click here to get started today!
Thank you for reading! Have some feedback for us?
Contact the 24/7 Wall St. editorial team.