The U.S. property crime rate fell for the 19th consecutive year in 2020 – a bright spot in an otherwise bleak year defined largely by the COVID-19 pandemic and a historic surge in deadly violence.
Property crime is made up of three categories of offenses: larceny, defined as the unlawful taking of property; burglary, defined as the illegal entry of a structure to commit a crime; and vehicle theft, defined as the theft, or the attempted theft, of a vehicle, such a car or ATV. Here is a look at the city in every state where your car is most likely to be stolen.
There were a total 6.5 million property crimes reported in the U.S. in 2020, or 1,958 for every 100,000 people, a decrease of 172 incidents per 100,000 people from the previous year. The decline nationwide is being led by especially steep drops in some U.S. towns.
Using data from the FBI’s 2020 Uniform Crime Report, 24/7 Wall St. identified the 50 towns where property crime is falling fastest. Towns are ranked by the year-over-year change in property crimes reported for every 100,000 residents. We considered all places covered by the U.S. Census Bureau with populations between 2,500 and 25,000.
Despite the decline in much of the country, property crimes remain the most common of the most serious crimes tracked by the FBI, known as Part I offenses. Each year, property crimes result in the loss of billions of dollars worth of property – much of which is never recovered.
In every town on this list, the property crime rate fell by more than 1,600 incidents per 100,000 people in 2020. Most of the towns that reported the largest decline in property crime rate are in the South, including six in Texas alone. It is important to note that while each of the towns on this list reported a decline in property crime, most still have a higher overall property crime rate than the national average. Here is a look at the city with the highest rate of property crime in each state.
Click here to see the towns where property crime is falling
Click here to read our detailed methodology

50. Anderson, California
> Change in reported property crime rate, 2019-2020: -1,602.1
> Property crimes reported in 2020: 197 — 845th highest of 2,654 towns (tied)
> Property crimes reported in 2019: 363 — 395th highest of 2,654 towns (tied)
> Property crimes per 100K people in 2020: 1,840.3 — 1,042nd highest of 2,654 towns
> Property crimes per 100K people in 2019: 3,442.4 — 394th highest of 2,654 towns
> Population: 10,407
[in-text-ad]
49. Miles City, Montana
> Change in reported property crime rate, 2019-2020: -1,610.2
> Property crimes reported in 2020: 107 — 1,293rd lowest of 2,654 towns (tied)
> Property crimes reported in 2019: 244 — 689th highest of 2,654 towns (tied)
> Property crimes per 100K people in 2020: 1,297.0 — 1,121st lowest of 2,654 towns
> Property crimes per 100K people in 2019: 2,907.2 — 571st highest of 2,654 towns
> Population: 8,487

48. Pantego, Texas
> Change in reported property crime rate, 2019-2020: -1,610.5
> Property crimes reported in 2020: 92 — 1,143rd lowest of 2,654 towns (tied)
> Property crimes reported in 2019: 134 — 1,212th highest of 2,654 towns (tied)
> Property crimes per 100K people in 2020: 3,632.1 — 277th highest of 2,654 towns
> Property crimes per 100K people in 2019: 5,242.6 — 123rd highest of 2,654 towns
> Population: 2,531
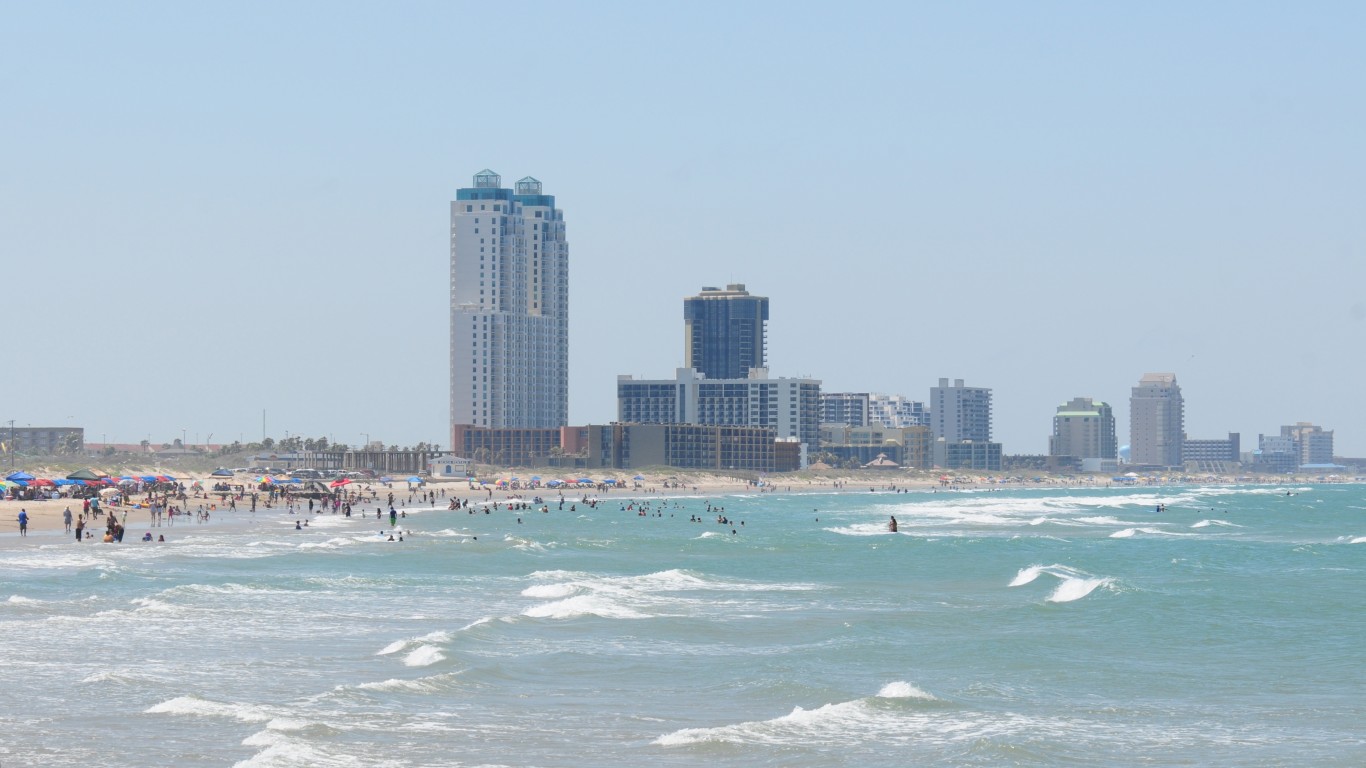
47. Port Isabel, Texas
> Change in reported property crime rate, 2019-2020: -1,612.8
> Property crimes reported in 2020: 82 — 1,040th lowest of 2,654 towns (tied)
> Property crimes reported in 2019: 148 — 1,119th highest of 2,654 towns (tied)
> Property crimes per 100K people in 2020: 1,313.3 — 1,145th lowest of 2,654 towns
> Property crimes per 100K people in 2019: 2,926.1 — 565th highest of 2,654 towns
> Population: 6,292
[in-text-ad-2]
46. Kodiak, Alaska
> Change in reported property crime rate, 2019-2020: -1,619.9
> Property crimes reported in 2020: 91 — 1,129th lowest of 2,654 towns (tied)
> Property crimes reported in 2019: 190 — 922nd highest of 2,654 towns (tied)
> Property crimes per 100K people in 2020: 1,574.9 — 1,264th highest of 2,654 towns
> Property crimes per 100K people in 2019: 3,194.9 — 479th highest of 2,654 towns
> Population: 6,022
45. Palmer, Alaska
> Change in reported property crime rate, 2019-2020: -1,624.3
> Property crimes reported in 2020: 84 — 1,058th lowest of 2,654 towns (tied)
> Property crimes reported in 2019: 204 — 856th highest of 2,654 towns (tied)
> Property crimes per 100K people in 2020: 1,099.3 — 922nd lowest of 2,654 towns
> Property crimes per 100K people in 2019: 2,723.6 — 637th highest of 2,654 towns
> Population: 7,131
[in-text-ad]
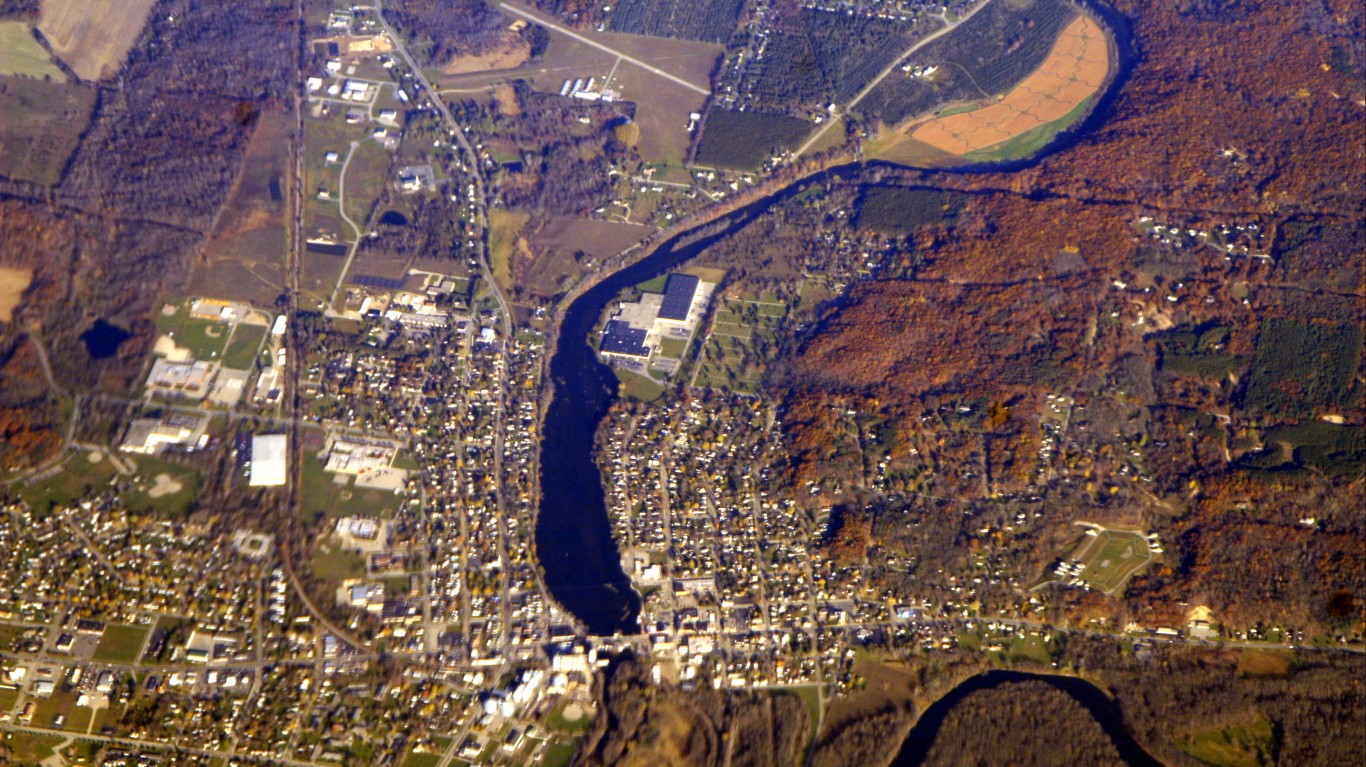
44. Lowell, Michigan
> Change in reported property crime rate, 2019-2020: -1,647.2
> Property crimes reported in 2020: 35 — 435th lowest of 2,654 towns (tied)
> Property crimes reported in 2019: 104 — 1,208th lowest of 2,654 towns (tied)
> Property crimes per 100K people in 2020: 830.2 — 627th lowest of 2,654 towns
> Property crimes per 100K people in 2019: 2,477.4 — 758th highest of 2,654 towns
> Population: 4,096
43. Brandenburg, Kentucky
> Change in reported property crime rate, 2019-2020: -1,653.4
> Property crimes reported in 2020: 14 — 86th lowest of 2,654 towns (tied)
> Property crimes reported in 2019: 62 — 779th lowest of 2,654 towns (tied)
> Property crimes per 100K people in 2020: 483.1 — 252nd lowest of 2,654 towns
> Property crimes per 100K people in 2019: 2,136.5 — 927th highest of 2,654 towns
> Population: 2,842
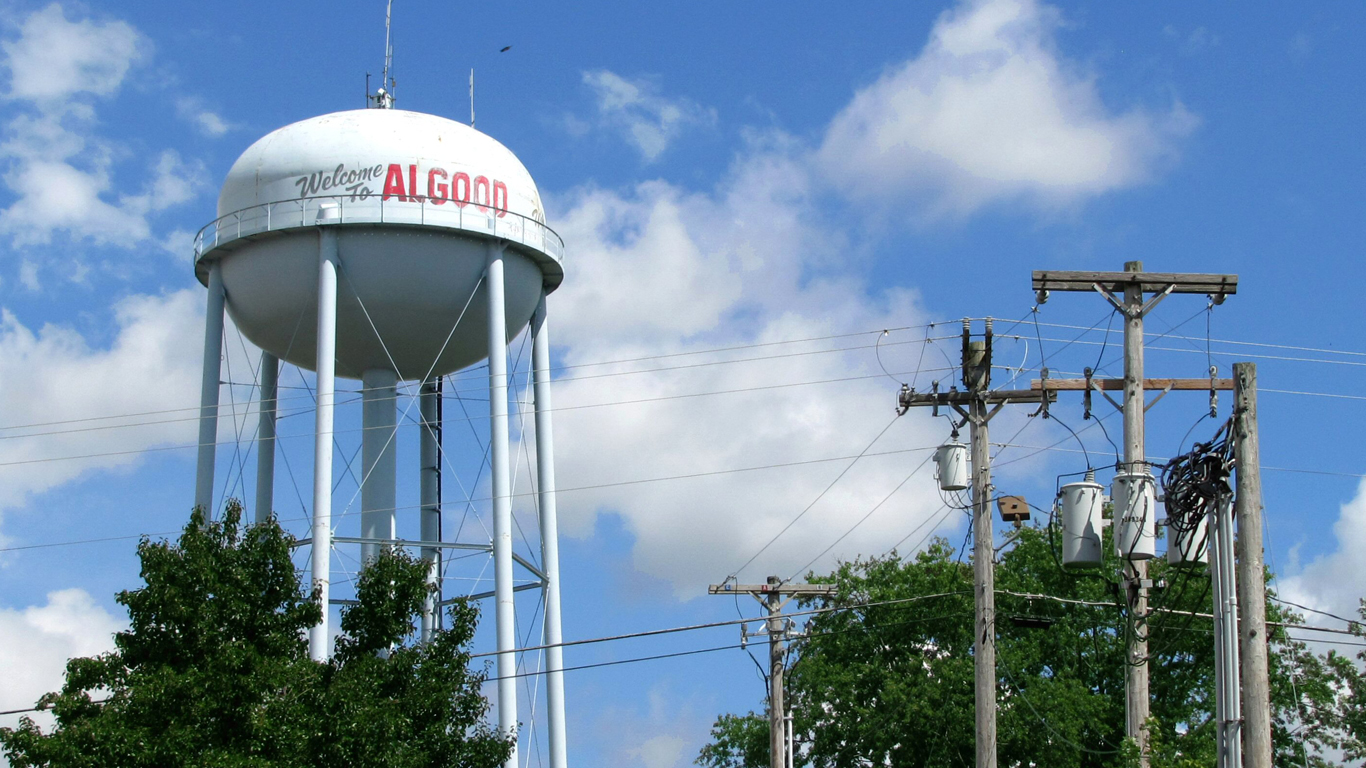
42. Algood, Tennessee
> Change in reported property crime rate, 2019-2020: -1,665.0
> Property crimes reported in 2020: 97 — 1,199th lowest of 2,654 towns (tied)
> Property crimes reported in 2019: 172 — 1,000th highest of 2,654 towns (tied)
> Property crimes per 100K people in 2020: 2,116.1 — 864th highest of 2,654 towns
> Property crimes per 100K people in 2019: 3,781.1 — 309th highest of 2,654 towns
> Population: 4,228
[in-text-ad-2]
41. Cleveland, Texas
> Change in reported property crime rate, 2019-2020: -1,666.4
> Property crimes reported in 2020: 346 — 395th highest of 2,654 towns (tied)
> Property crimes reported in 2019: 484 — 235th highest of 2,654 towns (tied)
> Property crimes per 100K people in 2020: 4,176.2 — 180th highest of 2,654 towns
> Property crimes per 100K people in 2019: 5,842.6 — 75th highest of 2,654 towns
> Population: 8,061

40. North Bend, Oregon
> Change in reported property crime rate, 2019-2020: -1,668.4
> Property crimes reported in 2020: 281 — 531st highest of 2,654 towns (tied)
> Property crimes reported in 2019: 444 — 284th highest of 2,654 towns (tied)
> Property crimes per 100K people in 2020: 2,873.8 — 515th highest of 2,654 towns
> Property crimes per 100K people in 2019: 4,542.2 — 194th highest of 2,654 towns
> Population: 9,652
[in-text-ad]

39. Center, Texas
> Change in reported property crime rate, 2019-2020: -1,669.3
> Property crimes reported in 2020: 91 — 1,129th lowest of 2,654 towns (tied)
> Property crimes reported in 2019: 181 — 963rd highest of 2,654 towns (tied)
> Property crimes per 100K people in 2020: 1,764.6 — 1,108th highest of 2,654 towns
> Property crimes per 100K people in 2019: 3,433.9 — 397th highest of 2,654 towns
> Population: 5,250

38. Farmville, North Carolina
> Change in reported property crime rate, 2019-2020: -1,670.3
> Property crimes reported in 2020: 107 — 1,293rd lowest of 2,654 towns (tied)
> Property crimes reported in 2019: 183 — 954th highest of 2,654 towns (tied)
> Property crimes per 100K people in 2020: 2,240.8 — 800th highest of 2,654 towns
> Property crimes per 100K people in 2019: 3,911.1 — 283rd highest of 2,654 towns
> Population: 4,712
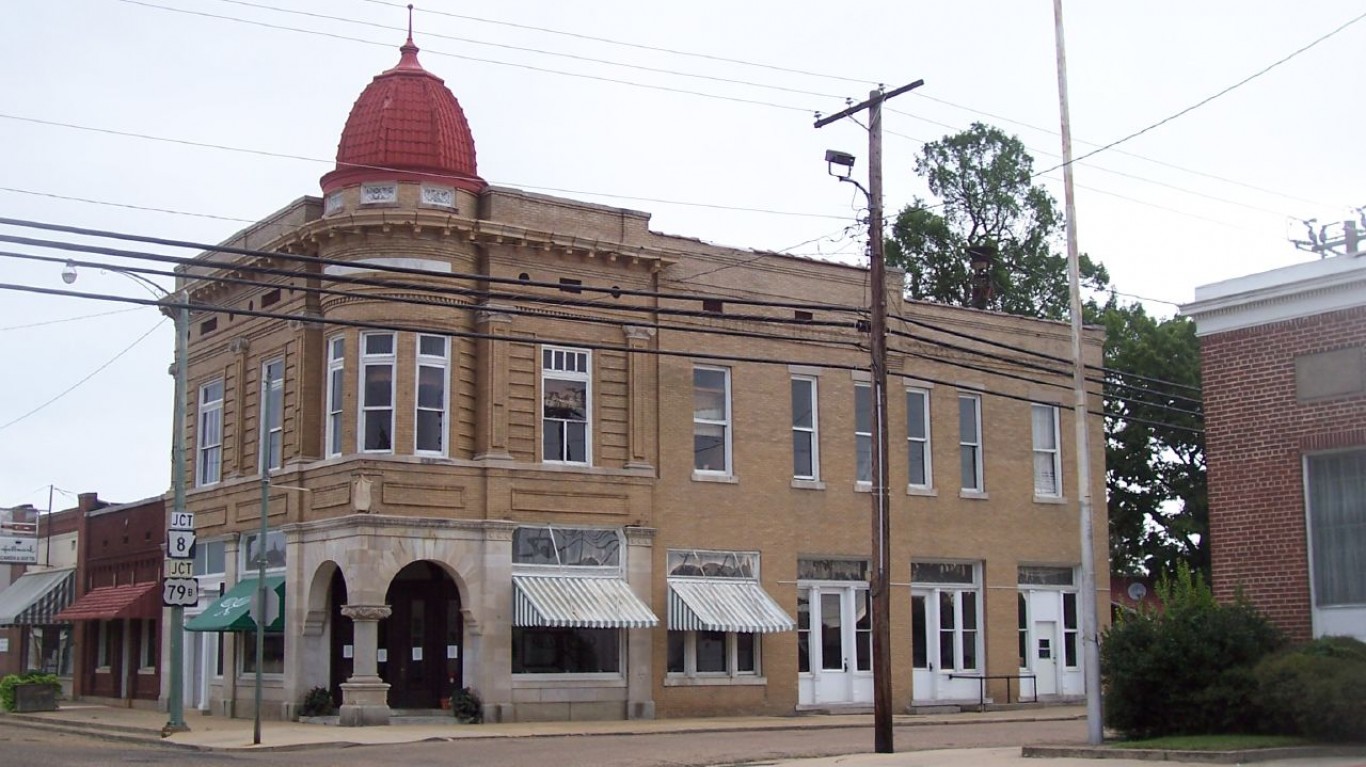
37. Fordyce, Arkansas
> Change in reported property crime rate, 2019-2020: -1,683.2
> Property crimes reported in 2020: 146 — 1,077th highest of 2,654 towns (tied)
> Property crimes reported in 2019: 213 — 818th highest of 2,654 towns (tied)
> Property crimes per 100K people in 2020: 4,004.4 — 206th highest of 2,654 towns
> Property crimes per 100K people in 2019: 5,687.6 — 85th highest of 2,654 towns
> Population: 3,849
[in-text-ad-2]
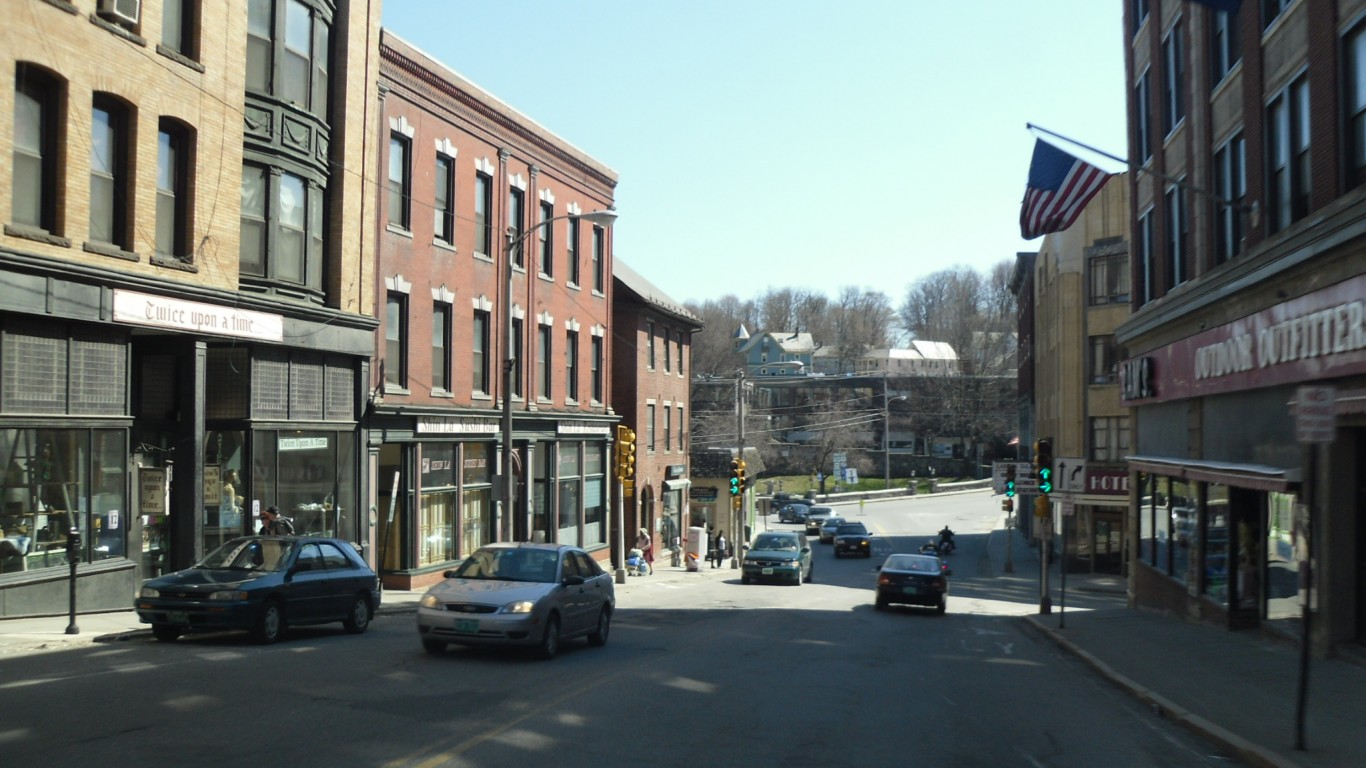
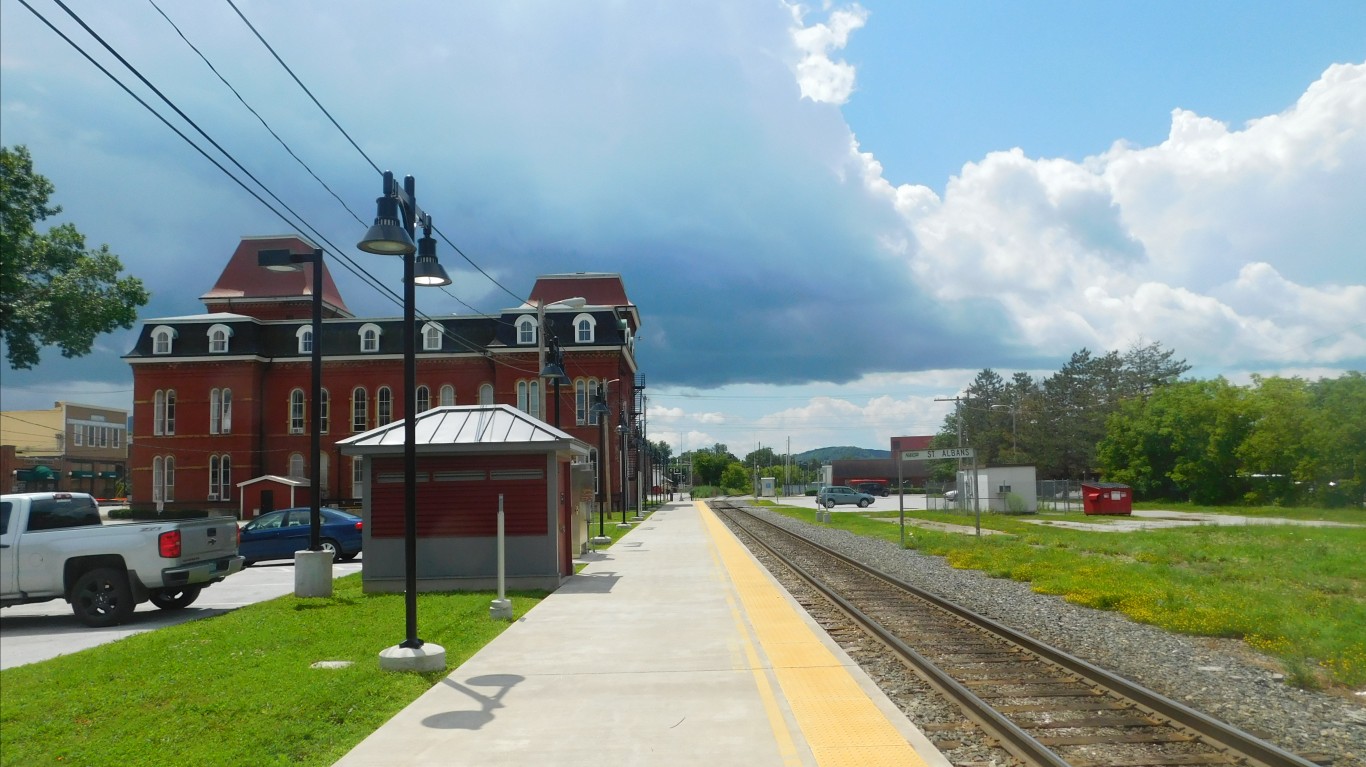
36. St. Albans, Vermont
> Change in reported property crime rate, 2019-2020: -1,685.5
> Property crimes reported in 2020: 217 — 758th highest of 2,654 towns (tied)
> Property crimes reported in 2019: 332 — 458th highest of 2,654 towns (tied)
> Property crimes per 100K people in 2020: 3,196.8 — 395th highest of 2,654 towns
> Property crimes per 100K people in 2019: 4,882.4 — 158th highest of 2,654 towns
> Population: 6,804

35. Florida City, Florida
> Change in reported property crime rate, 2019-2020: -1,710.5
> Property crimes reported in 2020: 657 — 78th highest of 2,654 towns
> Property crimes reported in 2019: 885 — 39th highest of 2,654 towns
> Property crimes per 100K people in 2020: 5,555.6 — 76th highest of 2,654 towns
> Property crimes per 100K people in 2019: 7,266.0 — 30th highest of 2,654 towns
> Population: 11,928
[in-text-ad]
34. Seward, Alaska
> Change in reported property crime rate, 2019-2020: -1,740.7
> Property crimes reported in 2020: 59 — 777th lowest of 2,654 towns (tied)
> Property crimes reported in 2019: 105 — 1,220th lowest of 2,654 towns (tied)
> Property crimes per 100K people in 2020: 2,102.6 — 874th highest of 2,654 towns
> Property crimes per 100K people in 2019: 3,843.3 — 297th highest of 2,654 towns
> Population: 2,773

33. Tahlequah, Oklahoma
> Change in reported property crime rate, 2019-2020: -1,749.7
> Property crimes reported in 2020: 456 — 228th highest of 2,654 towns (tied)
> Property crimes reported in 2019: 749 — 68th highest of 2,654 towns
> Property crimes per 100K people in 2020: 2,692.5 — 600th highest of 2,654 towns
> Property crimes per 100K people in 2019: 4,442.2 — 203rd highest of 2,654 towns
> Population: 16,667
32. Nebraska City, Nebraska
> Change in reported property crime rate, 2019-2020: -1,752.6
> Property crimes reported in 2020: 179 — 920th highest of 2,654 towns (tied)
> Property crimes reported in 2019: 306 — 521st highest of 2,654 towns (tied)
> Property crimes per 100K people in 2020: 2,454.7 — 694th highest of 2,654 towns
> Property crimes per 100K people in 2019: 4,207.3 — 234th highest of 2,654 towns
> Population: 7,273
[in-text-ad-2]

31. Elkton, Virginia
> Change in reported property crime rate, 2019-2020: -1,866.7
> Property crimes reported in 2020: 17 — 133rd lowest of 2,654 towns (tied)
> Property crimes reported in 2019: 71 — 879th lowest of 2,654 towns (tied)
> Property crimes per 100K people in 2020: 581.6 — 359th lowest of 2,654 towns
> Property crimes per 100K people in 2019: 2,448.3 — 770th highest of 2,654 towns
> Population: 2,846

30. Travelers Rest, South Carolina
> Change in reported property crime rate, 2019-2020: -1,924.7
> Property crimes reported in 2020: 213 — 777th highest of 2,654 towns (tied)
> Property crimes reported in 2019: 312 — 504th highest of 2,654 towns (tied)
> Property crimes per 100K people in 2020: 3,919.0 — 221st highest of 2,654 towns
> Property crimes per 100K people in 2019: 5,843.8 — 74th highest of 2,654 towns
> Population: 5,152
[in-text-ad]

29. Benton, Kentucky
> Change in reported property crime rate, 2019-2020: -1,947.8
> Property crimes reported in 2020: 81 — 1,030th lowest of 2,654 towns (tied)
> Property crimes reported in 2019: 168 — 1,015th highest of 2,654 towns (tied)
> Property crimes per 100K people in 2020: 1,818.2 — 1,057th highest of 2,654 towns
> Property crimes per 100K people in 2019: 3,766.0 — 312th highest of 2,654 towns
> Population: 4,477
28. Riverdale, Utah
> Change in reported property crime rate, 2019-2020: -1,954.5
> Property crimes reported in 2020: 389 — 313th highest of 2,654 towns (tied)
> Property crimes reported in 2019: 559 — 169th highest of 2,654 towns (tied)
> Property crimes per 100K people in 2020: 4,382.6 — 159th highest of 2,654 towns
> Property crimes per 100K people in 2019: 6,337.1 — 57th highest of 2,654 towns
> Population: 8,752
27. Bedford, Virginia
> Change in reported property crime rate, 2019-2020: -1,960.2
> Property crimes reported in 2020: 69 — 903rd lowest of 2,654 towns (tied)
> Property crimes reported in 2019: 198 — 883rd highest of 2,654 towns (tied)
> Property crimes per 100K people in 2020: 1,045.3 — 863rd lowest of 2,654 towns
> Property crimes per 100K people in 2019: 3,005.5 — 538th highest of 2,654 towns
> Population: 6,562
[in-text-ad-2]

26. Tukwila, Washington
> Change in reported property crime rate, 2019-2020: -1,973.4
> Property crimes reported in 2020: 2,953 — the highest of 2,654 towns
> Property crimes reported in 2019: 3,350 — the highest of 2,654 towns
> Property crimes per 100K people in 2020: 14,416.8 — 3rd highest of 2,654 towns
> Property crimes per 100K people in 2019: 16,390.2 — 4th highest of 2,654 towns
> Population: 20,196

25. Ketchikan, Alaska
> Change in reported property crime rate, 2019-2020: -2,053.0
> Property crimes reported in 2020: 250 — 631st highest of 2,654 towns (tied)
> Property crimes reported in 2019: 421 — 312th highest of 2,654 towns (tied)
> Property crimes per 100K people in 2020: 3,009.5 — 458th highest of 2,654 towns
> Property crimes per 100K people in 2019: 5,062.5 — 140th highest of 2,654 towns
> Population: 8,228
[in-text-ad]

24. Branson, Missouri
> Change in reported property crime rate, 2019-2020: -2,083.6
> Property crimes reported in 2020: 934 — 27th highest of 2,654 towns
> Property crimes reported in 2019: 1,173 — 13th highest of 2,654 towns
> Property crimes per 100K people in 2020: 7,952.3 — 19th highest of 2,654 towns
> Property crimes per 100K people in 2019: 10,035.9 — 8th highest of 2,654 towns
> Population: 11,416

23. Pineville, North Carolina
> Change in reported property crime rate, 2019-2020: -2,091.2
> Property crimes reported in 2020: 954 — 24th highest of 2,654 towns
> Property crimes reported in 2019: 1,131 — 15th highest of 2,654 towns
> Property crimes per 100K people in 2020: 10,353.8 — 8th highest of 2,654 towns
> Property crimes per 100K people in 2019: 12,445.0 — 7th highest of 2,654 towns
> Population: 8,749
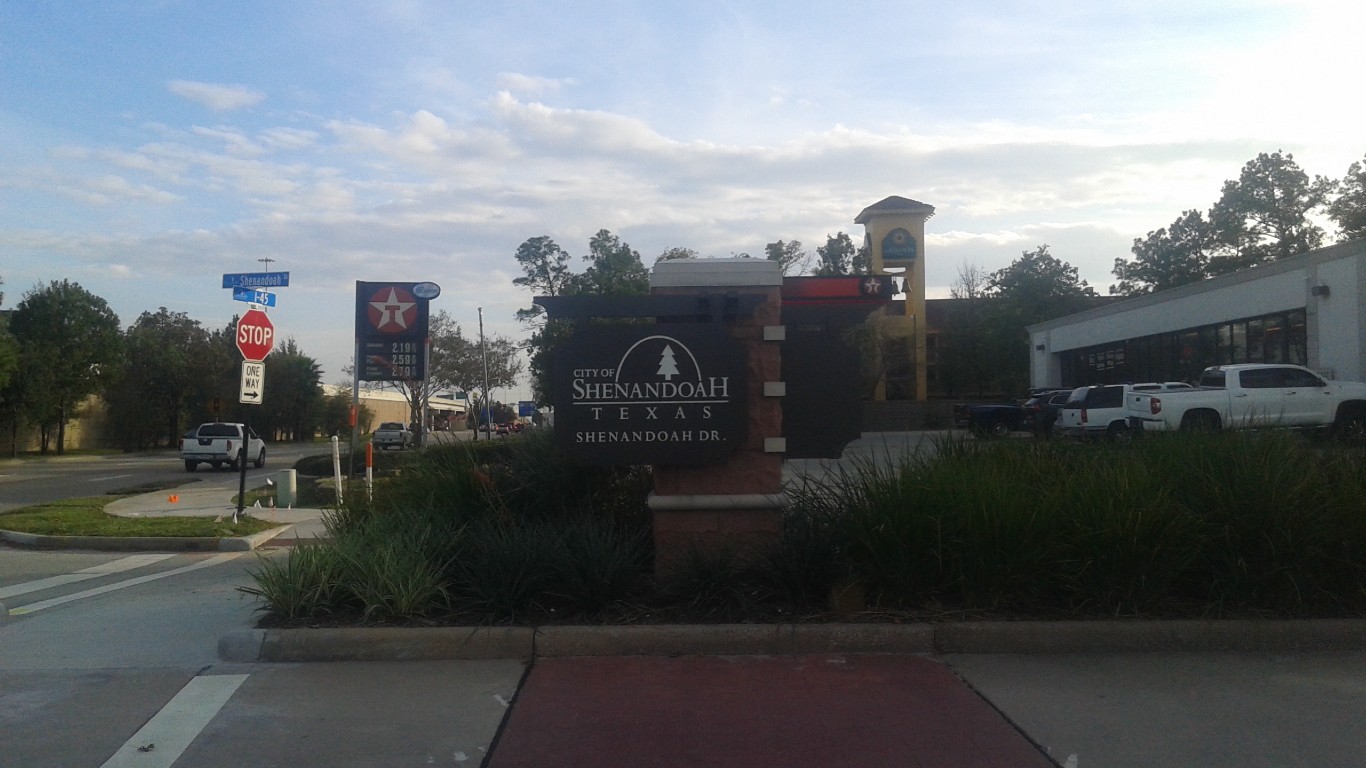
22. Shenandoah, Texas
> Change in reported property crime rate, 2019-2020: -2,124.2
> Property crimes reported in 2020: 201 — 829th highest of 2,654 towns (tied)
> Property crimes reported in 2019: 265 — 632nd highest of 2,654 towns (tied)
> Property crimes per 100K people in 2020: 6,488.1 — 36th highest of 2,654 towns
> Property crimes per 100K people in 2019: 8,612.3 — 15th highest of 2,654 towns
> Population: 2,887
[in-text-ad-2]
21. La Follette, Tennessee
> Change in reported property crime rate, 2019-2020: -2,220.8
> Property crimes reported in 2020: 190 — 877th highest of 2,654 towns (tied)
> Property crimes reported in 2019: 339 — 443rd highest of 2,654 towns (tied)
> Property crimes per 100K people in 2020: 2,876.2 — 513th highest of 2,654 towns
> Property crimes per 100K people in 2019: 5,097.0 — 135th highest of 2,654 towns
> Population: 6,857
20. Darlington, South Carolina
> Change in reported property crime rate, 2019-2020: -2,235.3
> Property crimes reported in 2020: 374 — 340th highest of 2,654 towns (tied)
> Property crimes reported in 2019: 505 — 218th highest of 2,654 towns (tied)
> Property crimes per 100K people in 2020: 6,344.4 — 41st highest of 2,654 towns
> Property crimes per 100K people in 2019: 8,579.7 — 16th highest of 2,654 towns
> Population: 6,043
[in-text-ad]

19. Wasilla, Alaska
> Change in reported property crime rate, 2019-2020: -2,276.7
> Property crimes reported in 2020: 341 — 401st highest of 2,654 towns
> Property crimes reported in 2019: 580 — 159th highest of 2,654 towns (tied)
> Property crimes per 100K people in 2020: 3,037.1 — 447th highest of 2,654 towns
> Property crimes per 100K people in 2019: 5,313.8 — 115th highest of 2,654 towns
> Population: 10,071

18. Kotzebue, Alaska
> Change in reported property crime rate, 2019-2020: -2,352.0
> Property crimes reported in 2020: 6 — 21st lowest of 2,654 towns (tied)
> Property crimes reported in 2019: 83 — 1,027th lowest of 2,654 towns (tied)
> Property crimes per 100K people in 2020: 184.7 — 38th lowest of 2,654 towns
> Property crimes per 100K people in 2019: 2,536.7 — 727th highest of 2,654 towns
> Population: 3,287
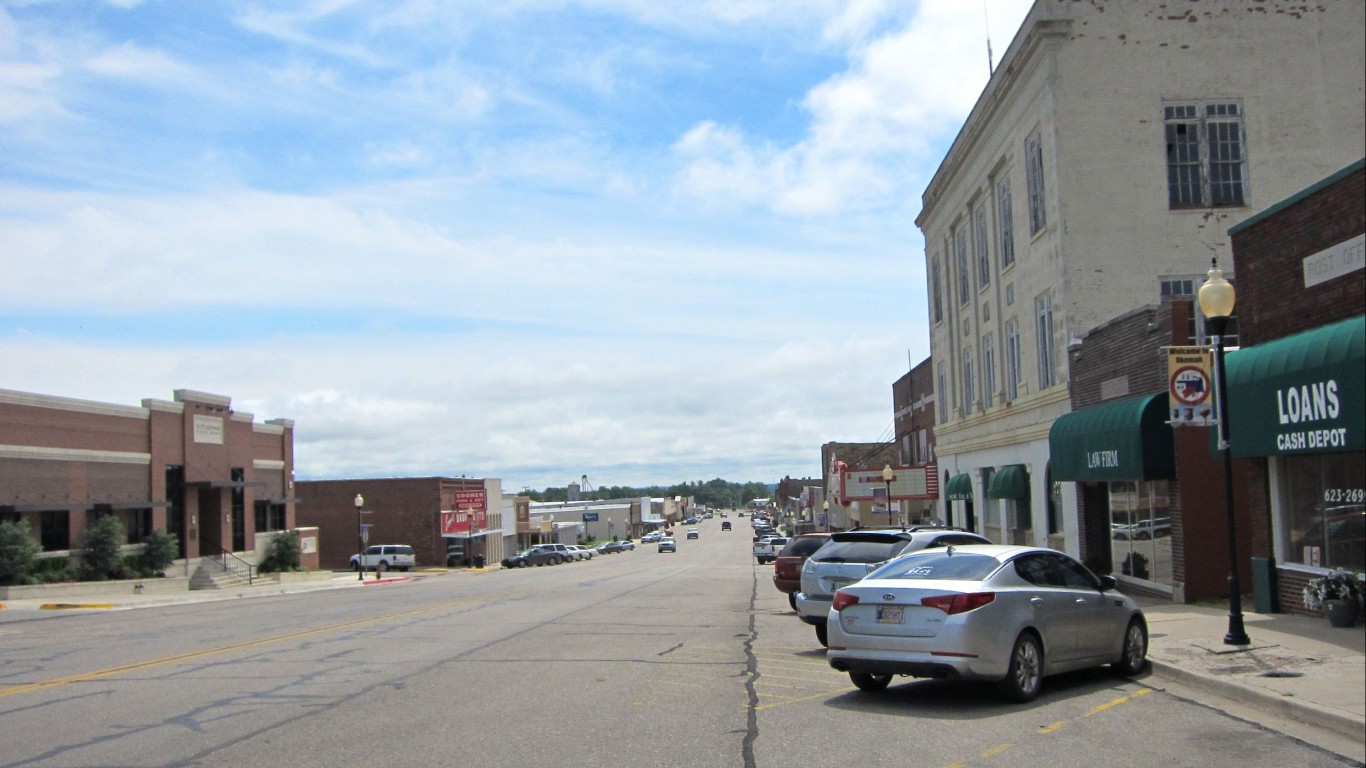
17. Okemah, Oklahoma
> Change in reported property crime rate, 2019-2020: -2,380.5
> Property crimes reported in 2020: 103 — 1,249th lowest of 2,654 towns (tied)
> Property crimes reported in 2019: 180 — 966th highest of 2,654 towns (tied)
> Property crimes per 100K people in 2020: 3,301.3 — 363rd highest of 2,654 towns
> Property crimes per 100K people in 2019: 5,681.8 — 86th highest of 2,654 towns
> Population: 3,178
[in-text-ad-2]
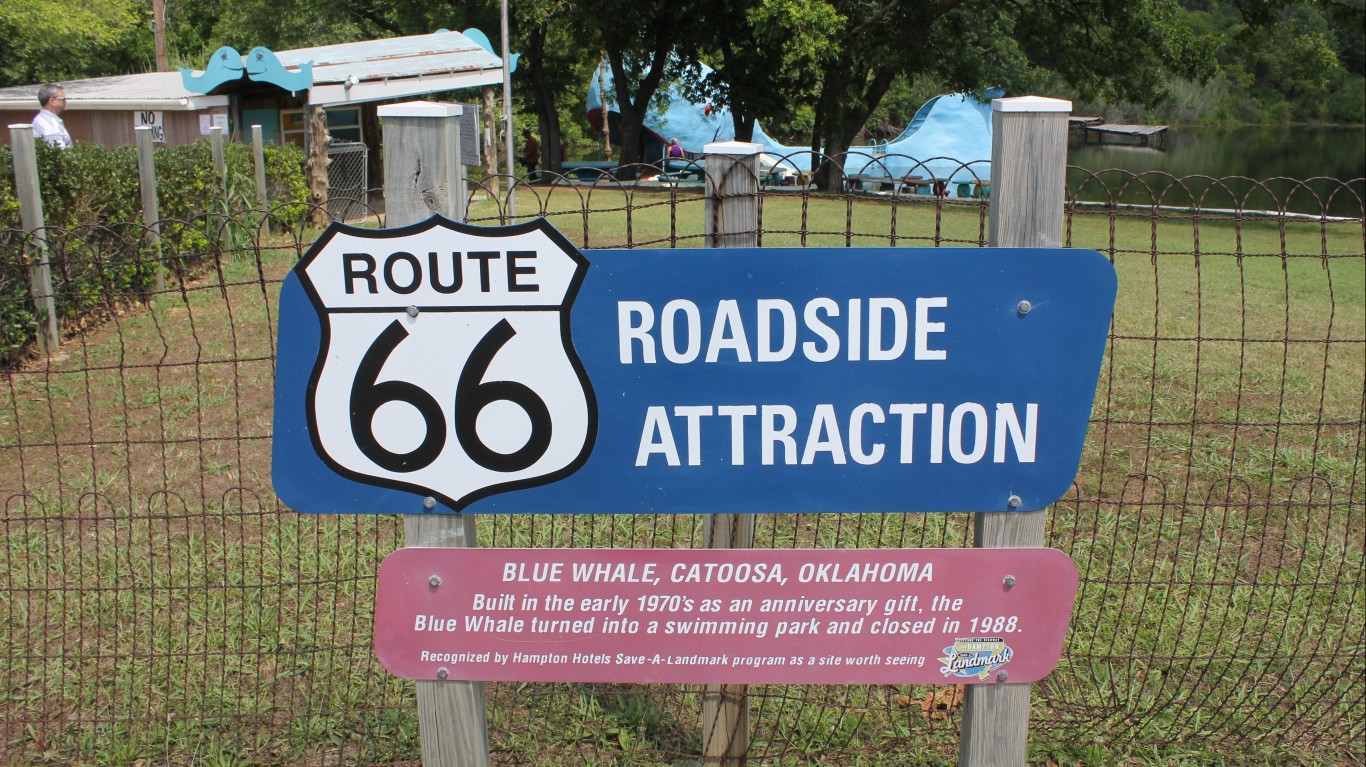
16. Catoosa, Oklahoma
> Change in reported property crime rate, 2019-2020: -2,414.2
> Property crimes reported in 2020: 248 — 637th highest of 2,654 towns (tied)
> Property crimes reported in 2019: 418 — 317th highest of 2,654 towns
> Property crimes per 100K people in 2020: 3,578.6 — 291st highest of 2,654 towns
> Property crimes per 100K people in 2019: 5,992.8 — 66th highest of 2,654 towns
> Population: 7,705

15. Wilmington, Ohio
> Change in reported property crime rate, 2019-2020: -2,428.6
> Property crimes reported in 2020: 349 — 386th highest of 2,654 towns (tied)
> Property crimes reported in 2019: 651 — 110th highest of 2,654 towns (tied)
> Property crimes per 100K people in 2020: 2,825.2 — 537th highest of 2,654 towns
> Property crimes per 100K people in 2019: 5,253.8 — 121st highest of 2,654 towns
> Population: 12,392
[in-text-ad]

14. Pinole, California
> Change in reported property crime rate, 2019-2020: -2,455.0
> Property crimes reported in 2020: 387 — 315th highest of 2,654 towns (tied)
> Property crimes reported in 2019: 866 — 44th highest of 2,654 towns
> Property crimes per 100K people in 2020: 2,000.0 — 934th highest of 2,654 towns
> Property crimes per 100K people in 2019: 4,455.0 — 202nd highest of 2,654 towns
> Population: 19,279
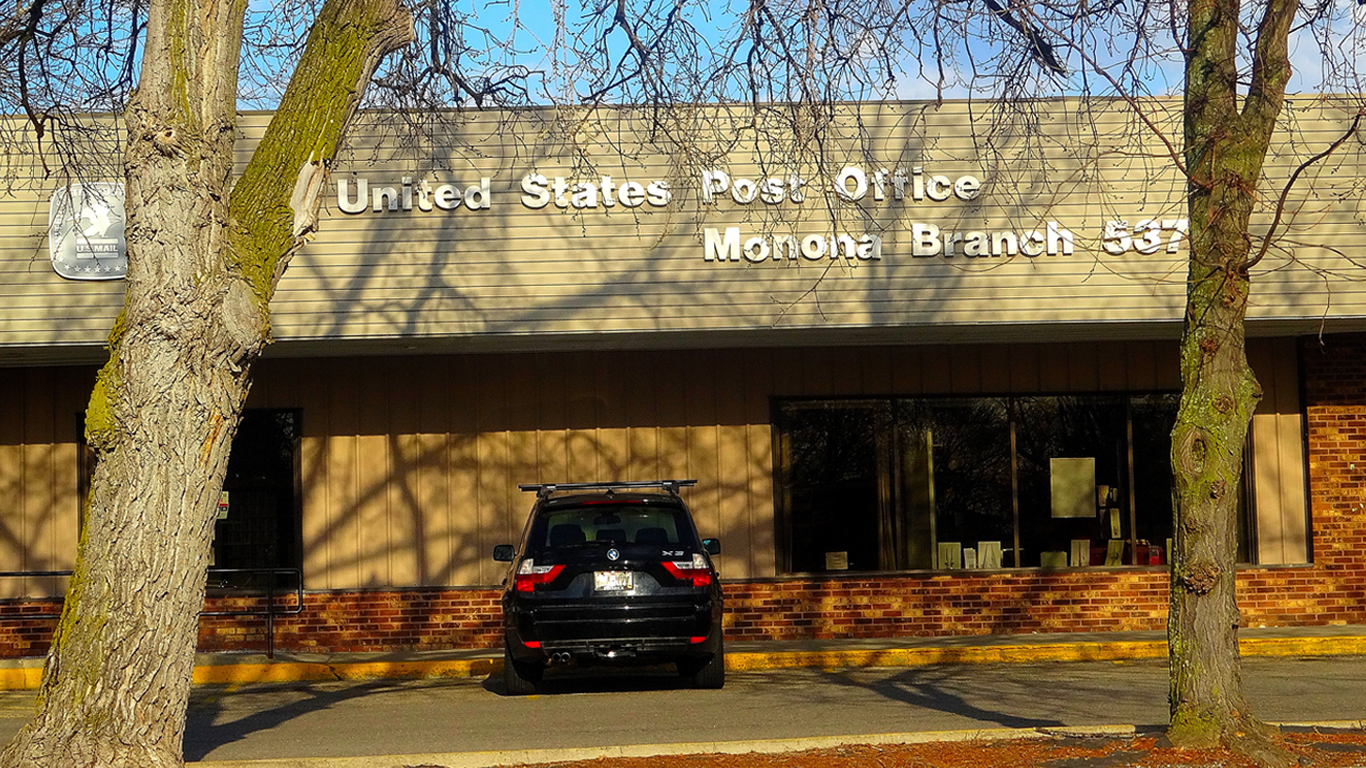
13. Monona, Wisconsin
> Change in reported property crime rate, 2019-2020: -2,494.8
> Property crimes reported in 2020: 429 — 266th highest of 2,654 towns (tied)
> Property crimes reported in 2019: 624 — 131st highest of 2,654 towns (tied)
> Property crimes per 100K people in 2020: 5,203.2 — 95th highest of 2,654 towns
> Property crimes per 100K people in 2019: 7,698.0 — 24th highest of 2,654 towns
> Population: 8,122

12. Clinton, Arkansas
> Change in reported property crime rate, 2019-2020: -2,663.7
> Property crimes reported in 2020: 47 — 615th lowest of 2,654 towns (tied)
> Property crimes reported in 2019: 113 — 1,278th lowest of 2,654 towns (tied)
> Property crimes per 100K people in 2020: 1,876.2 — 1,021st highest of 2,654 towns
> Property crimes per 100K people in 2019: 4,540.0 — 195th highest of 2,654 towns
> Population: 2,547
[in-text-ad-2]

11. Pikeville, Kentucky
> Change in reported property crime rate, 2019-2020: -2,829.5
> Property crimes reported in 2020: 177 — 934th highest of 2,654 towns (tied)
> Property crimes reported in 2019: 366 — 388th highest of 2,654 towns (tied)
> Property crimes per 100K people in 2020: 2,722.7 — 586th highest of 2,654 towns
> Property crimes per 100K people in 2019: 5,552.2 — 95th highest of 2,654 towns
> Population: 6,810
10. Hartsville, South Carolina
> Change in reported property crime rate, 2019-2020: -2,893.4
> Property crimes reported in 2020: 450 — 236th highest of 2,654 towns (tied)
> Property crimes reported in 2019: 668 — 100th highest of 2,654 towns (tied)
> Property crimes per 100K people in 2020: 5,984.8 — 53rd highest of 2,654 towns
> Property crimes per 100K people in 2019: 8,878.3 — 12th highest of 2,654 towns
> Population: 7,616
[in-text-ad]
9. Elizabethtown, North Carolina
> Change in reported property crime rate, 2019-2020: -2,914.4
> Property crimes reported in 2020: 121 — 1,239th highest of 2,654 towns (tied)
> Property crimes reported in 2019: 225 — 758th highest of 2,654 towns (tied)
> Property crimes per 100K people in 2020: 3,613.0 — 280th highest of 2,654 towns
> Property crimes per 100K people in 2019: 6,527.4 — 47th highest of 2,654 towns
> Population: 3,464
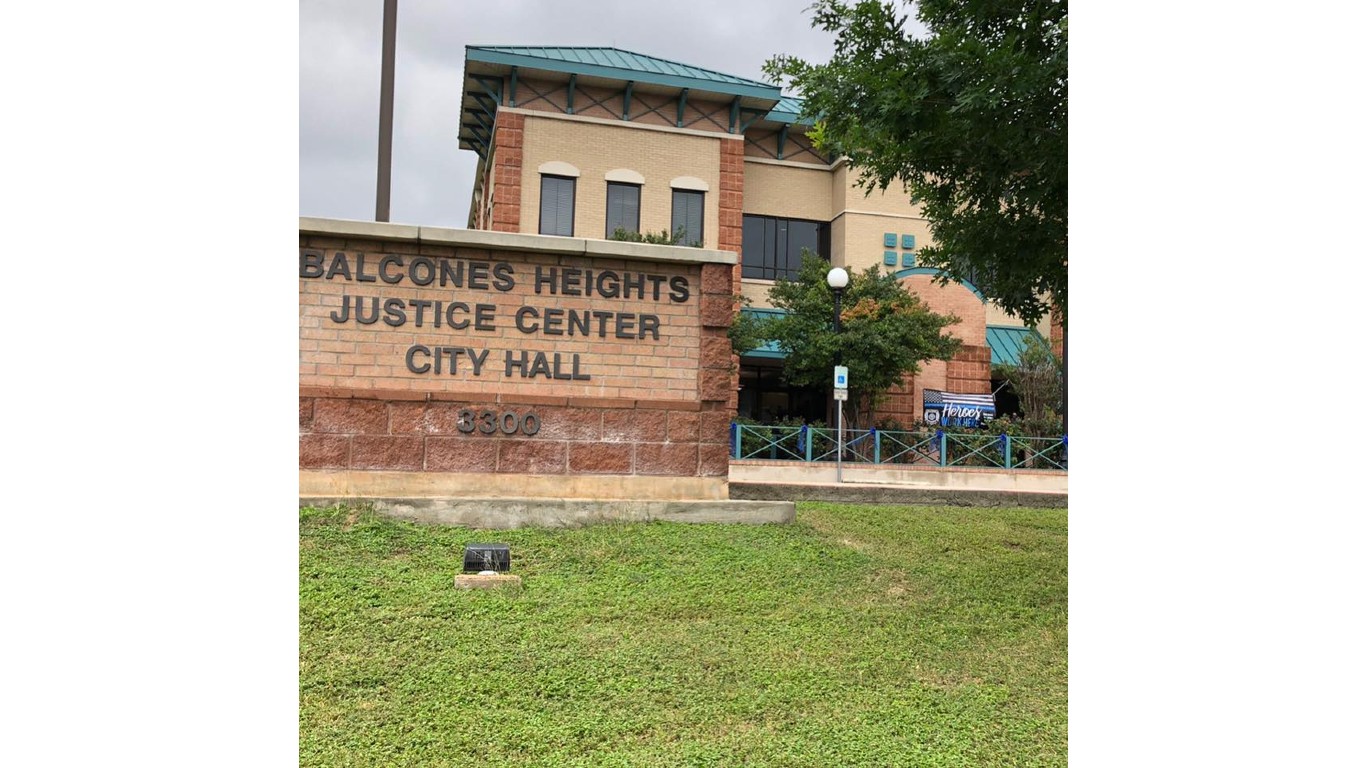
8. Balcones Heights, Texas
> Change in reported property crime rate, 2019-2020: -2,993.4
> Property crimes reported in 2020: 203 — 821st highest of 2,654 towns (tied)
> Property crimes reported in 2019: 304 — 524th highest of 2,654 towns (tied)
> Property crimes per 100K people in 2020: 6,038.1 — 51st highest of 2,654 towns
> Property crimes per 100K people in 2019: 9,031.5 — 10th highest of 2,654 towns
> Population: 3,282

7. Union Gap, Washington
> Change in reported property crime rate, 2019-2020: -3,257.2
> Property crimes reported in 2020: 382 — 325th highest of 2,654 towns (tied)
> Property crimes reported in 2019: 580 — 159th highest of 2,654 towns (tied)
> Property crimes per 100K people in 2020: 6,155.3 — 45th highest of 2,654 towns
> Property crimes per 100K people in 2019: 9,412.5 — 9th highest of 2,654 towns
> Population: 6,163
[in-text-ad-2]
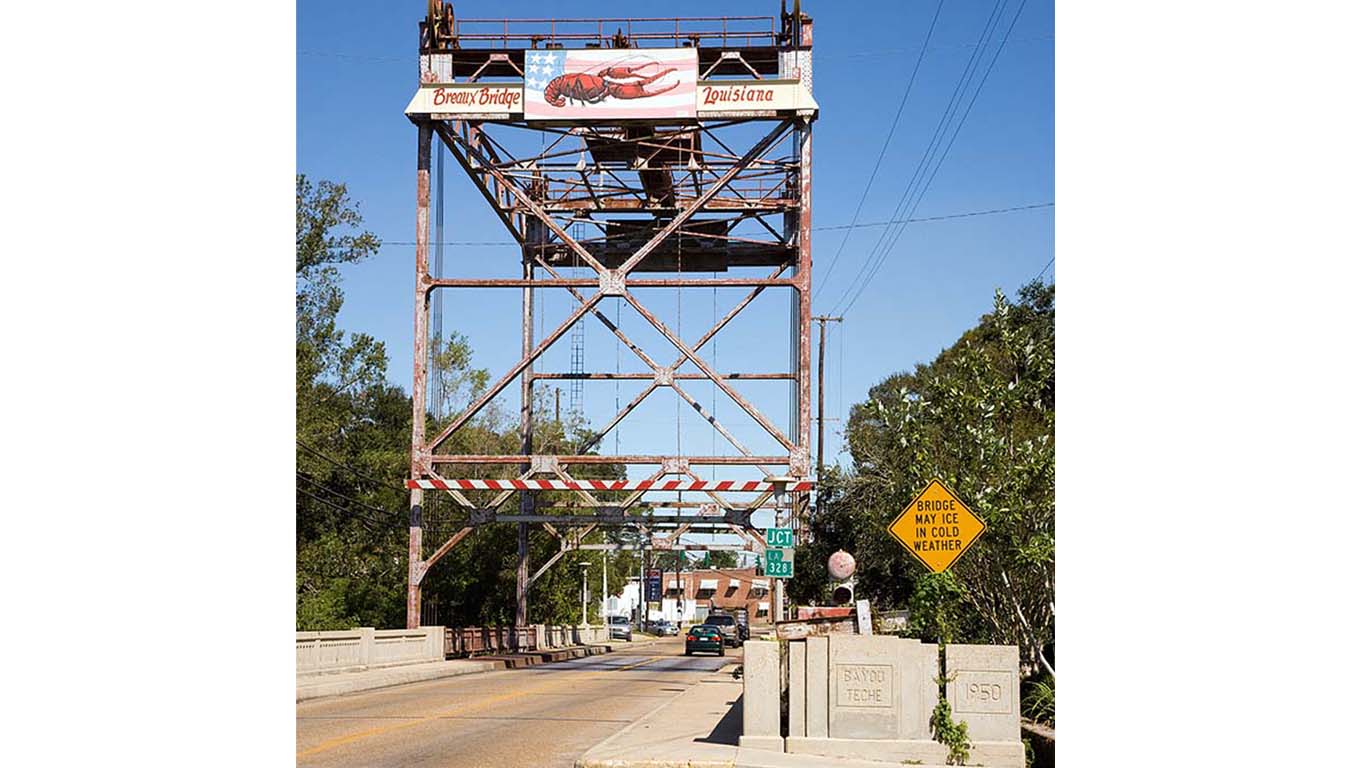
6. Breaux Bridge, Louisiana
> Change in reported property crime rate, 2019-2020: -3,295.3
> Property crimes reported in 2020: 330 — 413th highest of 2,654 towns (tied)
> Property crimes reported in 2019: 605 — 141st highest of 2,654 towns (tied)
> Property crimes per 100K people in 2020: 4,049.6 — 197th highest of 2,654 towns
> Property crimes per 100K people in 2019: 7,344.9 — 28th highest of 2,654 towns
> Population: 8,262

5. Page, Arizona
> Change in reported property crime rate, 2019-2020: -3,538.7
> Property crimes reported in 2020: 267 — 583rd highest of 2,654 towns (tied)
> Property crimes reported in 2019: 537 — 188th highest of 2,654 towns (tied)
> Property crimes per 100K people in 2020: 3,538.3 — 309th highest of 2,654 towns
> Property crimes per 100K people in 2019: 7,077.0 — 34th highest of 2,654 towns
> Population: 7,531
[in-text-ad]
4. Kenai, Alaska
> Change in reported property crime rate, 2019-2020: -3,795.9
> Property crimes reported in 2020: 148 — 1,068th highest of 2,654 towns (tied)
> Property crimes reported in 2019: 446 — 281st highest of 2,654 towns (tied)
> Property crimes per 100K people in 2020: 1,877.0 — 1,019th highest of 2,654 towns
> Property crimes per 100K people in 2019: 5,672.9 — 88th highest of 2,654 towns
> Population: 7,742

3. Lake Delton, Wisconsin
> Change in reported property crime rate, 2019-2020: -6,356.8
> Property crimes reported in 2020: 266 — 587th highest of 2,654 towns (tied)
> Property crimes reported in 2019: 458 — 264th highest of 2,654 towns (tied)
> Property crimes per 100K people in 2020: 8,884.4 — 12th highest of 2,654 towns
> Property crimes per 100K people in 2019: 15,241.3 — 5th highest of 2,654 towns
> Population: 2,989

2. Emeryville, California
> Change in reported property crime rate, 2019-2020: -9,433.7
> Property crimes reported in 2020: 1,449 — 3rd highest of 2,654 towns
> Property crimes reported in 2019: 2,623 — 2nd highest of 2,654 towns
> Property crimes per 100K people in 2020: 11,753.7 — 6th highest of 2,654 towns
> Property crimes per 100K people in 2019: 21,187.4 — 2nd highest of 2,654 towns
> Population: 11,899
[in-text-ad-2]
1. West Milwaukee, Wisconsin
> Change in reported property crime rate, 2019-2020: -13,715.1
> Property crimes reported in 2020: 898 — 35th highest of 2,654 towns
> Property crimes reported in 2019: 1,467 — 3rd highest of 2,654 towns
> Property crimes per 100K people in 2020: 22,004.4 — the highest of 2,654 towns
> Property crimes per 100K people in 2019: 35,719.5 — the highest of 2,654 towns
> Population: 4,146
Methodology
To determine the towns where property crime is falling fastest, 24/7 Wall St. reviewed the change in property crimes per 100,000 people from the FBI’s 2019 and 2020 Uniform Crime Reports. Property crime includes larceny-theft, burglary, and motor vehicle theft. Crime rates were calculated using population figures provided by the FBI in the 2020 and 2019 UCR.
We defined towns based on population thresholds — having at least 2,500 people and less than 25,000 people — using five-year estimates from the U.S. Census Bureau’s 2019 American Community Survey. Limited data was available in the 2020 UCR for areas in Alabama, Maryland, Pennsylvania, and Illinois, though towns in these states were not excluded from analysis. Because some state and local agencies changed reporting practices between 2019 and 2020, the figures are not comparable, and these areas were excluded.
Population figures are five-year estimates from the U.S. Census Bureau’s 2019 American Community Survey. However, these estimates were not used to calculate crime rates.
It’s Your Money, Your Future—Own It (sponsor)
Retirement can be daunting, but it doesn’t need to be.
Imagine having an expert in your corner to help you with your financial goals. Someone to help you determine if you’re ahead, behind, or right on track. With SmartAsset, that’s not just a dream—it’s reality. This free tool connects you with pre-screened financial advisors who work in your best interests. It’s quick, it’s easy, so take the leap today and start planning smarter!
Don’t waste another minute; get started right here and help your retirement dreams become a retirement reality.
Thank you for reading! Have some feedback for us?
Contact the 24/7 Wall St. editorial team.

 24/7 Wall St.


 24/7 Wall St.


 24/7 Wall St.

 24/7 Wall St.