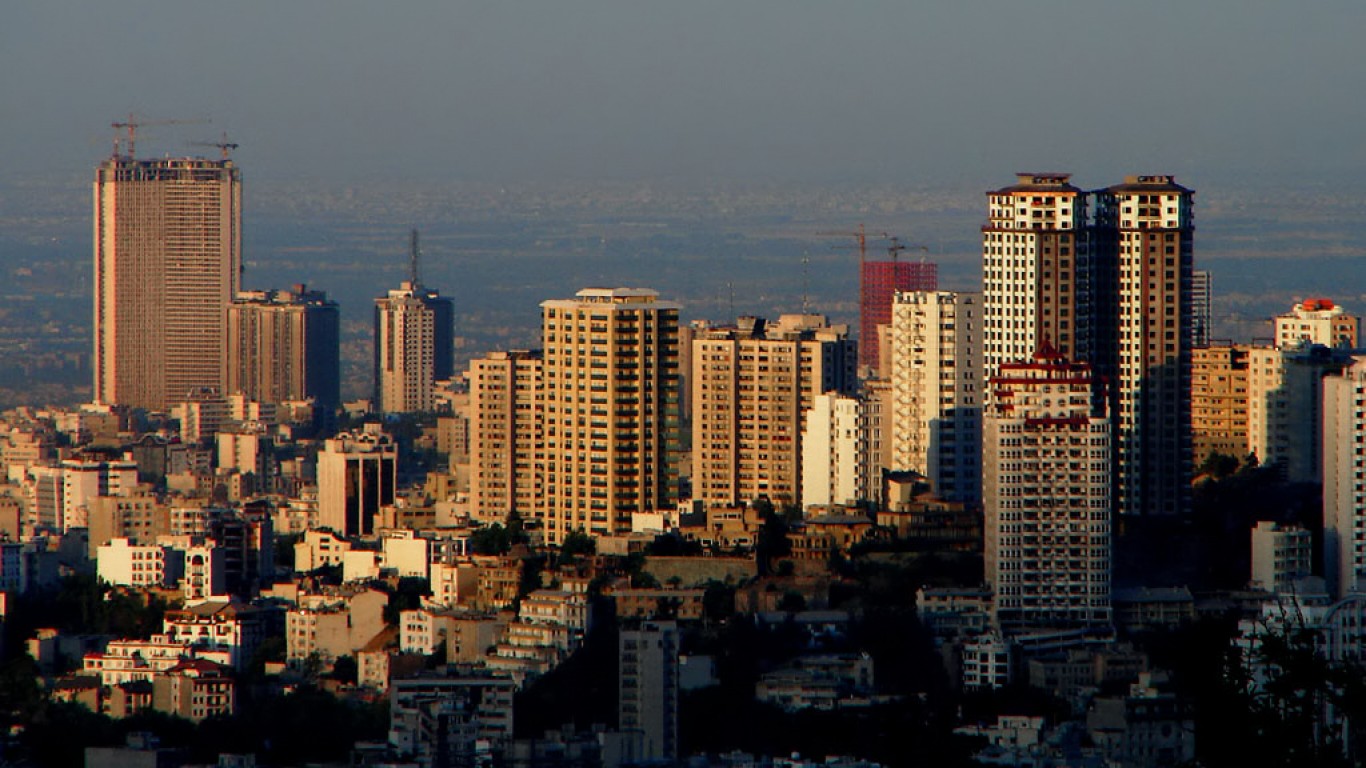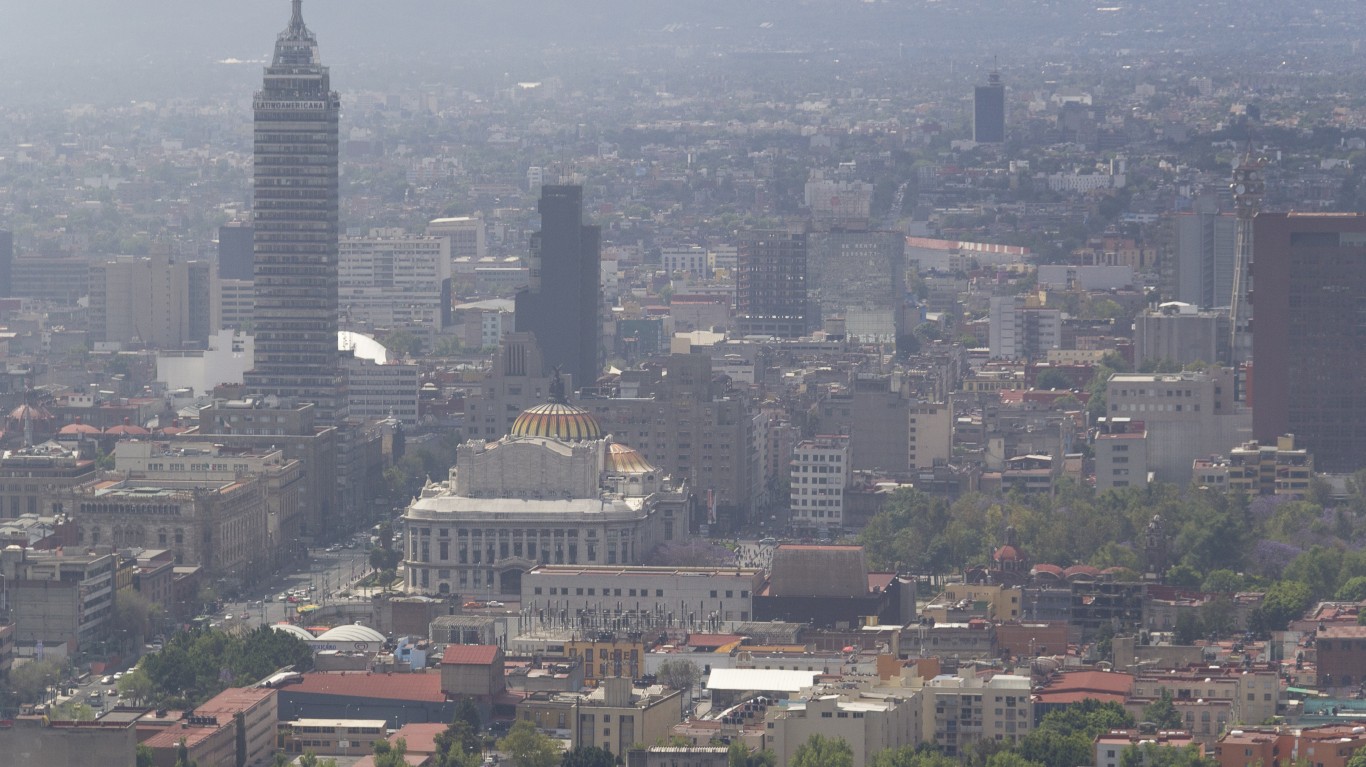
Cities are centers for commerce, industry, transportation, and city dwellers benefit from the education, employment, and social/recreational opportunities that an urban lifestyle offers. Cities, however, are also the most polluted places on Earth. And urban air pollution is a killer.
According to the World Health Organization, 4.2 million people die every year as a result of air pollution. While non-urban populations are exposed to some natural occurring air pollutants, such as surface dust and pollution from volcanic eruptions, and to the human-caused pollution from agriculture, power generation, and cars, urban populations, particularly in the world’s densest cities, suffer disproportionately from unhealthy air. (These are cities emitting the most carbon dioxide in the world.)
To identify the 22 cities with the worst air pollution in the world, 24/7 Wall St. reviewed air quality data for 95 of the most polluted cities from the IQAir 2021 World Air Quality Report. Data was pulled on April 8, 2022 at 10:30 a.m. Cities were ranked by PM2.5 concentrations in micrograms per cubic meter (μg/m3). PM2.5 is defined as particulate matter that is 2.5 microns or smaller in diameter — or about 36 times smaller than a grain of fine beach sand. Population figures for 2022 come from World Population Review.
Vehicles are responsible for a full 75% of all volatile organic compounds and 25% of particulate matter in urban air pollution, with the greatest impact in poorer countries where older cars emit dirtier exhaust. Domestic use of fossil fuels for cooking, heating, and light is another major source of pollution, with half the world’s population burning coal, wood, or charcoal in inefficient stoves, and 1.2 billion people burning kerosene for lighting.
Heavily industrialized cities suffer from the worst quality air, with smokestacks emitting not just conventional pollutants, like particulates, but also a plethora of chemicals, many of them highly toxic. And feeding these industries, as well as commerce and residences, are power generators, fueled by highly polluting coal, oil, and gas, where alternative clean energy has not made a significant showing. (These are 23 places where industrial air pollution is so bad it causes cancer.)
Not surprisingly, five of the 20 most populous cities in the world – Beijing, Delhi, Mexico City, Mumbai, and Karachi, which range in size from nearly 16 million to over 21 million people – are also among the 20 most polluted. More remarkable are the five cities of less than 3 million people in size that also make the most-polluted list – Krasnoyarsk, Russia; Dubai, United Arab Emirates; Tashkent, Uzbekistan; Kathmandu, Nepal; and Chiang Mai, Thailand.
Click here to see the most polluted cities in the world

22. Santiago, Chile
> Air quality ranking April 8, 2022: 101, 22 worst among 95 major cities
> Avg. annual PM2.5 concentration (μg/m³) in 2021: 25.8
> Worst month in 2021: July (51.1)
> Avg. annual PM2.5 concentration in 2020: 23.6
> Total population in 2022: 6,856,939
[in-text-ad]
21. Krasnoyarsk, Russia
> Air quality ranking April 8, 2022: 104, 21 worst among 95 major cities
> Avg. annual PM2.5 concentration (μg/m³) in 2021: 49.8
> Worst month in 2021: August (148.4)
> Avg. annual PM2.5 concentration in 2020: 14.7
> Total population in 2022: 1,158,761

20. Mumbai, India
> Air quality ranking April 8, 2022: 106, 20 worst among 95 major cities
> Avg. annual PM2.5 concentration (μg/m³) in 2021: 46.4
> Worst month in 2021: January (98.5)
> Avg. annual PM2.5 concentration in 2020: 41.3
> Total population in 2022: 20,961,472
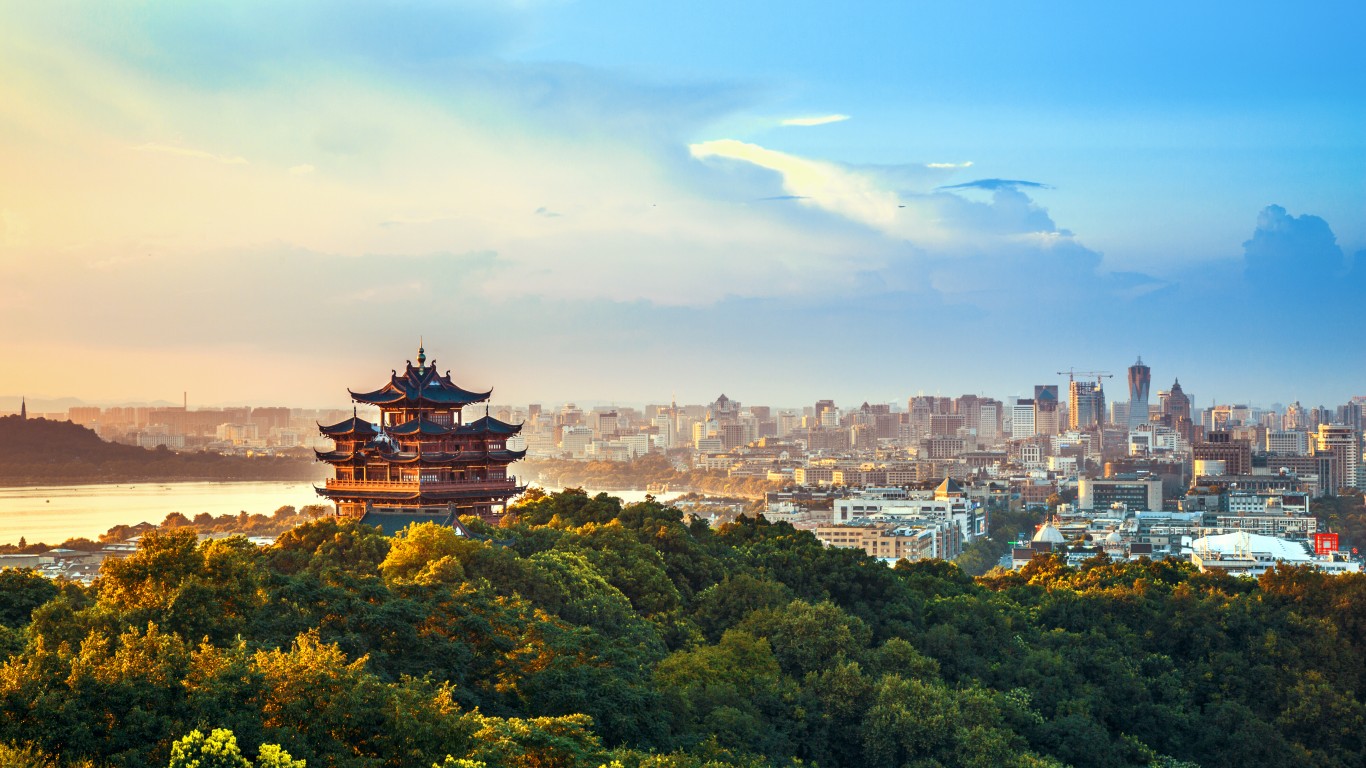
19. Hangzhou, China
> Air quality ranking April 8, 2022: 108, 19 worst among 95 major cities
> Avg. annual PM2.5 concentration (μg/m³) in 2021: 27.4
> Worst month in 2021: December (45.8)
> Avg. annual PM2.5 concentration in 2020: 29.0
> Total population in 2022: 8,044,878
[in-text-ad-2]
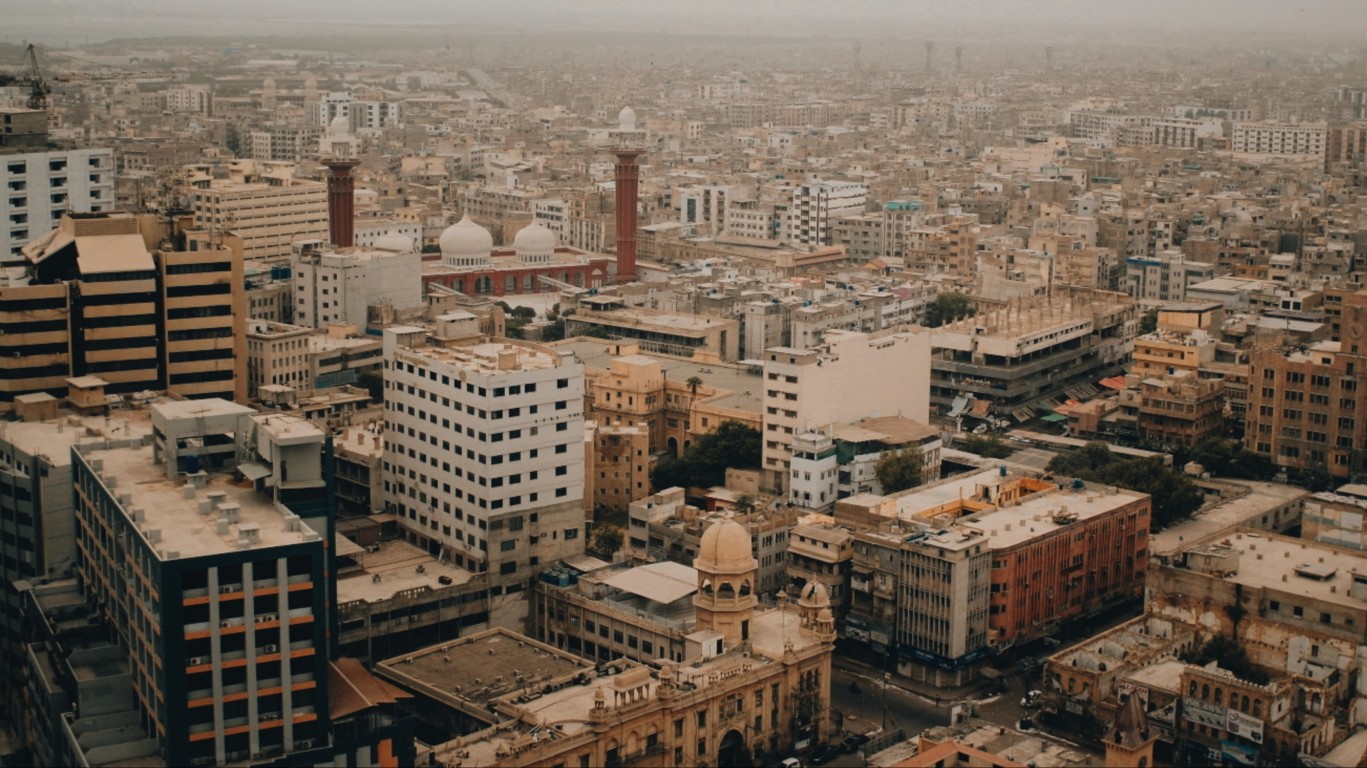
18. Karachi, Pakistan
> Air quality ranking April 8, 2022: 112, 18 worst among 95 major cities
> Avg. annual PM2.5 concentration (μg/m³) in 2021: 45.9
> Worst month in 2021: January (97.9)
> Avg. annual PM2.5 concentration in 2020: 43.8
> Total population in 2022: 16,839,950
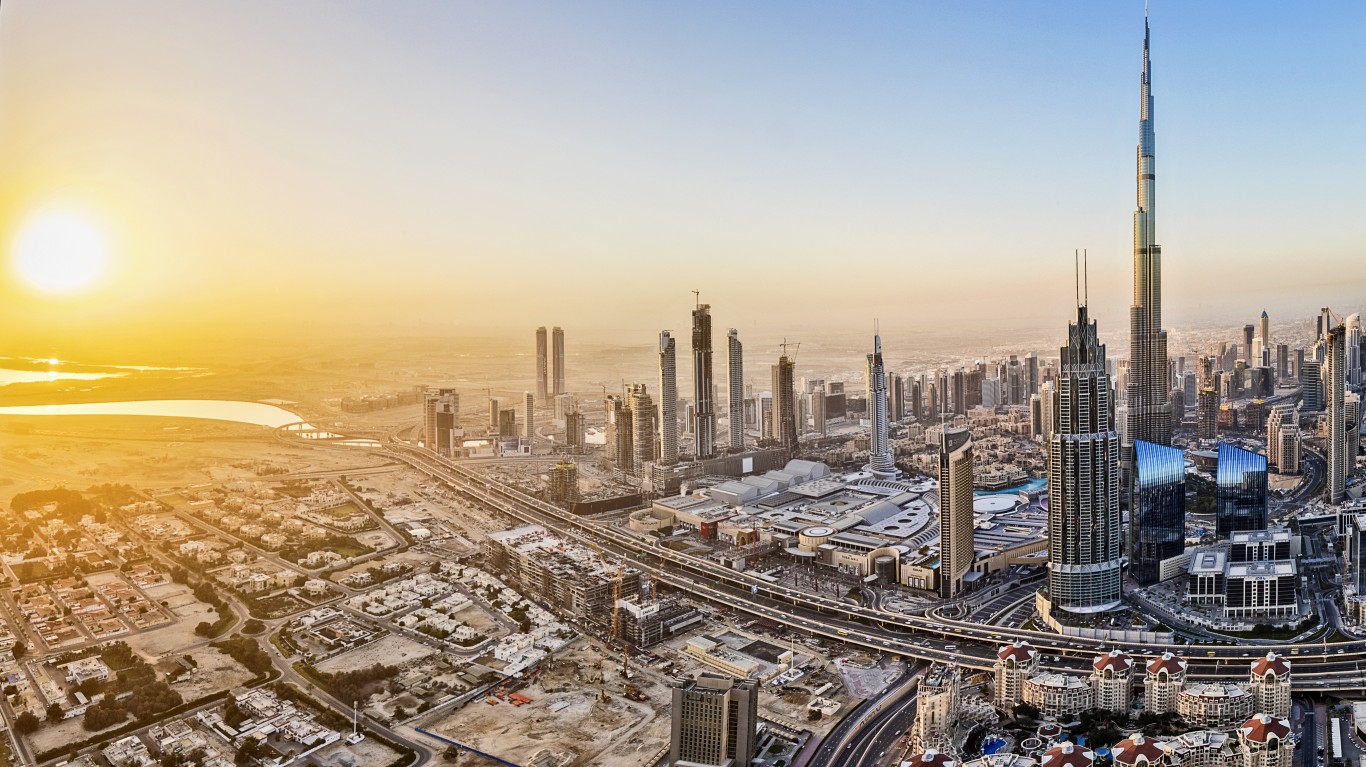
17. Dubai, United Arab Emirates
> Air quality ranking April 8, 2022: 113, 17 worst among 95 major cities
> Avg. annual PM2.5 concentration (μg/m³) in 2021: 36.9
> Worst month in 2021: July (47.6)
> Avg. annual PM2.5 concentration in 2020: 32.6
> Total population in 2022: 2,964,382
[in-text-ad]
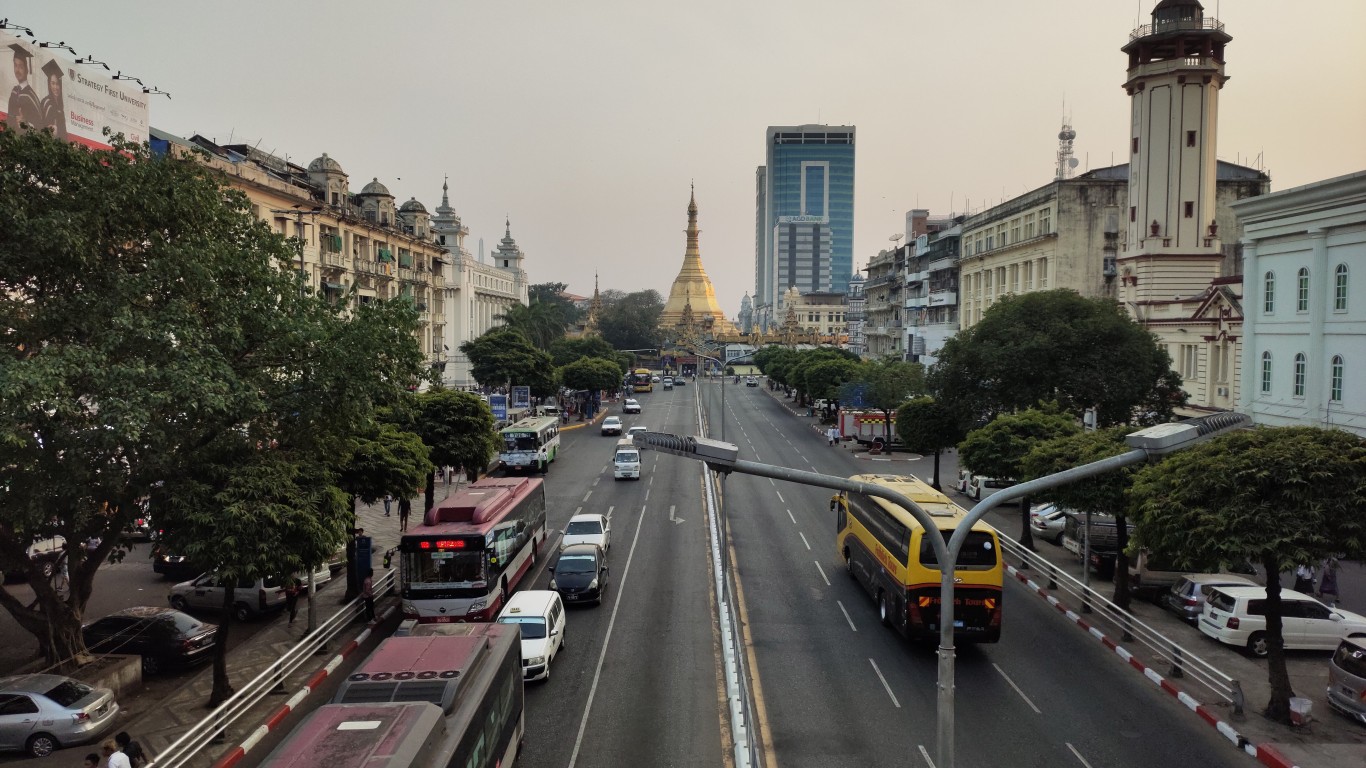
16. Yangon, Myanmar
> Air quality ranking April 8, 2022: 118, 16 worst among 95 major cities
> Avg. annual PM2.5 concentration (μg/m³) in 2021: 26.4
> Worst month in 2021: March (57.3)
> Avg. annual PM2.5 concentration in 2020: 29.4
> Total population in 2022: 5,514,454

15. Tashkent, Uzbekistan
> Air quality ranking April 8, 2022: 122, 15 worst among 95 major cities
> Avg. annual PM2.5 concentration (μg/m³) in 2021: 42.8
> Worst month in 2021: November (95.9)
> Avg. annual PM2.5 concentration in 2020: 29.9
> Total population in 2022: 2,573,758
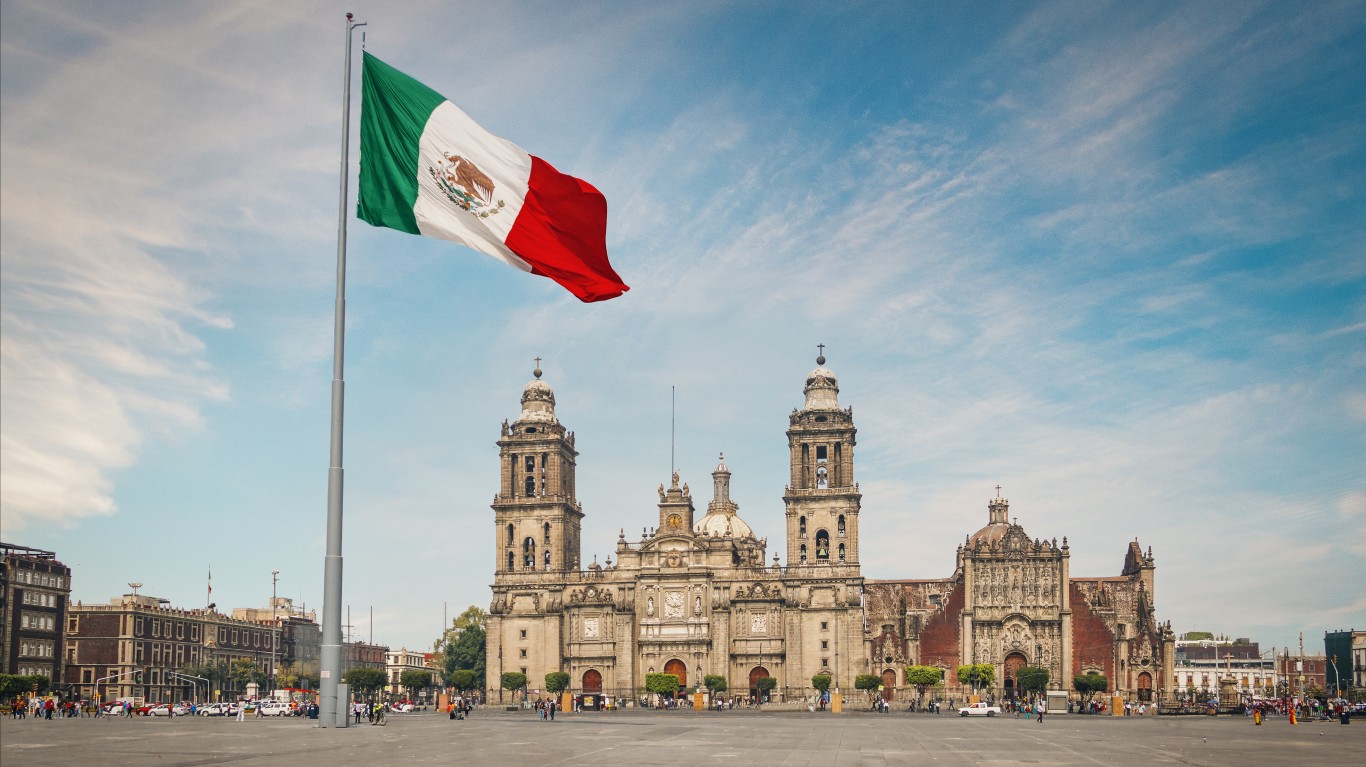
14. Mexico City, Mexico
> Air quality ranking April 8, 2022: 131, 14 worst among 95 major cities
> Avg. annual PM2.5 concentration (μg/m³) in 2021: 21.7
> Worst month in 2021: April (32.0)
> Avg. annual PM2.5 concentration in 2020: 18.8
> Total population in 2022: 22,085,140
[in-text-ad-2]

13. Dhaka, Bangladesh
> Air quality ranking April 8, 2022: 132, 13 worst among 95 major cities
> Avg. annual PM2.5 concentration (μg/m³) in 2021: 78.1
> Worst month in 2021: January (188.6)
> Avg. annual PM2.5 concentration in 2020: 77.1
> Total population in 2022: 22,478,116

12. Kathmandu, Nepal
> Air quality ranking April 8, 2022: 139, 12 worst among 95 major cities
> Avg. annual PM2.5 concentration (μg/m³) in 2021: 50.9
> Worst month in 2021: March (108.6)
> Avg. annual PM2.5 concentration in 2020: 39.2
> Total population in 2022: 1,521,057
[in-text-ad]

11. Wuhan, China
> Air quality ranking April 8, 2022: 143, 11 worst among 95 major cities
> Avg. annual PM2.5 concentration (μg/m³) in 2021: 46.7
> Worst month in 2021: December (85.9)
> Avg. annual PM2.5 concentration in 2020: 36.5
> Total population in 2022: 8,591,611
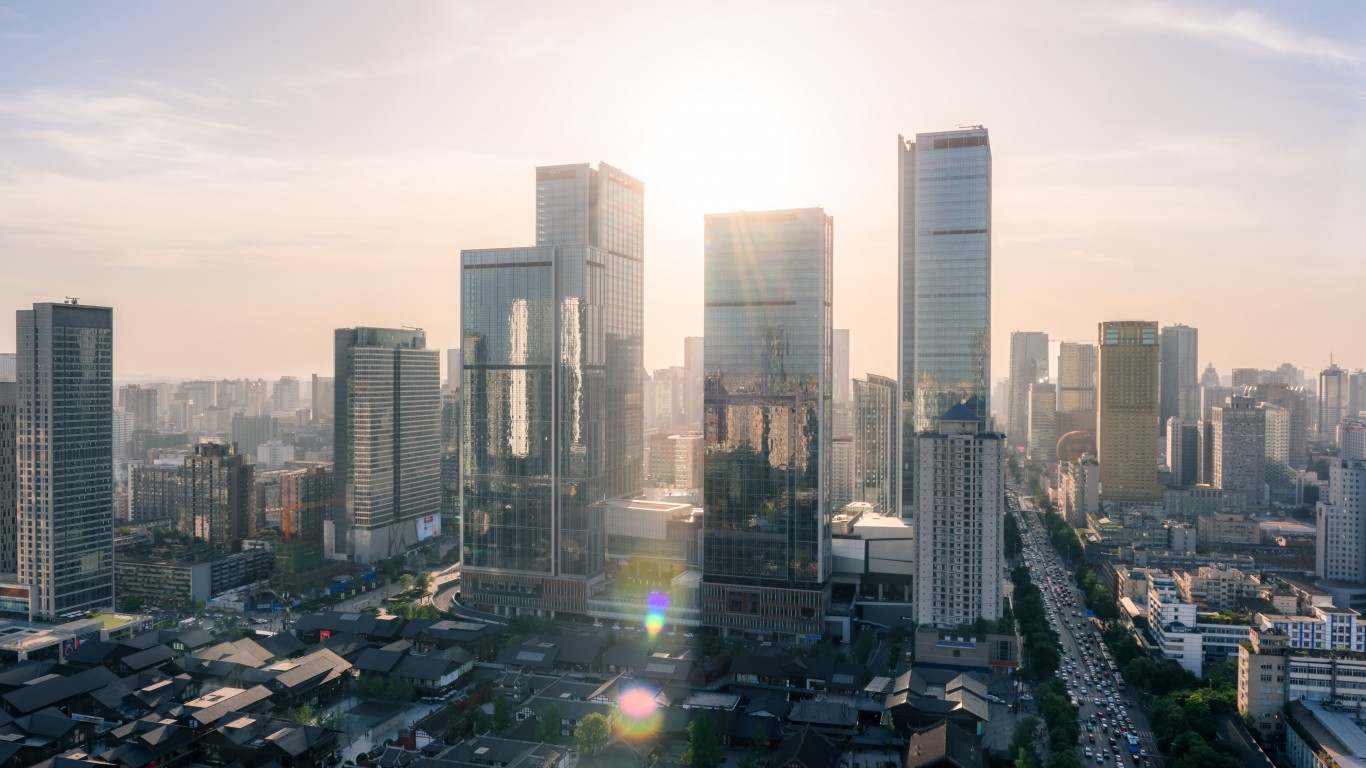
10. Chengdu, China
> Air quality ranking April 8, 2022: 145, 10 worst among 95 major cities
> Avg. annual PM2.5 concentration (μg/m³) in 2021: 40.3
> Worst month in 2021: January (75.5)
> Avg. annual PM2.5 concentration in 2020: 40.5
> Total population in 2022: 9,478,521
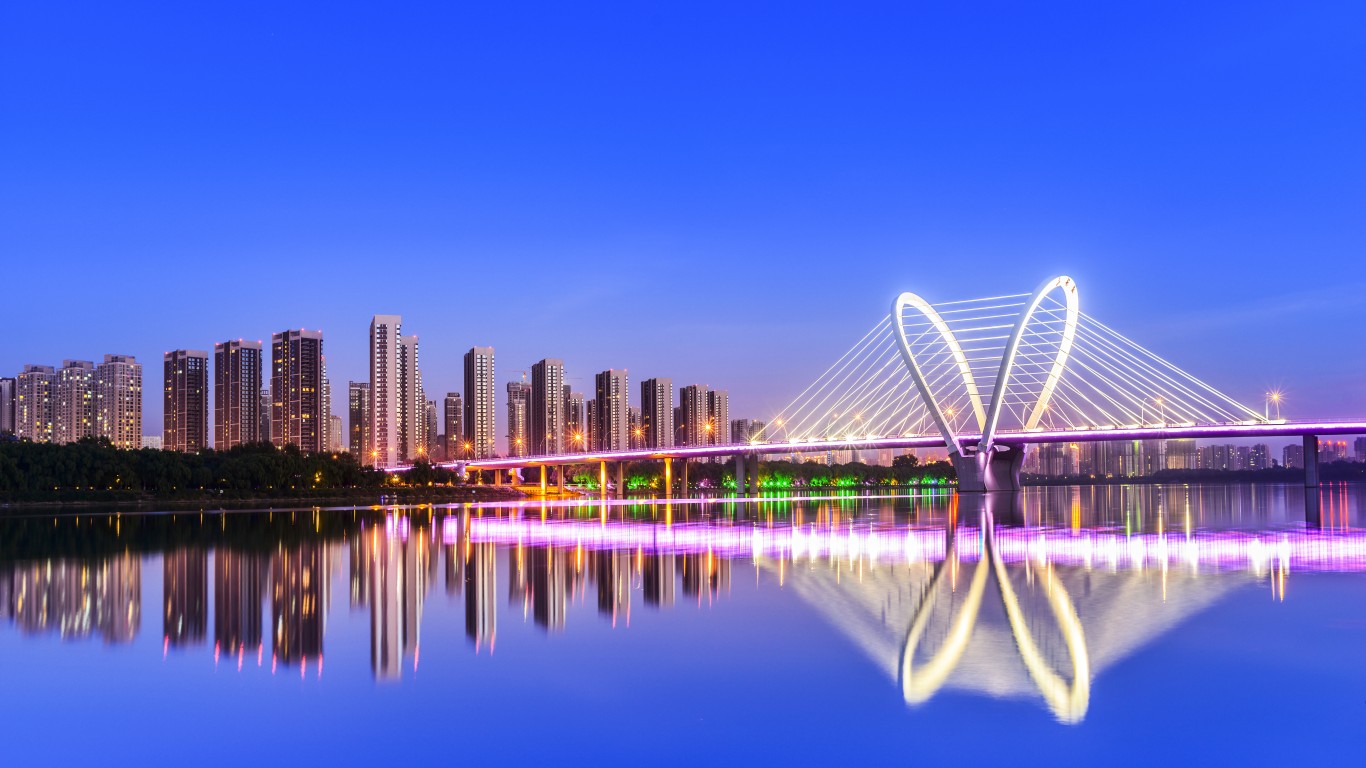
9. Shenyang, China
> Air quality ranking April 8, 2022: 145, 9 worst among 95 major cities
> Avg. annual PM2.5 concentration (μg/m³) in 2021: 37.0
> Worst month in 2021: March (67.6)
> Avg. annual PM2.5 concentration in 2020: 40.8
> Total population in 2022: 7,527,975
[in-text-ad-2]
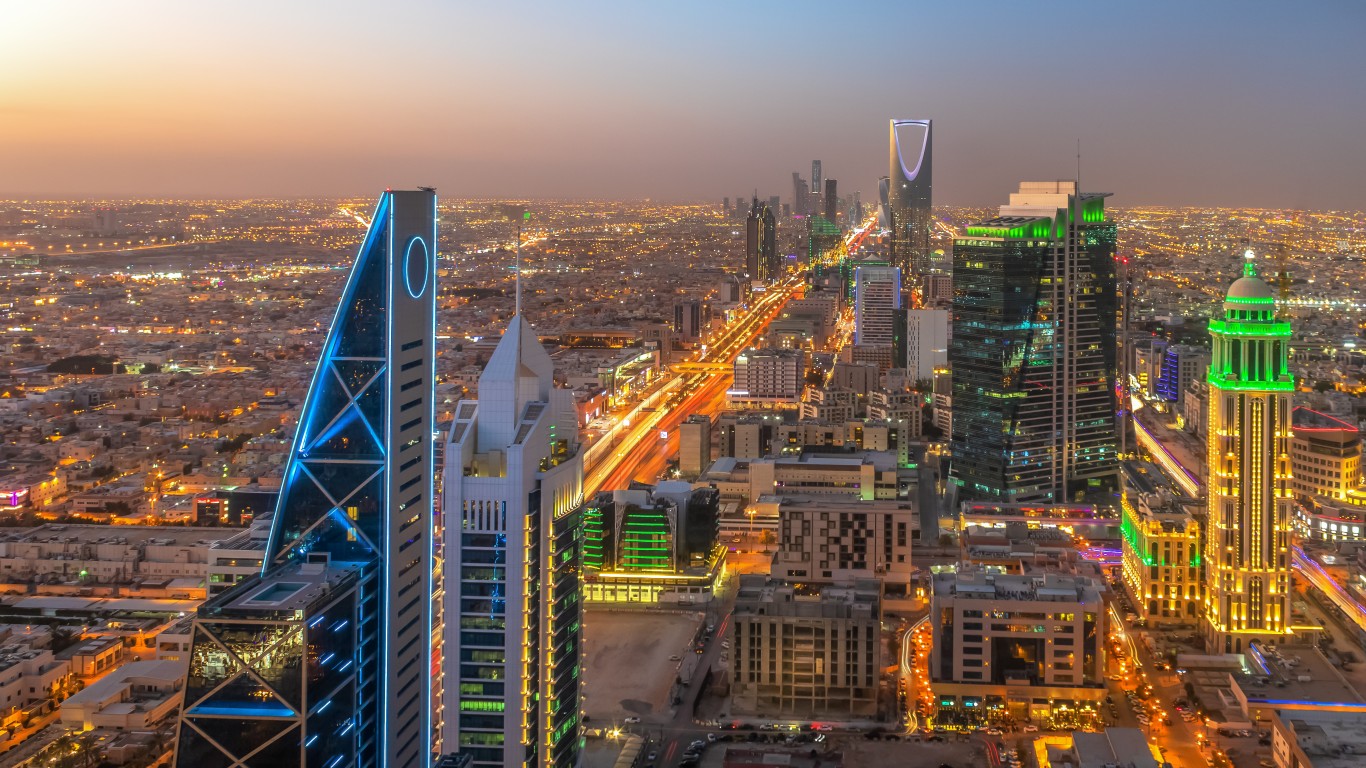
8. Riyadh, Saudi Arabia
> Air quality ranking April 8, 2022: 149, 8 worst among 95 major cities
> Avg. annual PM2.5 concentration (μg/m³) in 2021: 32.5
> Worst month in 2021: October (45.6)
> Avg. annual PM2.5 concentration in 2020: 23.3
> Total population in 2022: 7,538,200
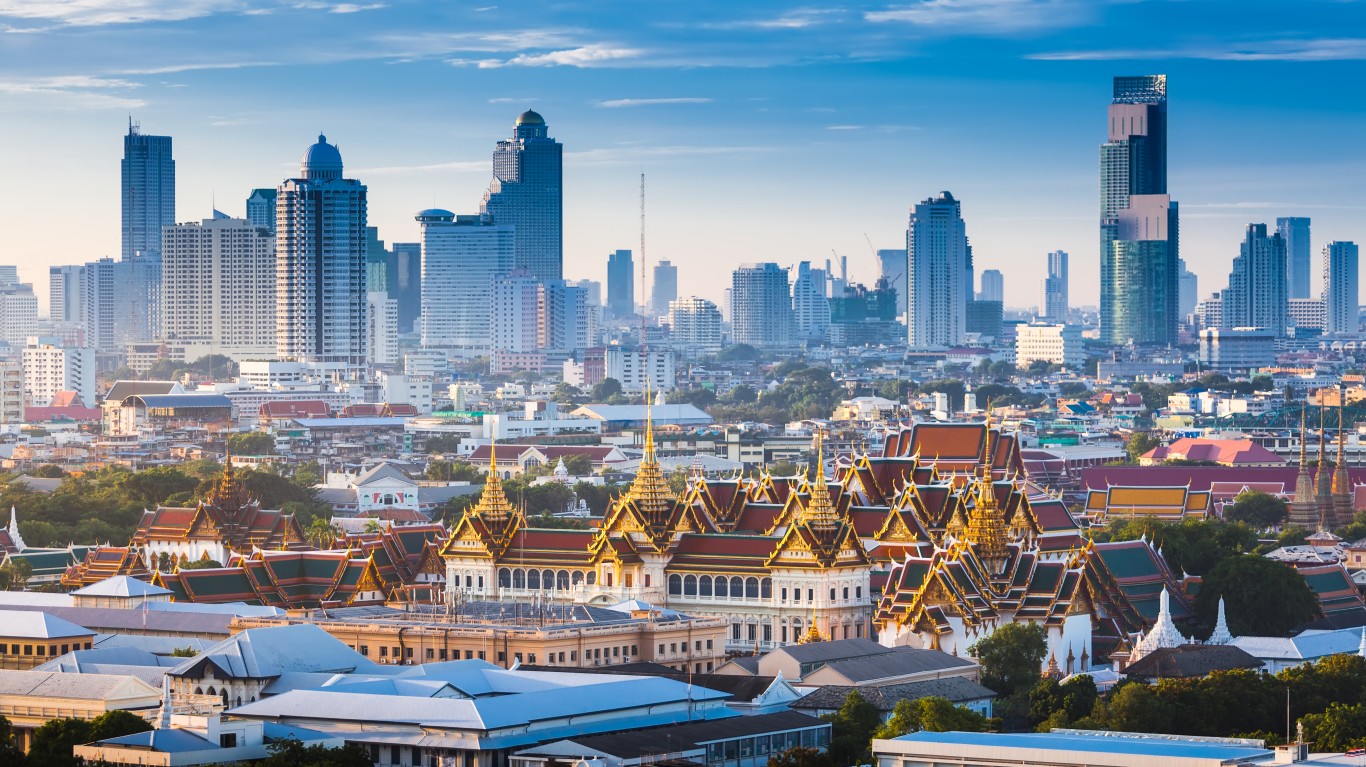
7. Bangkok, Thailand
> Air quality ranking April 8, 2022: 155, 7 worst among 95 major cities
> Avg. annual PM2.5 concentration (μg/m³) in 2021: 20.0
> Worst month in 2021: February (45.2)
> Avg. annual PM2.5 concentration in 2020: 20.6
> Total population in 2022: 10,899,698
[in-text-ad]
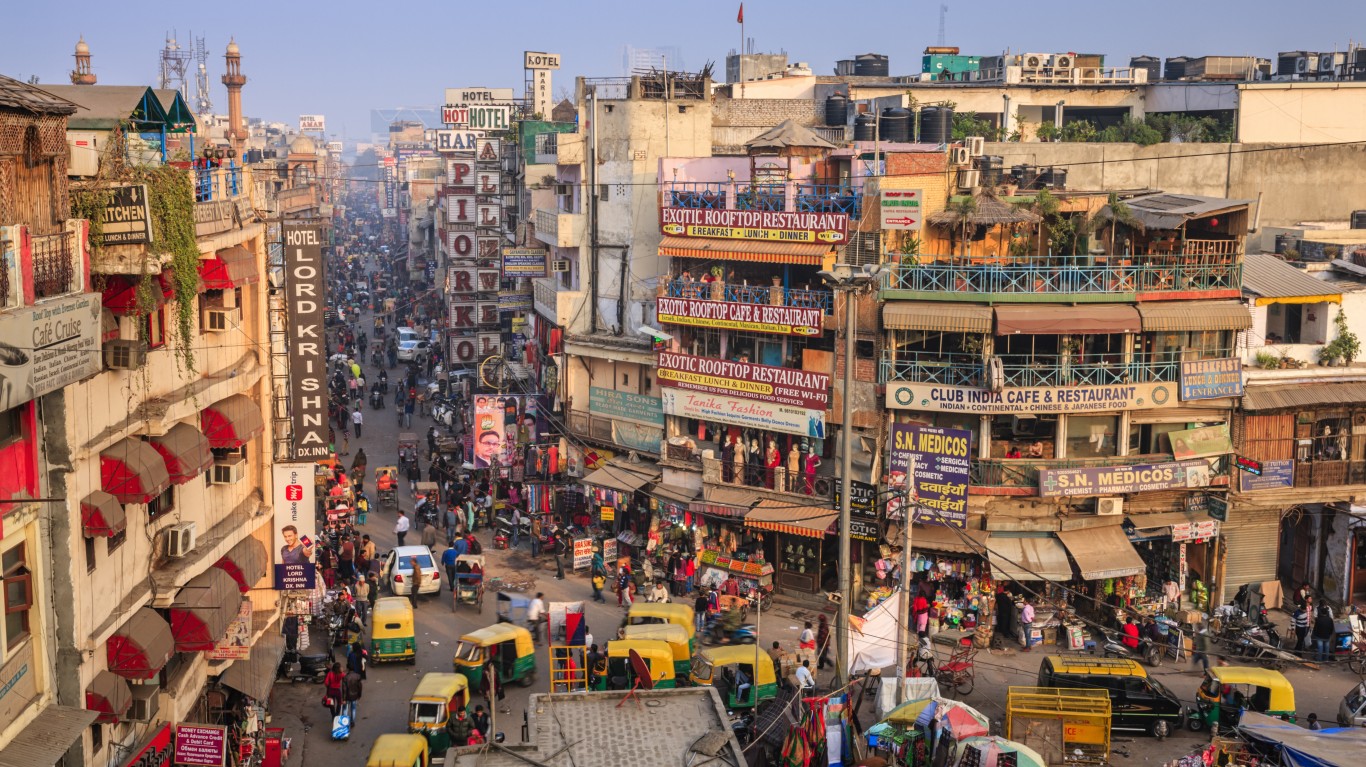
6. Delhi, India
> Air quality ranking April 8, 2022: 156, 6 worst among 95 major cities
> Avg. annual PM2.5 concentration (μg/m³) in 2021: 96.4
> Worst month in 2021: November (224.1)
> Avg. annual PM2.5 concentration in 2020: 84.1
> Total population in 2022: 32,065,760

5. Chiang Mai, Thailand
> Air quality ranking April 8, 2022: 163, 5 worst among 95 major cities
> Avg. annual PM2.5 concentration (μg/m³) in 2021: 24.9
> Worst month in 2021: March (83.2)
> Avg. annual PM2.5 concentration in 2020: 30.5
> Total population in 2022: 1,197,931

4. Hanoi, Vietnam
> Air quality ranking April 8, 2022: 171, 4 worst among 95 major cities
> Avg. annual PM2.5 concentration (μg/m³) in 2021: 36.2
> Worst month in 2021: December (74.7)
> Avg. annual PM2.5 concentration in 2020: 37.9
> Total population in 2022: 5,067,352
[in-text-ad-2]

3. Lahore, Pakistan
> Air quality ranking April 8, 2022: 173, 3 worst among 95 major cities
> Avg. annual PM2.5 concentration (μg/m³) in 2021: 86.5
> Worst month in 2021: December (212.1)
> Avg. annual PM2.5 concentration in 2020: 79.2
> Total population in 2022: 13,541,764

2. Beijing, China
> Air quality ranking April 8, 2022: 187, 2 worst among 95 major cities
> Avg. annual PM2.5 concentration (μg/m³) in 2021: 34.4
> Worst month in 2021: March (83.1)
> Avg. annual PM2.5 concentration in 2020: 37.5
> Total population in 2022: 21,333,332
[in-text-ad]
1. Tehran, Iran
> Air quality ranking April 8, 2022: 206, 1 worst among 95 major cities
> Avg. annual PM2.5 concentration (μg/m³) in 2021: 31.7
> Worst month in 2021: January (50.0)
> Avg. annual PM2.5 concentration in 2020: 29.0
> Total population in 2022: 9,381,546
Is Your Money Earning the Best Possible Rate? (Sponsor)
Let’s face it: If your money is just sitting in a checking account, you’re losing value every single day. With most checking accounts offering little to no interest, the cash you worked so hard to save is gradually being eroded by inflation.
However, by moving that money into a high-yield savings account, you can put your cash to work, growing steadily with little to no effort on your part. In just a few clicks, you can set up a high-yield savings account and start earning interest immediately.
There are plenty of reputable banks and online platforms that offer competitive rates, and many of them come with zero fees and no minimum balance requirements. Click here to see if you’re earning the best possible rate on your money!
Thank you for reading! Have some feedback for us?
Contact the 24/7 Wall St. editorial team.
 24/7 Wall St.
 24/7 Wall St.
 24/7 Wall St.