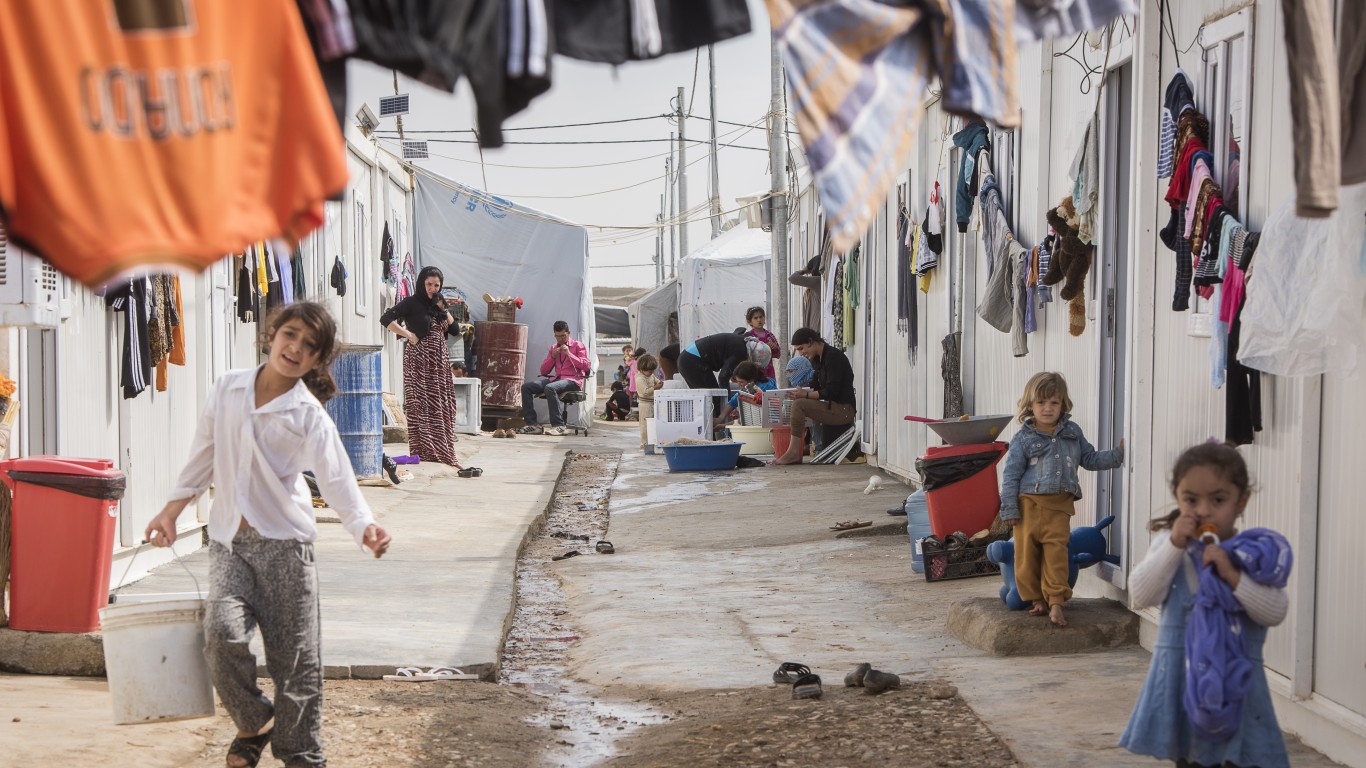
On March 17, 1980, President Jimmy Carter signed the United States Refugee Act of 1980 into law, establishing the nation’s contemporary refugee resettlement program and asylum system. The new law raised the refugee ceiling from 17,400 to 50,000 and established a review process for adjusting the ceiling to meet international emergencies. The new law broadened eligibility by setting the definition of a refugee as any person with a “well-founded fear of persecution.”
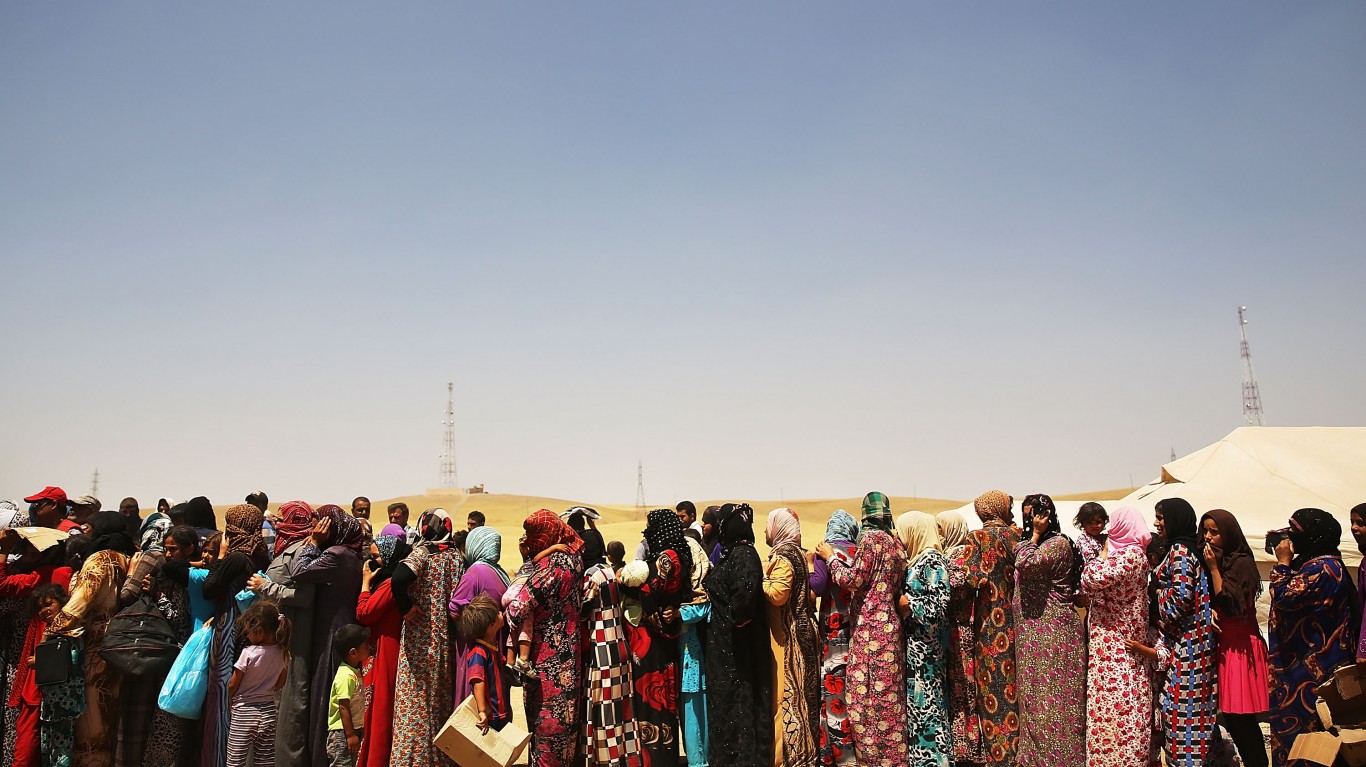
Since 1980, the U.S. has taken in over 3 million refugees – people fleeing violence, including genocide, war, or political, religious, or ethnic persecution. The Refugee Act was passed in part to address the ongoing refugee crisis precipitated by the end of the Vietnam war, when hundreds of thousands of people fled Vietnam, Cambodia, and Laos. In 1980 and the years immediately following, Vietnamese refugees made up a significant portion of refugees and immigrants entering the U.S. (Here is the number of legal immigrants to the U.S. every year since 1990.)
To determine the number of refugees the U.S. accepted each year since 1980, 24/7 Wall St. reviewed annual refugee arrivals from the Department of Homeland Security’s Yearbook of Immigration Statistics 2020 for fiscal years 1980 through 2020.
Over 207,000 refugees entered the U.S. in 1980 – more than in any other year since. By 1986, admissions had fallen to 62,146. Another peak hit in 1990, after the U.S. raised the quota for people fleeing the Soviet Union. That year, 122,066 refugees entered the country, many of them from the dissolving Soviet Union.
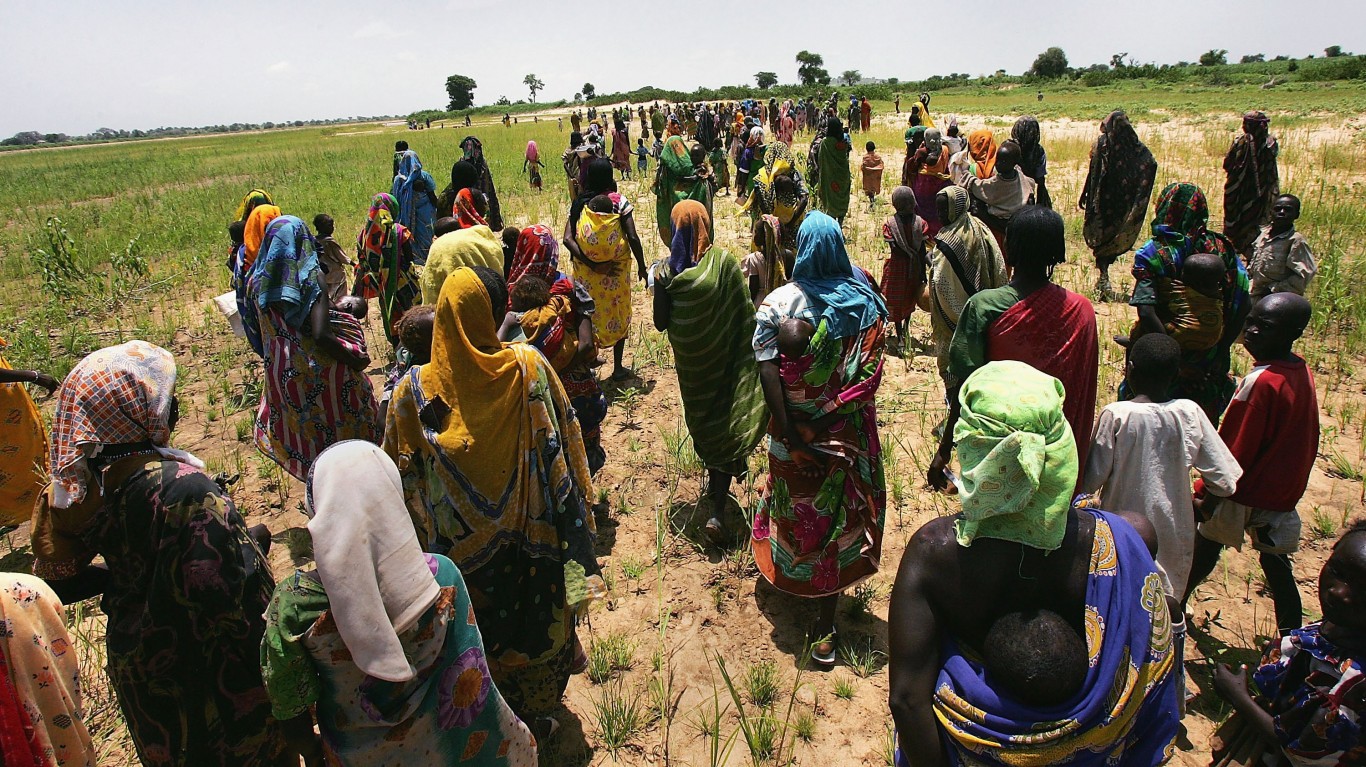
The number of refugees steeply declined after the Sept. 11, 2001 terrorist attacks, as the U.S largely suspended admissions with the Patriot Act. Fewer than 29,000 refugees were admitted each year in 2002 and 2003.
Admission peaked again in 2016 as the Obama administration raised the ceiling to 110,000 people and resettled over 12,000 refugees from both Syria and Burma, and over 16,000 from the Democratic Republic of the Congo. (Here are the countries most immigrants in the U.S. are originally from.)
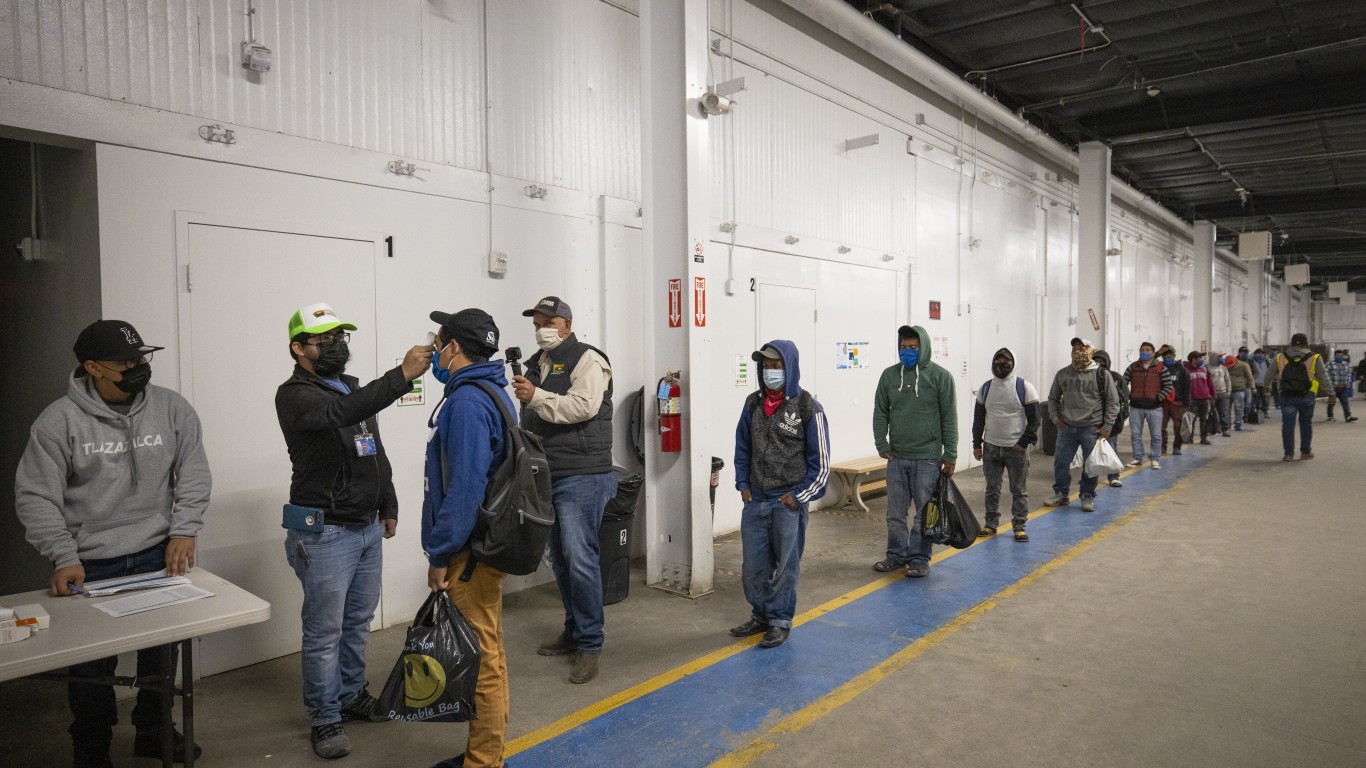
Record lows immediately followed when the Trump administration temporarily froze admissions in 2018 and then set the refugee ceiling at 18,000. Continuing the trend, there were only 11,840 admissions in 2020 – fewer than in any other year on the list, partly due to restrictions set in place to curb the worldwide coronavirus pandemic.
Click here to see how many refugees the US accepted each year since 1980
Click here to read our detailed methodology

1980
> Refugees:207,116
> US population: 227,225,000
[in-text-ad]
1981
> Refugees:159,252
> US population: 229,466,000

1982
> Refugees:98,096
> US population: 231,664,000

1983
> Refugees:61,218
> US population: 233,792,000
[in-text-ad-2]

1984
> Refugees:70,393
> US population: 235,825,000

1985
> Refugees:67,704
> US population: 237,924,000
[in-text-ad]

1986
> Refugees:62,146
> US population: 240,133,000

1987
> Refugees:64,528
> US population: 242,289,000

1988
> Refugees:76,483
> US population: 244,499,000
[in-text-ad-2]

1989
> Refugees:107,070
> US population: 246,819,000

1990
> Refugees:122,066
> US population: 249,623,000
[in-text-ad]

1991
> Refugees:113,389
> US population: 252,981,000
1992
> Refugees: 115,548
> US population: 256,514,000

1993
> Refugees: 114,181
> US population: 259,919,000
[in-text-ad-2]
1994
> Refugees: 111,680
> US population: 263,126,000

1995
> Refugees: 98,973
> US population: 266,278,000
[in-text-ad]
1996
> Refugees: 75,421
> US population: 269,394,000

1997
> Refugees: 69,653
> US population: 272,657,000

1998
> Refugees: 76,712
> US population: 275,854,000
[in-text-ad-2]

1999
> Refugees: 85,285
> US population: 279,040,000

2000
> Refugees:72,165
> US population: 282,162,411
[in-text-ad]

2001
> Refugees:68,920
> US population: 284,968,955

2002
> Refugees:26,785
> US population: 287,625,193

2003
> Refugees:28,286
> US population: 290,107,933
[in-text-ad-2]
2004
> Refugees:52,840
> US population: 292,805,298

2005
> Refugees:53,738
> US population: 295,516,599
[in-text-ad]

2006
> Refugees:41,094
> US population: 298,379,912

2007
> Refugees:48,218
> US population: 301,231,207

2008
> Refugees:60,107
> US population: 304,093,966
[in-text-ad-2]

2009
> Refugees:74,602
> US population: 306,771,529

2010
> Refugees:73,293
> US population: 309,327,143
[in-text-ad]
2011
> Refugees:56,384
> US population: 311,583,481

2012
> Refugees:58,179
> US population: 313,877,662
2013
> Refugees:69,909
> US population: 316,059,947
[in-text-ad-2]
2014
> Refugees:69,975
> US population: 318,386,329

2015
> Refugees:69,920
> US population: 320,738,994
[in-text-ad]

2016
> Refugees:84,989
> US population: 323,071,755

2017
> Refugees:53,691
> US population: 325,122,128

2018
> Refugees:22,405
> US population: 326,838,199
[in-text-ad-2]

2019
> Refugees:29,916
> US population: 328,329,953
2020
> Refugees:11,840
> US population: 329,484,123
Methodology
To determine the number of refugees the U.S. accepted each year since 1980, 24/7 Wall St. reviewed annual refugee arrivals from the Department of Homeland Security’s Yearbook of Immigration Statistics 2020 for fiscal years 1980 through 2020.
The DHS notes that the figures are based on refugee arrival date. Certain refugee applicants who arrived in FY 2020 are counted for that year and not towards the FY 2018 refugee admissions ceiling. The number of refugees excludes Amerasian immigrants except in fiscal years 1989 to 1991.
Refugee data in this report may differ slightly from numbers reported by the Department of State. DOS refugee numbers include Amerasians (children born in Cambodia, Korea, Laos, Thailand, or Vietnam after Dec. 31, 1950, and before Oct. 22, 1982, and fathered by a U.S. citizen), whereas DHS reports Amerasians as lawful permanent residents.
The Average American Is Losing Their Savings Every Day (Sponsor)
If you’re like many Americans and keep your money ‘safe’ in a checking or savings account, think again. The average yield on a savings account is a paltry .4% today, and inflation is much higher. Checking accounts are even worse.
Every day you don’t move to a high-yield savings account that beats inflation, you lose more and more value.
But there is good news. To win qualified customers, some accounts are paying 9-10x this national average. That’s an incredible way to keep your money safe, and get paid at the same time. Our top pick for high yield savings accounts includes other one time cash bonuses, and is FDIC insured.
Click here to see how much more you could be earning on your savings today. It takes just a few minutes and your money could be working for you.
Thank you for reading! Have some feedback for us?
Contact the 24/7 Wall St. editorial team.

 24/7 Wall St.


 24/7 Wall St.
 24/7 Wall St.