
Every 10 years, the US Census survey, the US logs each person’s personal income. More than just a number, personal income gives a snapshot of the nation’s living standard and quality of life. The 2020 Census reported that median personal income per capita from 2016 to 2020 was $35,384 in 2020 dollars. This represents a decline from the 2010 figure of $40,690 per capita.
Household income, which takes into account the earnings of all people age 15 or older living under the same roof, on the other hand, increased substantially. According to the Census, the figure from 2016 to 2020 was $64,994 in 2020 dollars. Real median household income was $49,445 in 2010. (See what income level is considered middle class in your state.)
But nationwide figures don’t factor in differences among the states. To identify the states with the highest personal income per capita, 24/7 Wall St. reviewed 2021 annual personal income statistics from the Bureau of Labor Statistics. Income per capita includes wages and salaries, Social Security and other government benefits, dividends and interest, profits from business ownership, and other sources. Poverty rate, the share of households earning $200,000 or more annually, and the share of population 25 and older with a bachelor’s degree or higher are five-year estimates from the US Census Bureau’s 2019 American Community Survey.
Massachusetts tops all states for personal income per capita at $83,815. But Northeastern states in total occupy four of the top five places on the list, with Connecticut at $82,888, New Jersey at $78,018, and New York at $77,672. Notably, these states also have high rates of people with college degrees and low poverty rates. (These are 16 states where incomes are rising fastest.)
Click here to see the states with the highest income per capita
At the other end of the scale, four of the five states with the lowest per capita personal income were in the South – Mississippi at $44,942 (the lowest), West Virginia at $47,170, Alabama at $50,065, and Kentucky at $51,238.

50. Mississippi
> Average personal income per capita, 2021: $44,952
> Households with income above $200,000: 3.4% (2nd lowest)
> Poverty rate: 19.6% (the highest)
> Adults with a bachelor’s degree or higher: 22.8% (2nd lowest)
[in-text-ad]

49. West Virginia
> Average personal income per capita, 2021: $47,170
> Households with income above $200,000: 3.1% (the lowest)
> Poverty rate: 17.1% (4th highest)
> Adults with a bachelor’s degree or higher: 21.3% (the lowest)

48. New Mexico
> Average personal income per capita, 2021: $49,764
> Households with income above $200,000: 4.1% (4th lowest)
> Poverty rate: 18.6% (3rd highest)
> Adults with a bachelor’s degree or higher: 28.1% (10th lowest)

47. Alabama
> Average personal income per capita, 2021: $50,065
> Households with income above $200,000: 4.4% (6th lowest)
> Poverty rate: 16% (7th highest)
> Adults with a bachelor’s degree or higher: 26.2% (8th lowest)
[in-text-ad-2]

46. Kentucky
> Average personal income per capita, 2021: $51,238
> Households with income above $200,000: 4.2% (5th lowest)
> Poverty rate: 16.6% (5th highest)
> Adults with a bachelor’s degree or higher: 25% (5th lowest)

45. Arkansas
> Average personal income per capita, 2021: $51,386
> Households with income above $200,000: 4% (3rd lowest)
> Poverty rate: 16.1% (6th highest)
> Adults with a bachelor’s degree or higher: 23.8% (3rd lowest)
[in-text-ad]
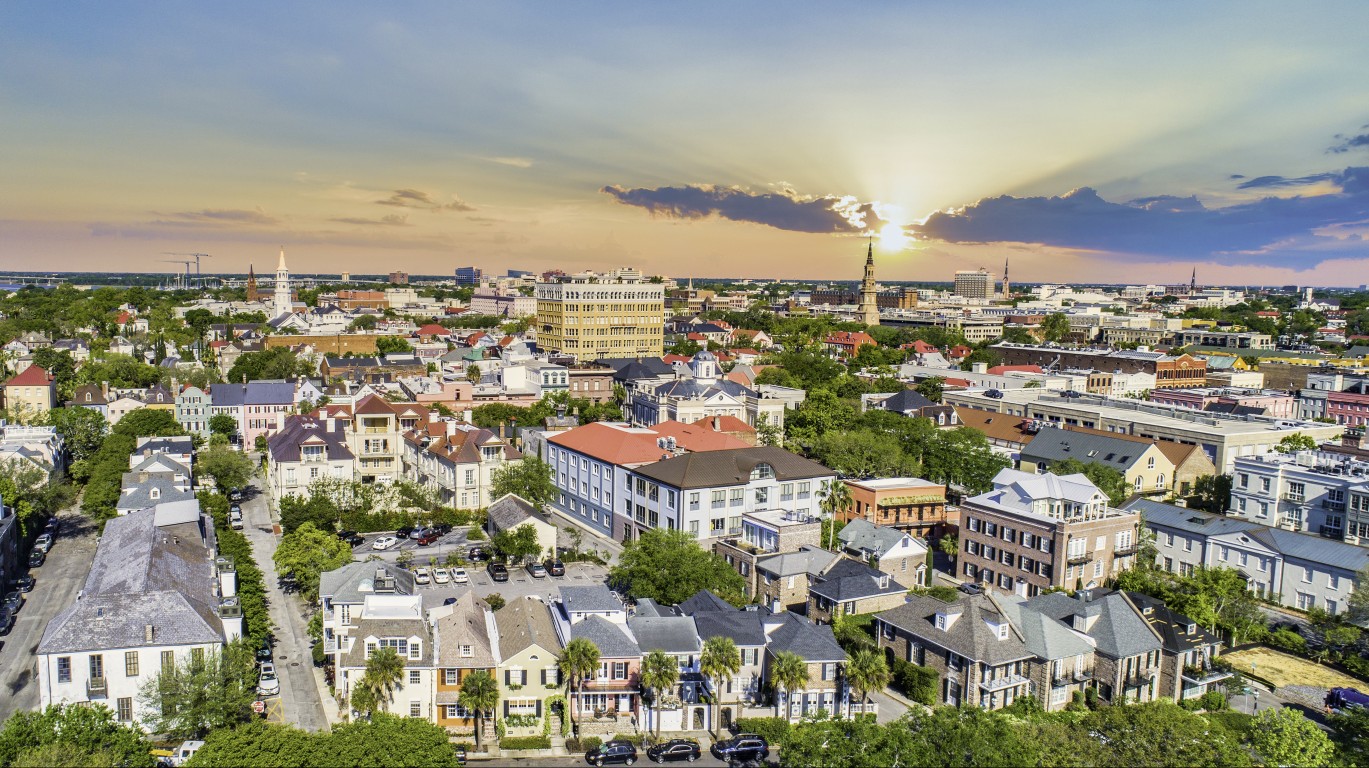
44. South Carolina
> Average personal income per capita, 2021: $53,088
> Households with income above $200,000: 5.1% (16th lowest)
> Poverty rate: 14.7% (9th highest)
> Adults with a bachelor’s degree or higher: 29% (15th lowest)

43. Oklahoma
> Average personal income per capita, 2021: $53,658
> Households with income above $200,000: 4.5% (8th lowest)
> Poverty rate: 15.3% (8th highest)
> Adults with a bachelor’s degree or higher: 26.1% (7th lowest)

42. Louisiana
> Average personal income per capita, 2021: $53,962
> Households with income above $200,000: 4.7% (11th lowest)
> Poverty rate: 18.6% (2nd highest)
> Adults with a bachelor’s degree or higher: 24.9% (4th lowest)
[in-text-ad-2]

41. Arizona
> Average personal income per capita, 2021: $55,075
> Households with income above $200,000: 6.4% (23rd highest)
> Poverty rate: 14.1% (13th highest)
> Adults with a bachelor’s degree or higher: 30.3% (21st lowest)
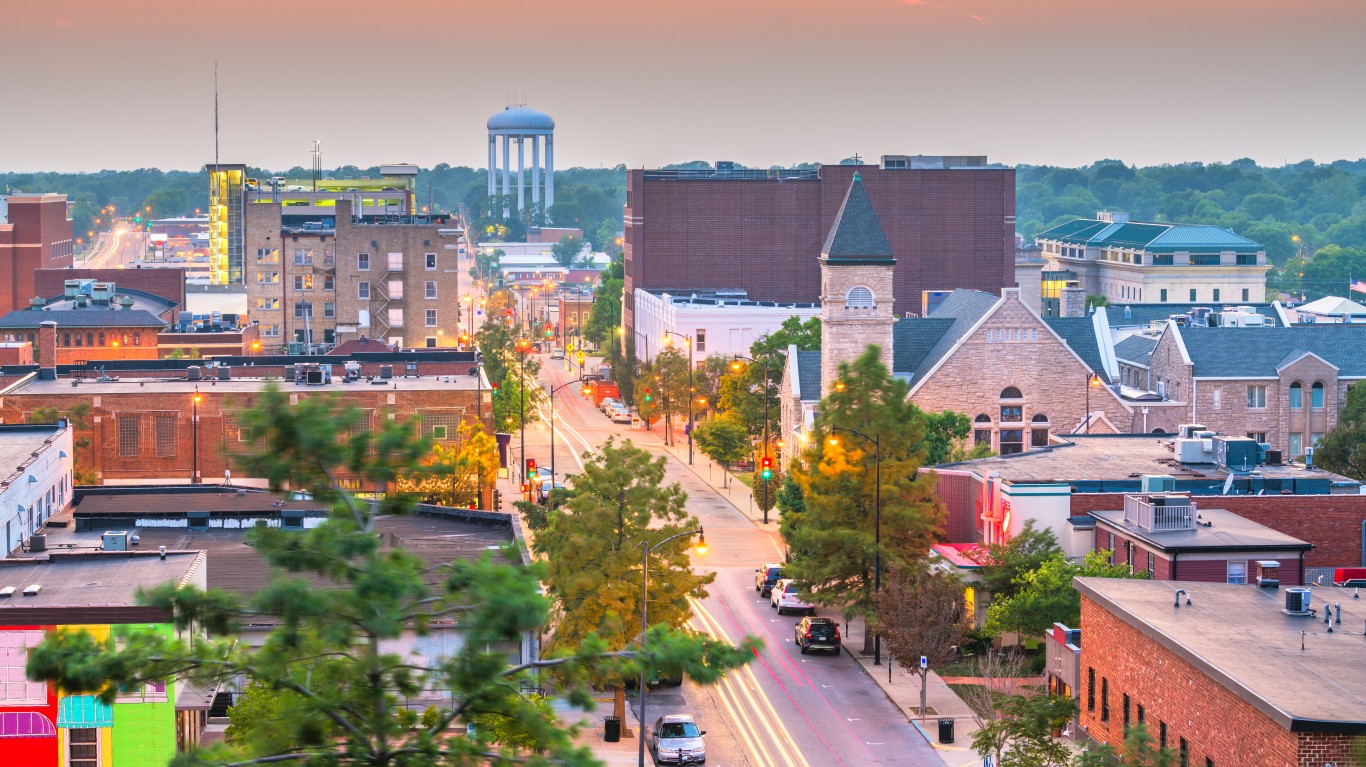
40. Missouri
> Average personal income per capita, 2021: $55,556
> Households with income above $200,000: 5.2% (18th lowest)
> Poverty rate: 13% (19th highest)
> Adults with a bachelor’s degree or higher: 29.9% (18th lowest)
[in-text-ad]
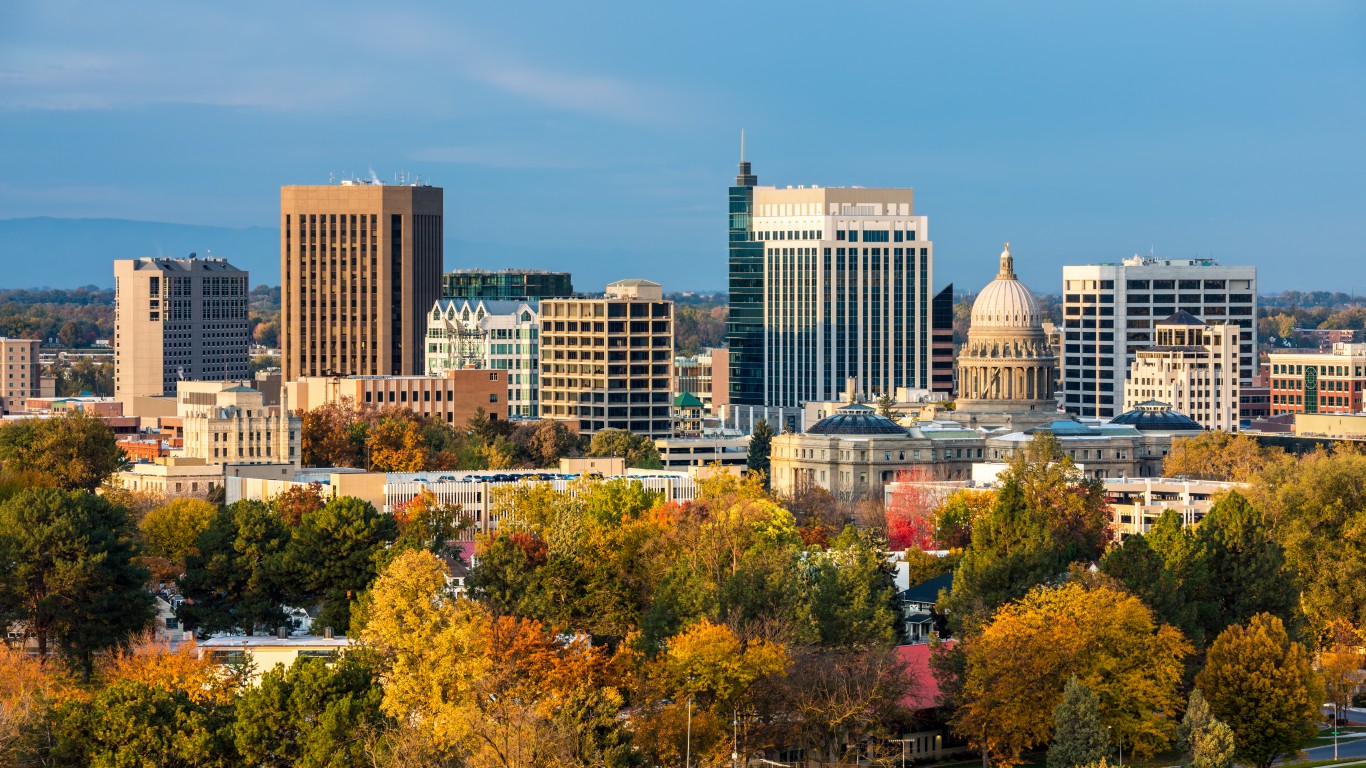
39. Idaho
> Average personal income per capita, 2021: $55,671
> Households with income above $200,000: 4.7% (12th lowest)
> Poverty rate: 11.9% (23rd lowest)
> Adults with a bachelor’s degree or higher: 28.7% (13th lowest)

38. North Carolina
> Average personal income per capita, 2021: $55,917
> Households with income above $200,000: 6% (25th lowest)
> Poverty rate: 14% (14th highest)
> Adults with a bachelor’s degree or higher: 32% (25th highest)
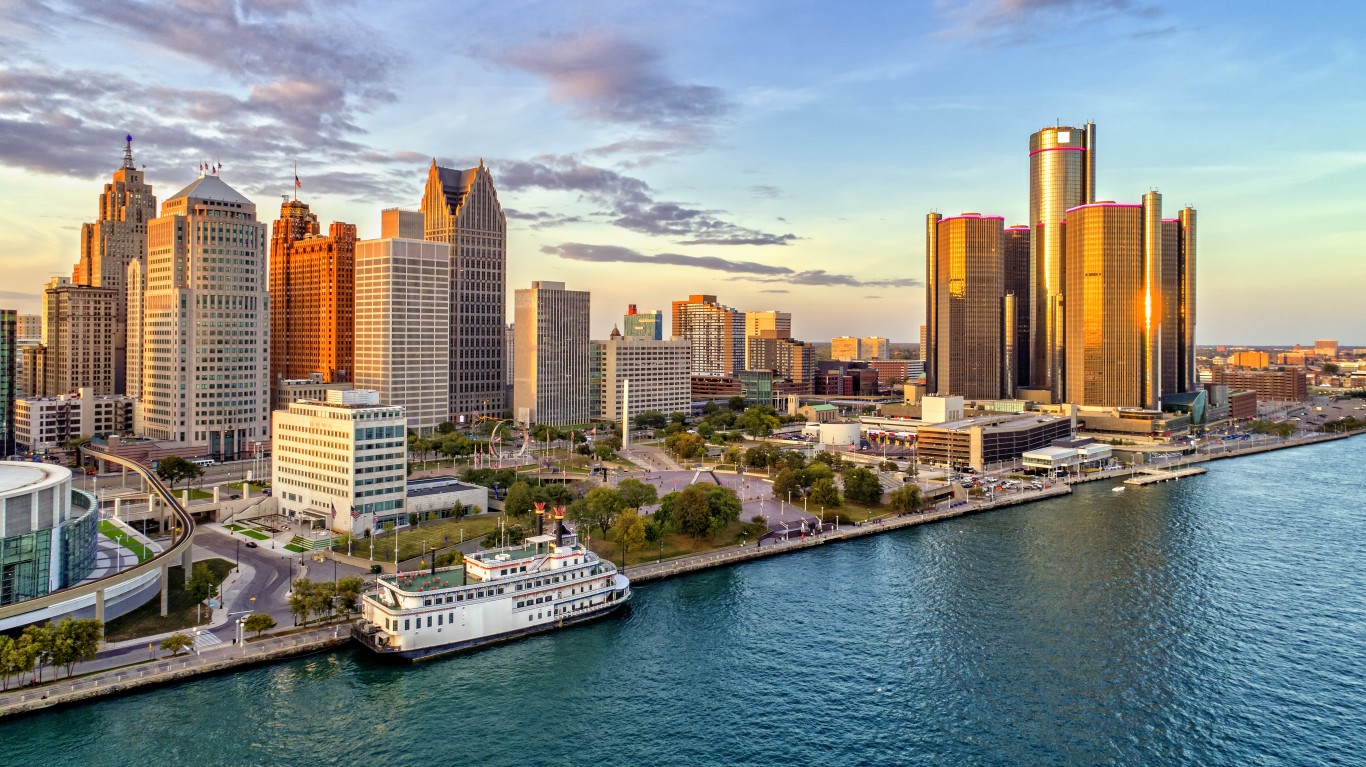
37. Michigan
> Average personal income per capita, 2021: $55,979
> Households with income above $200,000: 5.7% (23rd lowest)
> Poverty rate: 13.7% (15th highest)
> Adults with a bachelor’s degree or higher: 30% (19th lowest)
[in-text-ad-2]

36. Tennessee
> Average personal income per capita, 2021: $56,517
> Households with income above $200,000: 5.1% (17th lowest)
> Poverty rate: 14.6% (10th highest)
> Adults with a bachelor’s degree or higher: 28.2% (11th lowest)

35. Georgia
> Average personal income per capita, 2021: $56,777
> Households with income above $200,000: 7.1% (20th highest)
> Poverty rate: 14.3% (11th highest)
> Adults with a bachelor’s degree or higher: 32.2% (24th highest)
[in-text-ad]

34. Ohio
> Average personal income per capita, 2021: $56,990
> Households with income above $200,000: 5.2% (20th lowest)
> Poverty rate: 13.6% (16th highest)
> Adults with a bachelor’s degree or higher: 28.9% (14th lowest)

33. Indiana
> Average personal income per capita, 2021: $57,068
> Households with income above $200,000: 4.5% (9th lowest)
> Poverty rate: 12.9% (20th highest)
> Adults with a bachelor’s degree or higher: 27.2% (9th lowest)

32. Iowa
> Average personal income per capita, 2021: $57,752
> Households with income above $200,000: 5% (14th lowest)
> Poverty rate: 11.1% (19th lowest)
> Adults with a bachelor’s degree or higher: 29.3% (17th lowest)
[in-text-ad-2]

31. Maine
> Average personal income per capita, 2021: $58,499
> Households with income above $200,000: 4.9% (13th lowest)
> Poverty rate: 11.1% (18th lowest)
> Adults with a bachelor’s degree or higher: 32.5% (22nd highest)

30. Utah
> Average personal income per capita, 2021: $58,674
> Households with income above $200,000: 7% (21st highest)
> Poverty rate: 9.1% (3rd lowest)
> Adults with a bachelor’s degree or higher: 34.7% (15th highest)
[in-text-ad]

29. Montana
> Average personal income per capita, 2021: $58,944
> Households with income above $200,000: 4.7% (10th lowest)
> Poverty rate: 12.8% (22nd highest)
> Adults with a bachelor’s degree or higher: 33.1% (19th highest)
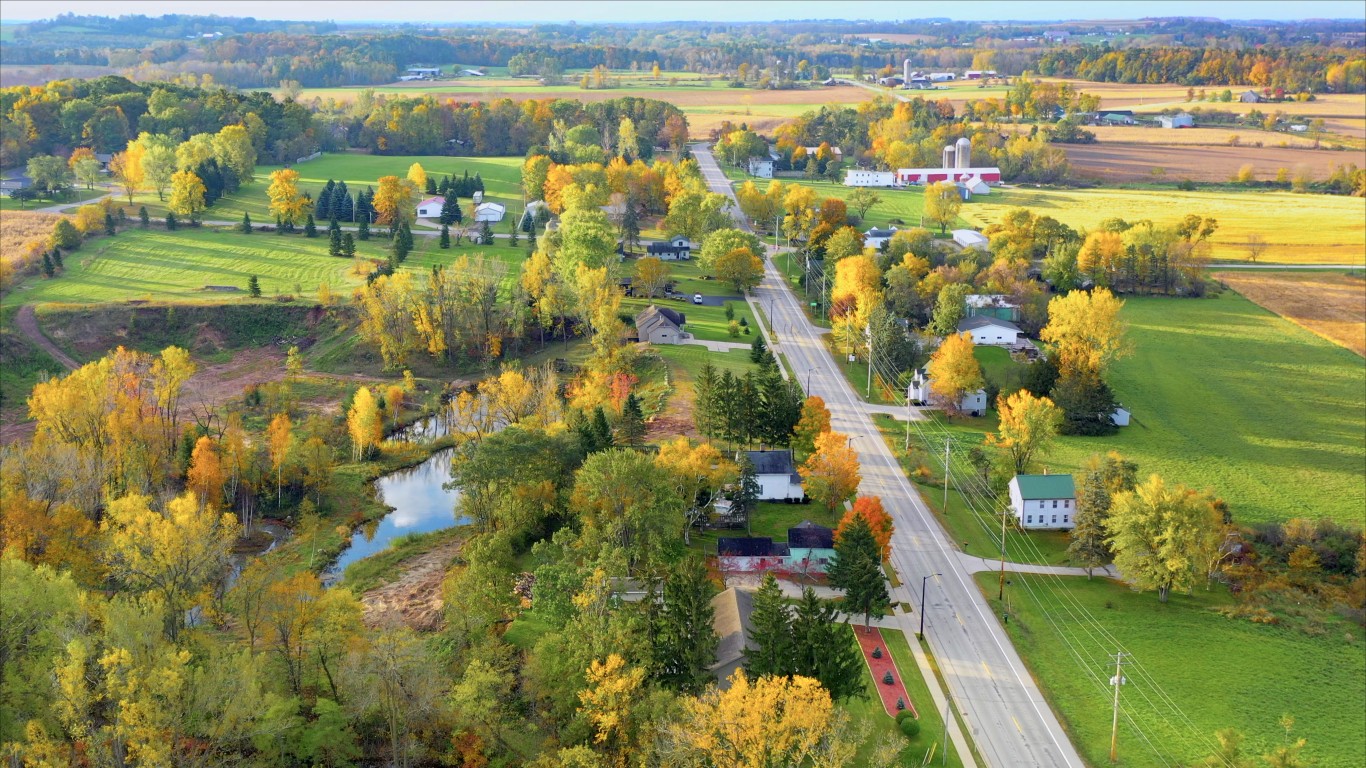
28. Wisconsin
> Average personal income per capita, 2021: $59,461
> Households with income above $200,000: 5.2% (21st lowest)
> Poverty rate: 11% (17th lowest)
> Adults with a bachelor’s degree or higher: 30.8% (25th lowest)
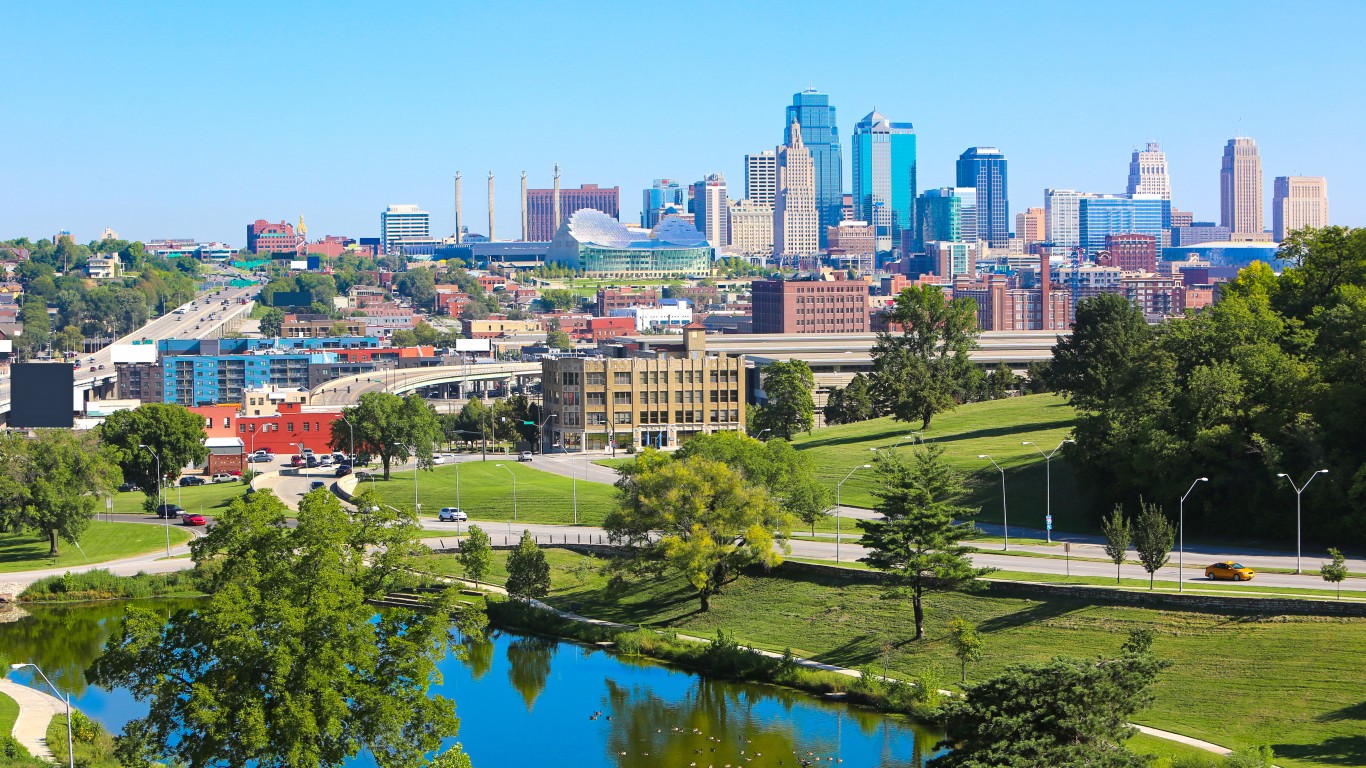
27. Kansas
> Average personal income per capita, 2021: $59,771
> Households with income above $200,000: 5.7% (22nd lowest)
> Poverty rate: 11.4% (21st lowest)
> Adults with a bachelor’s degree or higher: 33.9% (17th highest)
[in-text-ad-2]

26. Nevada
> Average personal income per capita, 2021: $60,418
> Households with income above $200,000: 5.9% (24th lowest)
> Poverty rate: 12.8% (23rd highest)
> Adults with a bachelor’s degree or higher: 25.5% (6th lowest)

25. Delaware
> Average personal income per capita, 2021: $61,179
> Households with income above $200,000: 7.6% (17th highest)
> Poverty rate: 11.4% (20th lowest)
> Adults with a bachelor’s degree or higher: 32.7% (20th highest)
[in-text-ad]

24. Hawaii
> Average personal income per capita, 2021: $61,302
> Households with income above $200,000: 11.3% (8th highest)
> Poverty rate: 9.3% (4th lowest)
> Adults with a bachelor’s degree or higher: 33.6% (18th highest)

23. Texas
> Average personal income per capita, 2021: $61,534
> Households with income above $200,000: 7.8% (15th highest)
> Poverty rate: 14.2% (12th highest)
> Adults with a bachelor’s degree or higher: 30.7% (24th lowest)

22. Oregon
> Average personal income per capita, 2021: $61,691
> Households with income above $200,000: 7.2% (18th highest)
> Poverty rate: 12.4% (25th highest)
> Adults with a bachelor’s degree or higher: 34.4% (16th highest)
[in-text-ad-2]
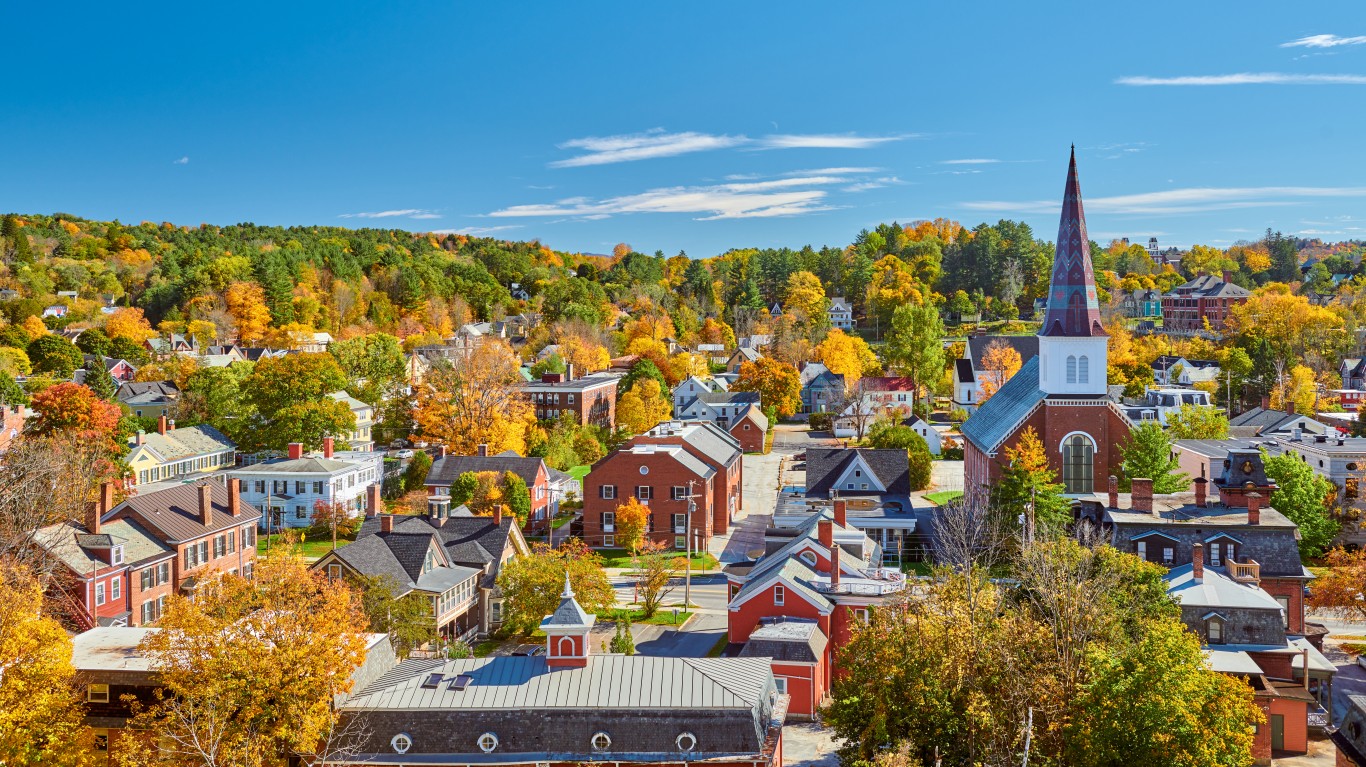
21. Vermont
> Average personal income per capita, 2021: $61,734
> Households with income above $200,000: 6% (24th highest)
> Poverty rate: 10.8% (16th lowest)
> Adults with a bachelor’s degree or higher: 39.7% (6th highest)

20. Florida
> Average personal income per capita, 2021: $62,376
> Households with income above $200,000: 6.4% (22nd highest)
> Poverty rate: 13.3% (18th highest)
> Adults with a bachelor’s degree or higher: 30.5% (22nd lowest)
[in-text-ad]

19. Nebraska
> Average personal income per capita, 2021: $63,381
> Households with income above $200,000: 5.2% (19th lowest)
> Poverty rate: 10.4% (13th lowest)
> Adults with a bachelor’s degree or higher: 32.5% (21st highest)

18. Rhode Island
> Average personal income per capita, 2021: $64,156
> Households with income above $200,000: 7.7% (16th highest)
> Poverty rate: 11.6% (22nd lowest)
> Adults with a bachelor’s degree or higher: 35% (13th highest)

17. Pennsylvania
> Average personal income per capita, 2021: $64,901
> Households with income above $200,000: 7.1% (19th highest)
> Poverty rate: 12% (24th lowest)
> Adults with a bachelor’s degree or higher: 32.3% (23rd highest)
[in-text-ad-2]
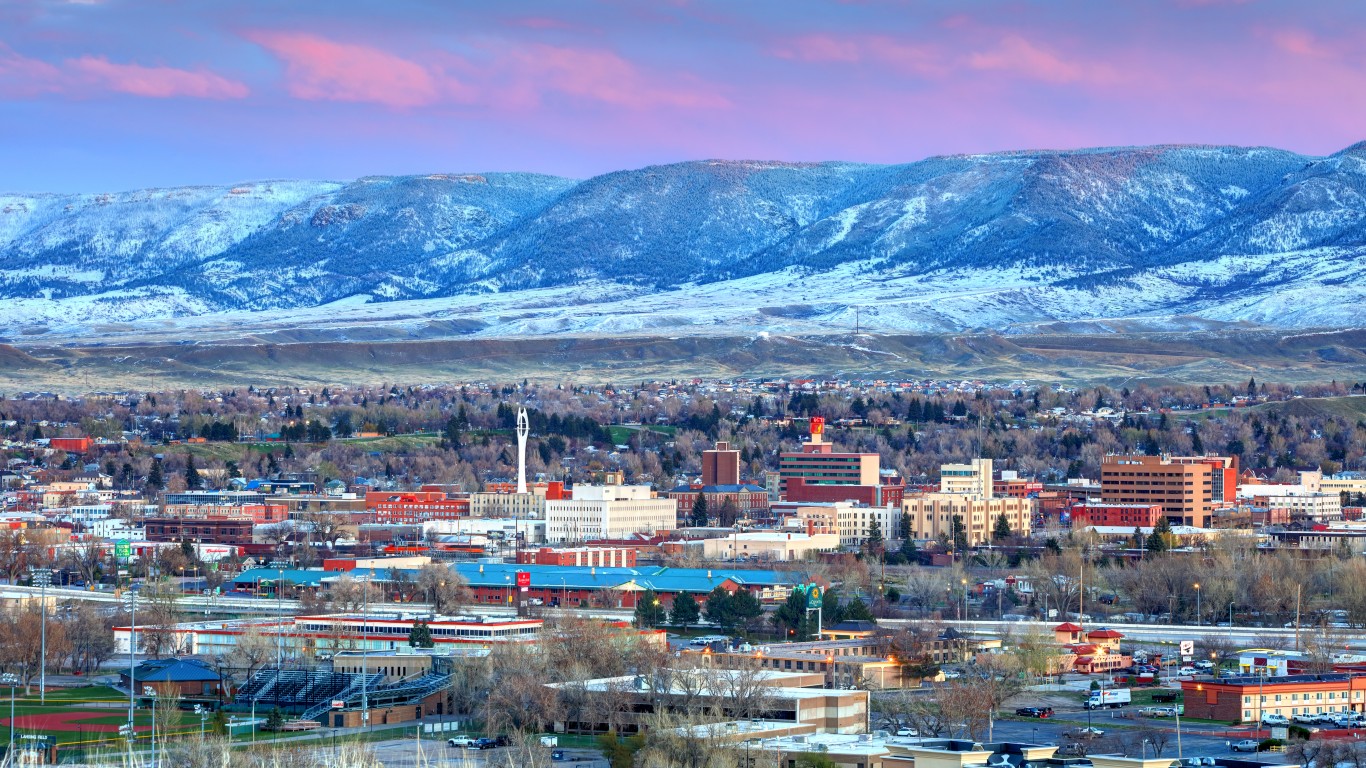
16. Wyoming
> Average personal income per capita, 2021: $65,340
> Households with income above $200,000: 5% (15th lowest)
> Poverty rate: 10.8% (15th lowest)
> Adults with a bachelor’s degree or higher: 28.2% (12th lowest)

15. South Dakota
> Average personal income per capita, 2021: $65,901
> Households with income above $200,000: 4.4% (7th lowest)
> Poverty rate: 12.8% (21st highest)
> Adults with a bachelor’s degree or higher: 29.3% (16th lowest)
[in-text-ad]

14. Virginia
> Average personal income per capita, 2021: $66,430
> Households with income above $200,000: 11.6% (6th highest)
> Poverty rate: 10% (10th lowest)
> Adults with a bachelor’s degree or higher: 39.5% (7th highest)

13. Minnesota
> Average personal income per capita, 2021: $66,740
> Households with income above $200,000: 8.5% (14th highest)
> Poverty rate: 9.3% (5th lowest)
> Adults with a bachelor’s degree or higher: 36.8% (10th highest)

12. Alaska
> Average personal income per capita, 2021: $66,745
> Households with income above $200,000: 8.8% (13th highest)
> Poverty rate: 10.3% (12th lowest)
> Adults with a bachelor’s degree or higher: 30% (20th lowest)
[in-text-ad-2]

11. North Dakota
> Average personal income per capita, 2021: $66,798
> Households with income above $200,000: 6% (25th highest)
> Poverty rate: 10.5% (14th lowest)
> Adults with a bachelor’s degree or higher: 30.7% (23rd lowest)

10. Illinois
> Average personal income per capita, 2021: $66,860
> Households with income above $200,000: 8.8% (12th highest)
> Poverty rate: 12% (25th lowest)
> Adults with a bachelor’s degree or higher: 35.5% (12th highest)
[in-text-ad]
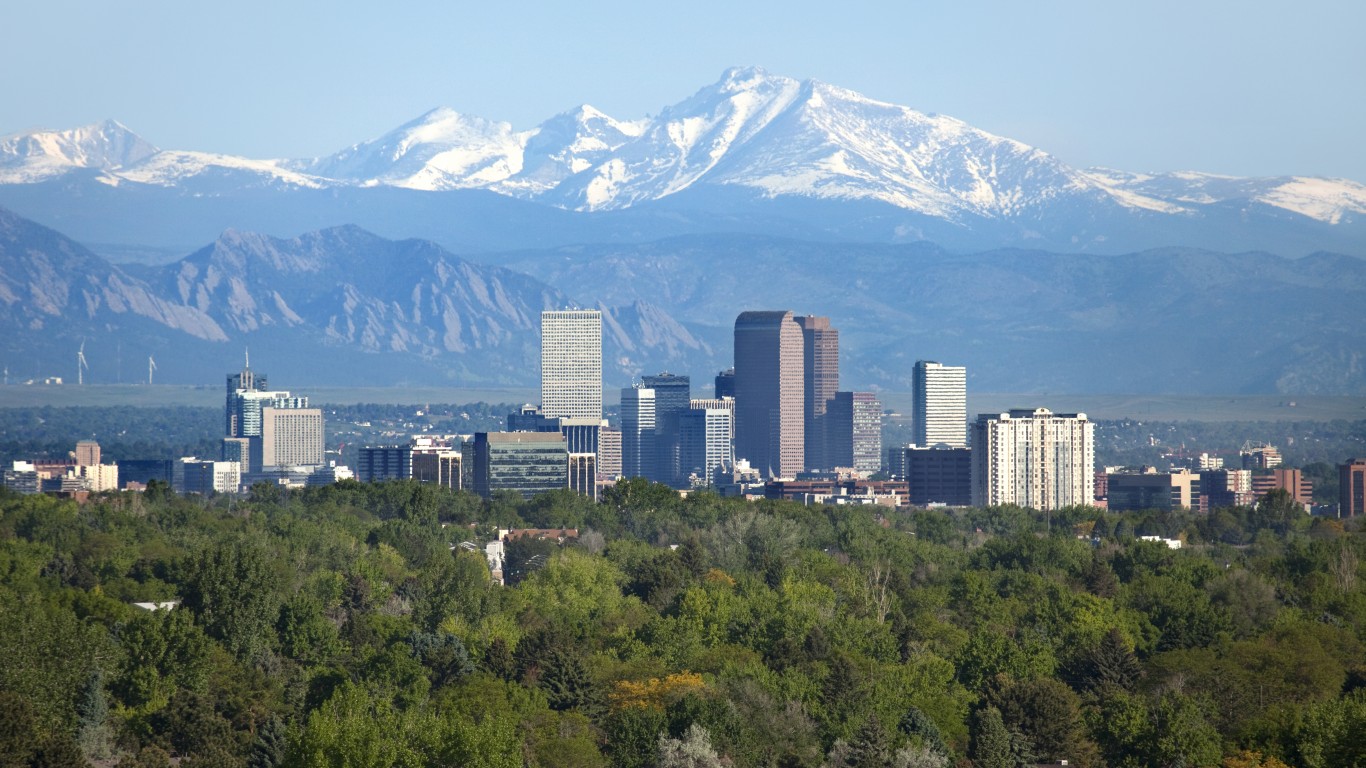
9. Colorado
> Average personal income per capita, 2021: $70,559
> Households with income above $200,000: 9.6% (11th highest)
> Poverty rate: 9.8% (7th lowest)
> Adults with a bachelor’s degree or higher: 41.6% (2nd highest)

8. Maryland
> Average personal income per capita, 2021: $70,729
> Households with income above $200,000: 13.4% (3rd highest)
> Poverty rate: 9% (2nd lowest)
> Adults with a bachelor’s degree or higher: 40.9% (3rd highest)

7. New Hampshire
> Average personal income per capita, 2021: $73,796
> Households with income above $200,000: 9.7% (10th highest)
> Poverty rate: 7.4% (the lowest)
> Adults with a bachelor’s degree or higher: 37.6% (8th highest)
[in-text-ad-2]

6. Washington
> Average personal income per capita, 2021: $74,054
> Households with income above $200,000: 10.5% (9th highest)
> Poverty rate: 10.2% (11th lowest)
> Adults with a bachelor’s degree or higher: 36.7% (11th highest)

5. California
> Average personal income per capita, 2021: $76,176
> Households with income above $200,000: 13.3% (4th highest)
> Poverty rate: 12.6% (24th highest)
> Adults with a bachelor’s degree or higher: 34.7% (14th highest)
[in-text-ad]

4. New York
> Average personal income per capita, 2021: $77,672
> Households with income above $200,000: 11.5% (7th highest)
> Poverty rate: 13.6% (17th highest)
> Adults with a bachelor’s degree or higher: 37.5% (9th highest)

3. New Jersey
> Average personal income per capita, 2021: $78,018
> Households with income above $200,000: 14.8% (the highest)
> Poverty rate: 9.7% (6th lowest)
> Adults with a bachelor’s degree or higher: 40.7% (4th highest)

2. Connecticut
> Average personal income per capita, 2021: $82,888
> Households with income above $200,000: 13.2% (5th highest)
> Poverty rate: 9.8% (8th lowest)
> Adults with a bachelor’s degree or higher: 40% (5th highest)
[in-text-ad-2]

1. Massachusetts
> Average personal income per capita, 2021: $83,815
> Households with income above $200,000: 14.3% (2nd highest)
> Poverty rate: 9.8% (9th lowest)
> Adults with a bachelor’s degree or higher: 44.5% (the highest)
Want to Retire Early? Start Here (Sponsor)
Want retirement to come a few years earlier than you’d planned? Or are you ready to retire now, but want an extra set of eyes on your finances?
Now you can speak with up to 3 financial experts in your area for FREE. By simply clicking here you can begin to match with financial professionals who can help you build your plan to retire early. And the best part? The first conversation with them is free.
Click here to match with up to 3 financial pros who would be excited to help you make financial decisions.
Have questions about retirement or personal finance? Email us at [email protected]!
By emailing your questions to 24/7 Wall St., you agree to have them published anonymously on a673b.bigscoots-temp.com.
By submitting your story, you understand and agree that we may use your story, or versions of it, in all media and platforms, including via third parties.
Thank you for reading! Have some feedback for us?
Contact the 24/7 Wall St. editorial team.
 24/7 Wall St.
 24/7 Wall St.
 24/7 Wall St.
