There was a time three decades ago when some of America’s cities were choked by smog. Clean air rules have helped improve that situation, but the effects have been limited. Recently, Los Angeles posted its smoggiest day in 30 years.
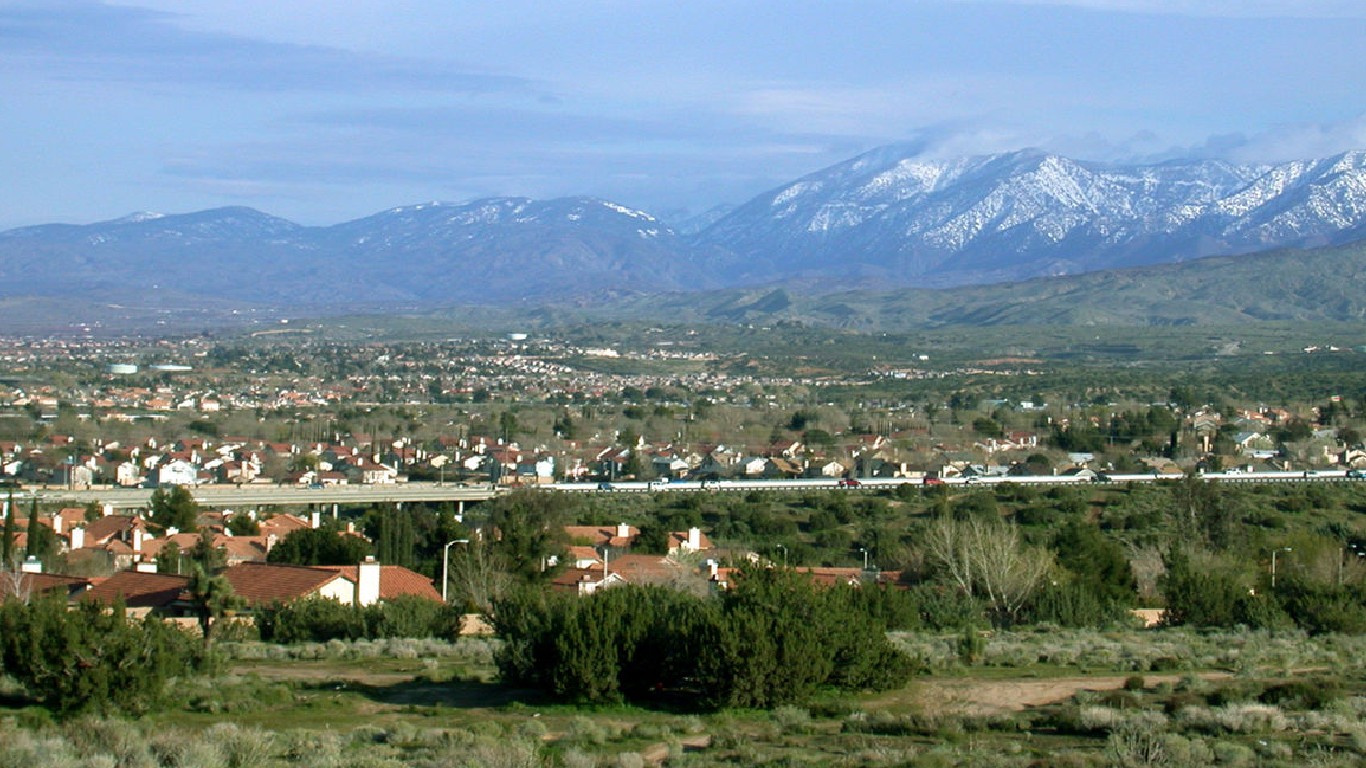
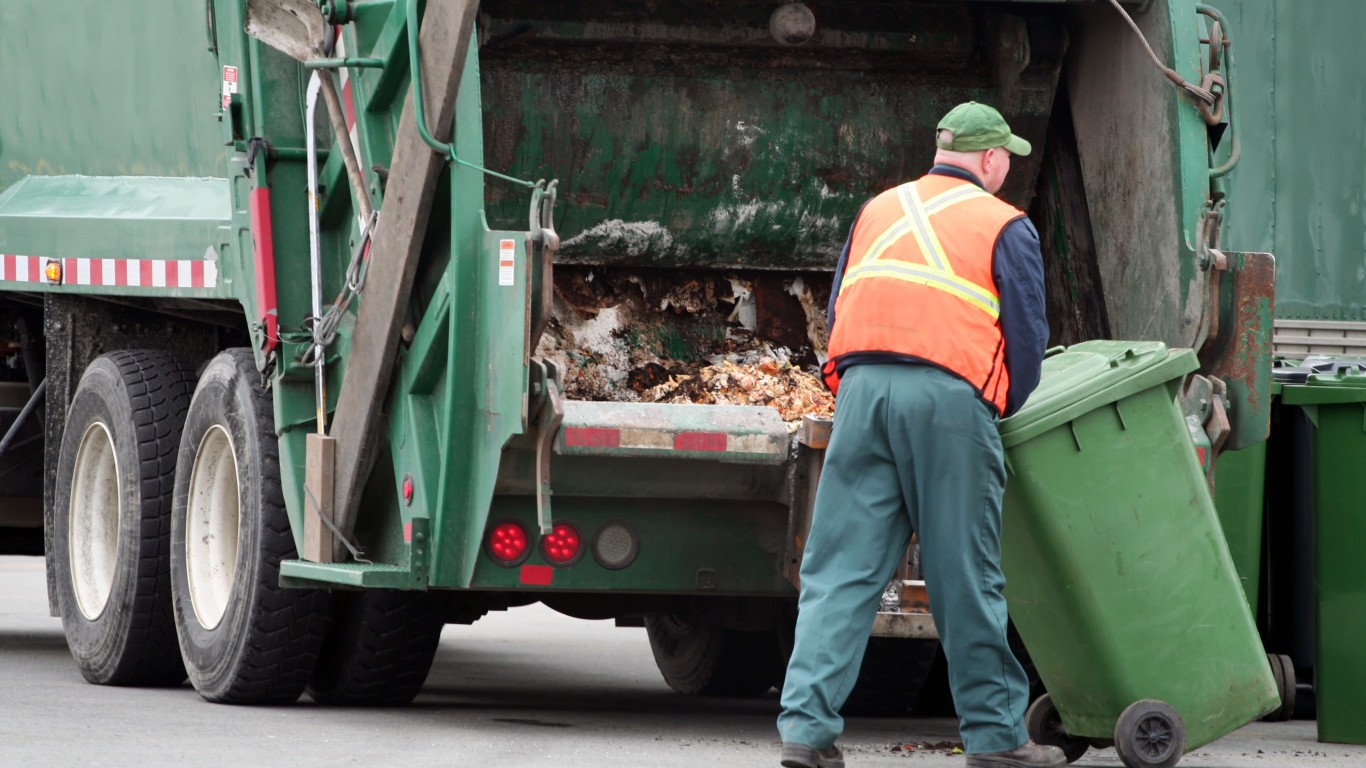
Air pollution isn’t the only measure of dirty cities, though. Other conditions include rats, which continue to infect New York City and more of America’s largest cities, despite years of attempts to exterminate them. Garbage is another problem. Occasionally, sanitation workers go on strike and there is no garbage pickup at all. Or a city might rank high on effective waste disposal but get low marks due to poor living conditions. When all factors are considered, America’s dirtiest city is Palmdale, California.
Click here to see America’s 50 dirtiest cities
To identify the dirtiest American cities, 24/7 Tempo reviewed a ranking created by LawnStarter, a lawn care startup that frequently conducts research into city and state amenities. The site compared the country’s 200 largest cities across 20 key metrics, encompassing indicators of pollution, living conditions, resident satisfaction with city cleanliness, and infrastructure factors to assign each city an overall score. (Take note of the worst city to live in every state.)
To that score, 24/7 Tempo added each municipality’s average daily PM2.5 (the concentration of particulate matter with a diameter of less than 2.5 micrometers) per cubic meter of air for each city’s county, drawn from the County Health Rankings and Roadmaps, a collaboration between the University of Wisconsin Population Health Institute and the Robert Woods Johnson Foundation. Population figures are from the U.S. Census Bureau’s 2019 American Community Survey five-year estimates. (See how the population of every state has changed since 1880.)
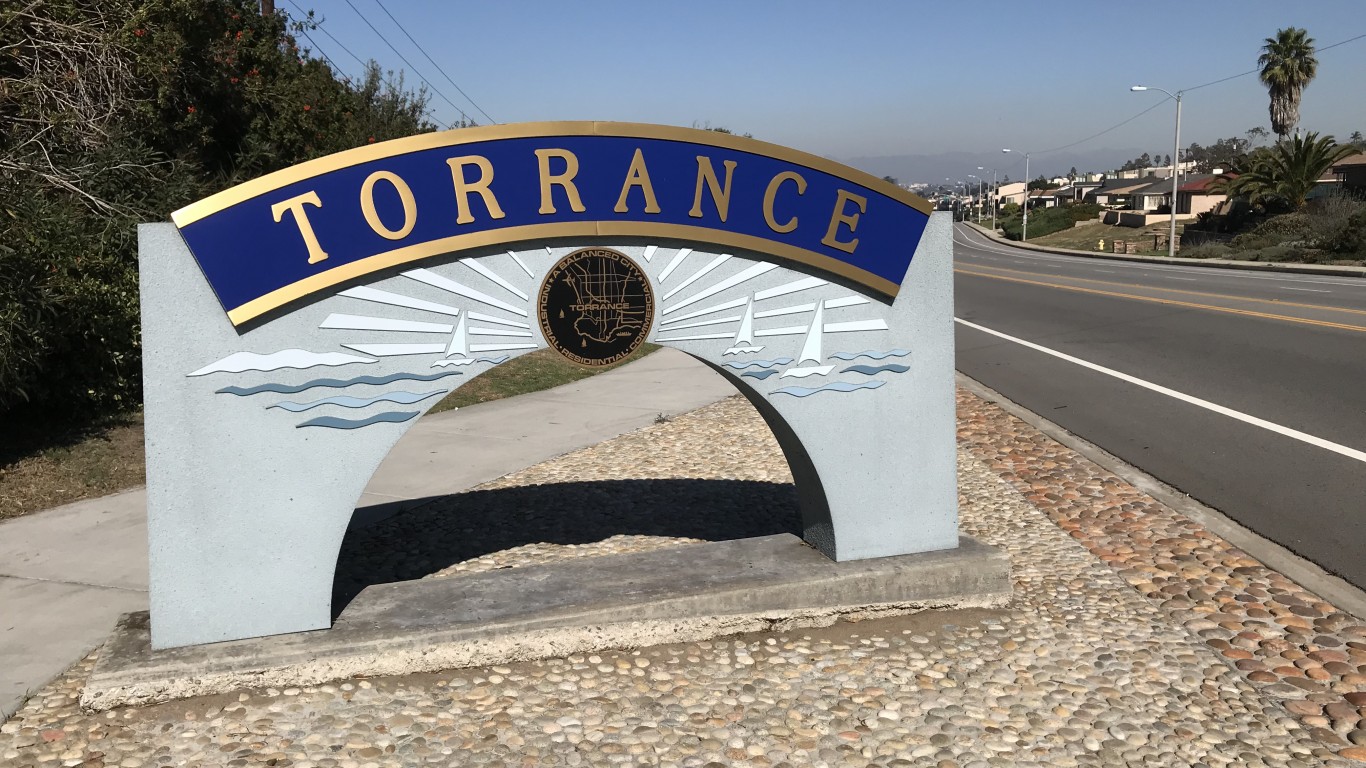
50. Torrance, California
> LawnStarter score: 36.5
> Resident satisfaction with city cleanliness: #156 worst out of 200 cities
> Avg daily PM2.5 (county): 12 micrograms per cubic meter
> Population: 145,492
[in-text-ad]
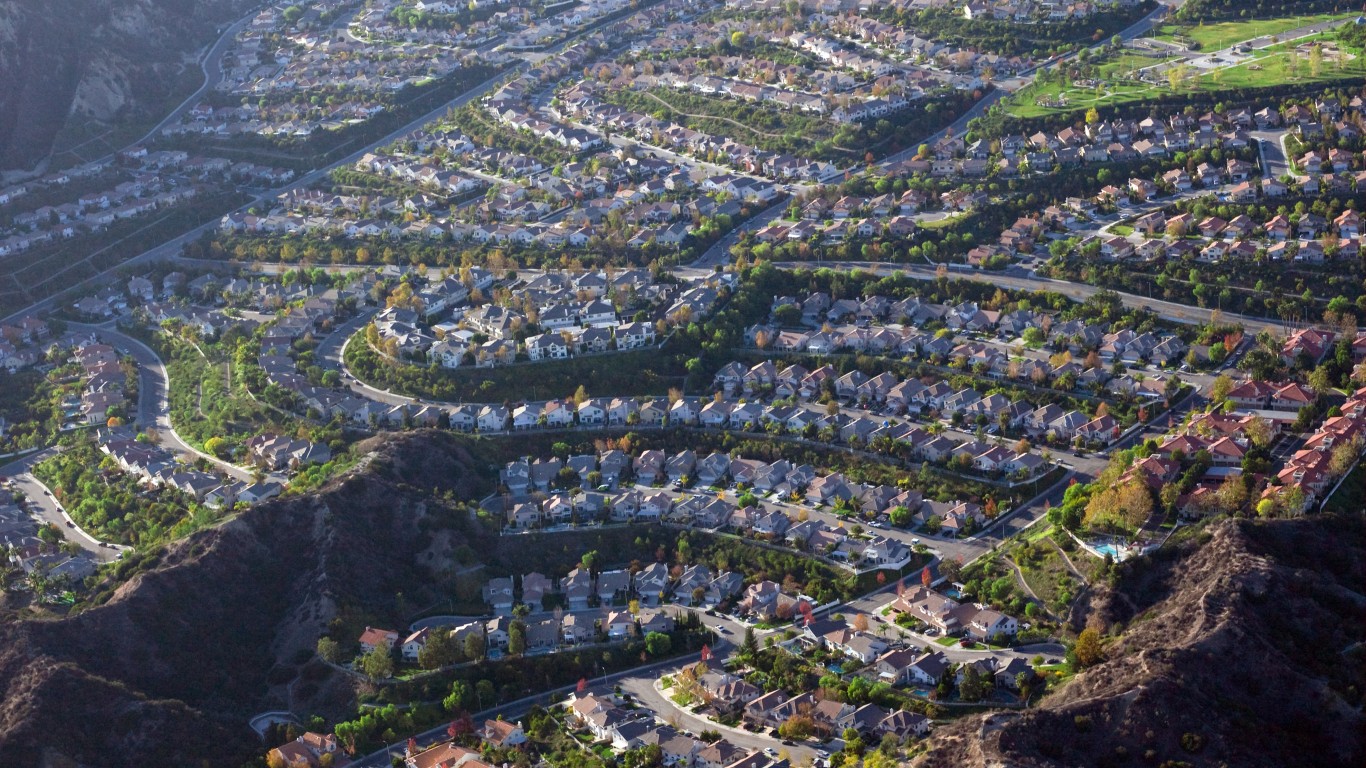
49. Lancaster, California
> LawnStarter score: 36.6 (tie)
> Resident satisfaction with city cleanliness: #156 worst out of 200 cities
> Avg daily PM2.5 (county): 12 micrograms per cubic meter
> Population: 159,028

48. Arlington, Texas
> LawnStarter score: 36.6 (tie)
> Resident satisfaction with city cleanliness: #91 worst out of 200 cities
> Avg daily PM2.5 (county): 8.8 micrograms per cubic meter
> Population: 395,477
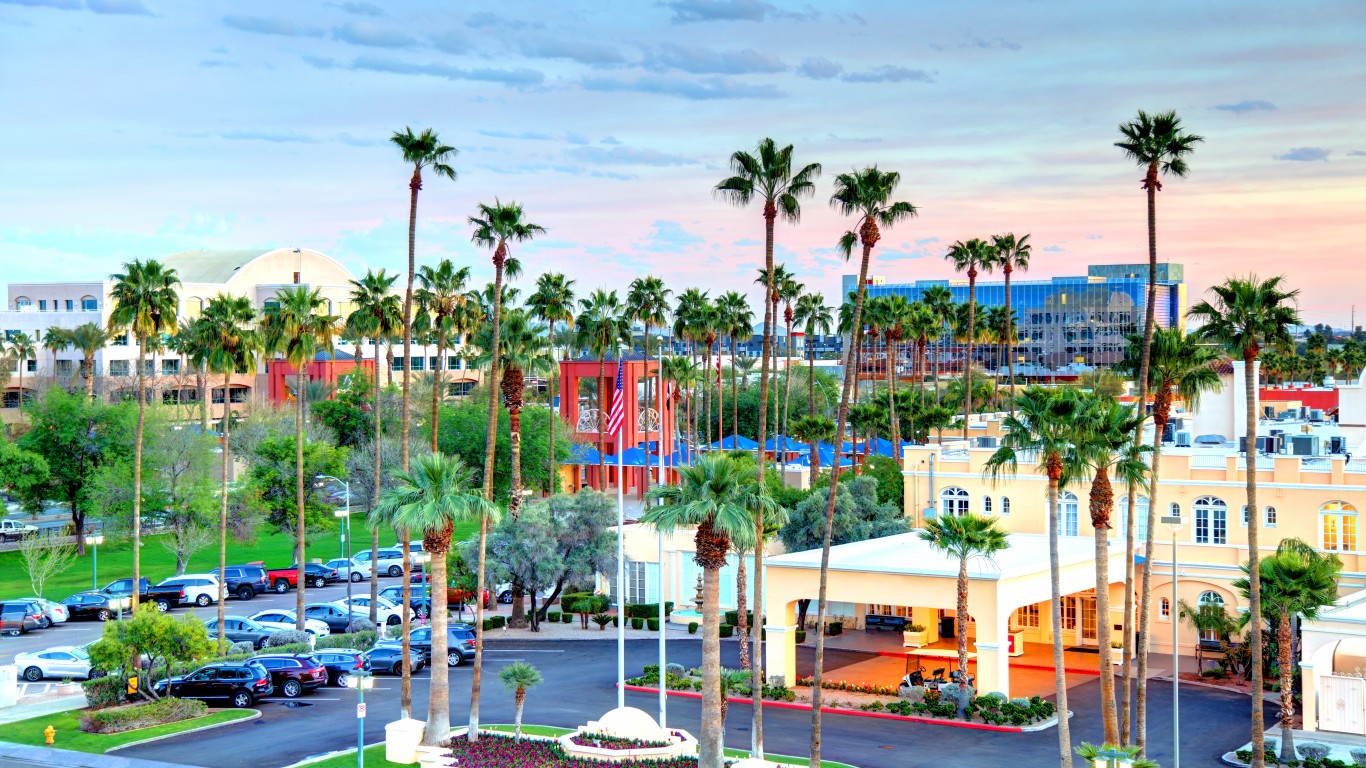
47. Chandler, Arizona
> LawnStarter score: 36.7
> Resident satisfaction with city cleanliness: #142 worst out of 200 cities
> Avg daily PM2.5 (county): 9.5 micrograms per cubic meter
> Population: 252,692
[in-text-ad-2]

46. Newport News, Virginia
> LawnStarter score: 37.3 (tie)
> Resident satisfaction with city cleanliness: #4 worst out of 200 cities
> Avg daily PM2.5 (county): 7.8 micrograms per cubic meter
> Population: 179,673
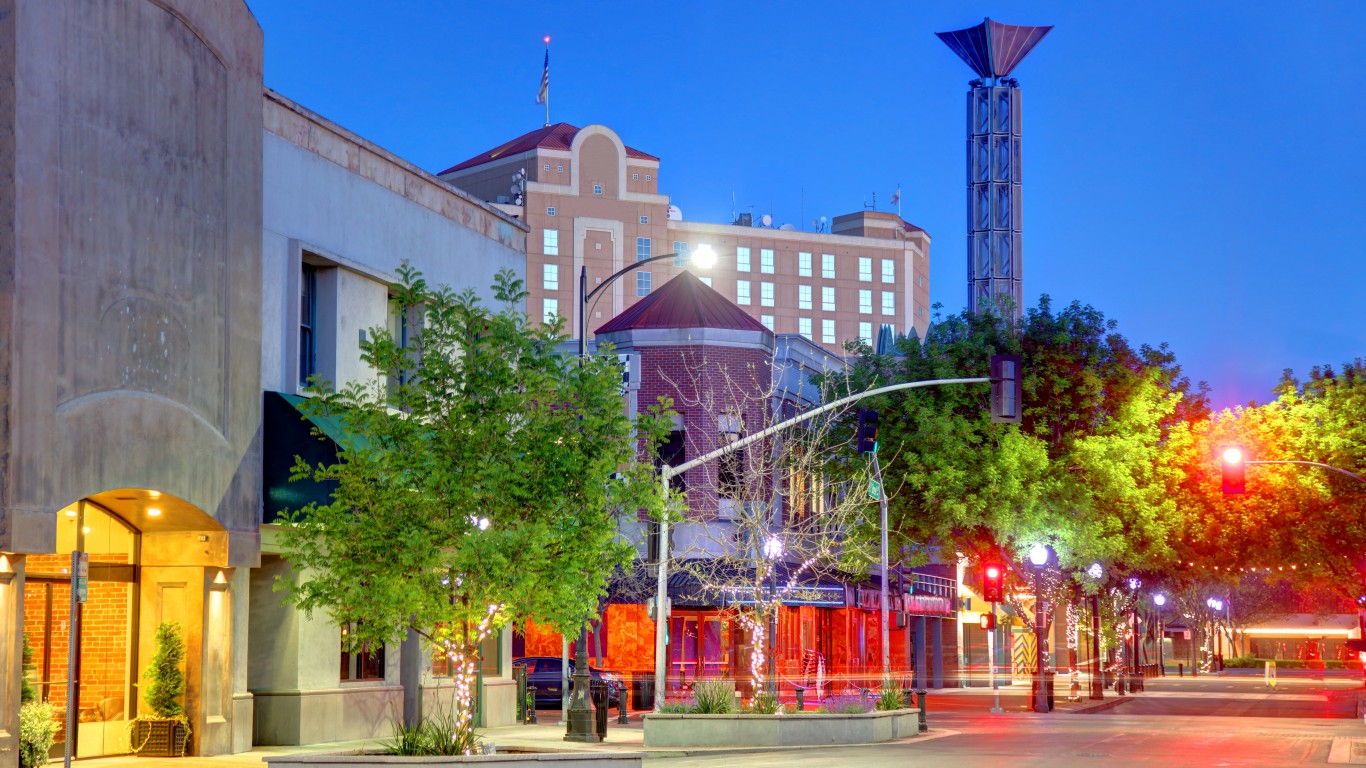
45. Modesto, California
> LawnStarter score: 37.3 (tie)
> Resident satisfaction with city cleanliness: #10 worst out of 200 cities
> Avg daily PM2.5 (county): 12.6 micrograms per cubic meter
> Population: 212,616
[in-text-ad]
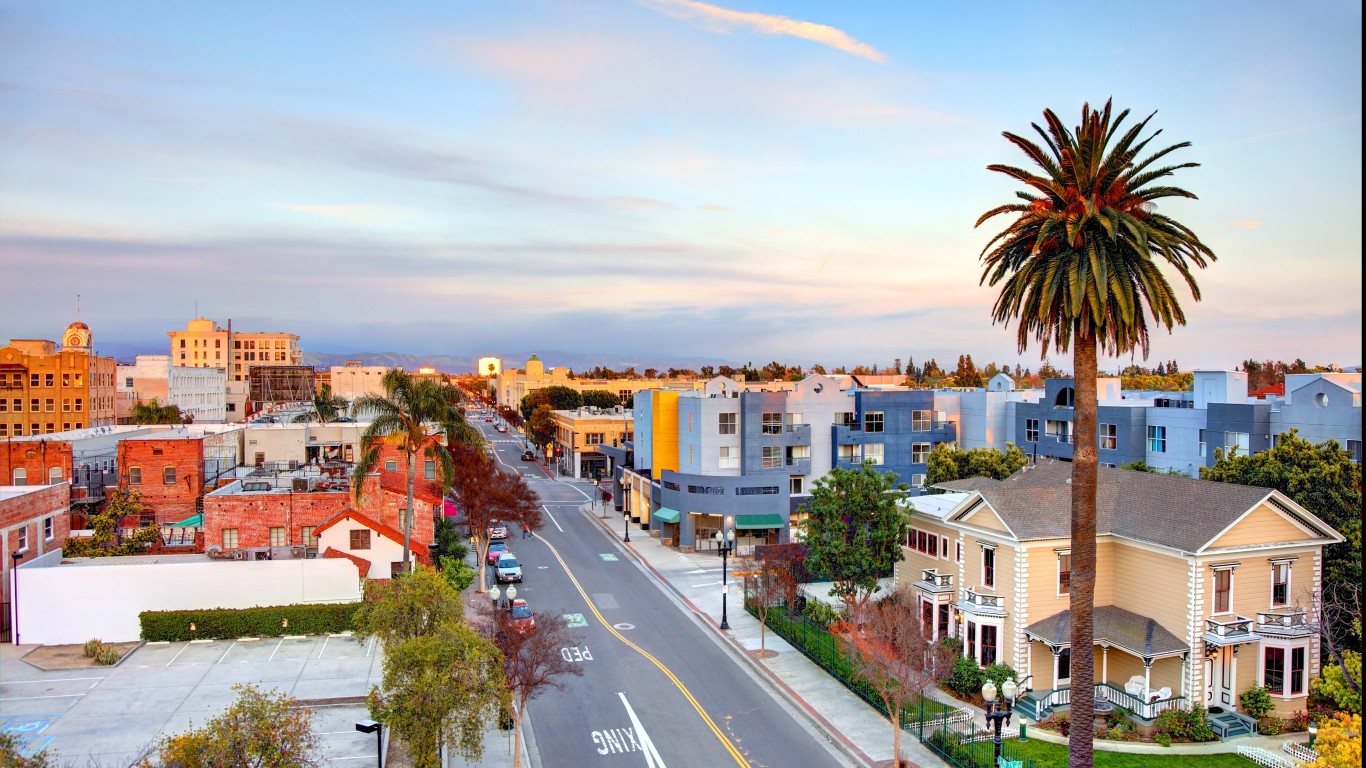
44. Santa Ana, California
> LawnStarter score: 37.6
> Resident satisfaction with city cleanliness: #35 worst out of 200 cities
> Avg daily PM2.5 (county): 9.4 micrograms per cubic meter
> Population: 332,794
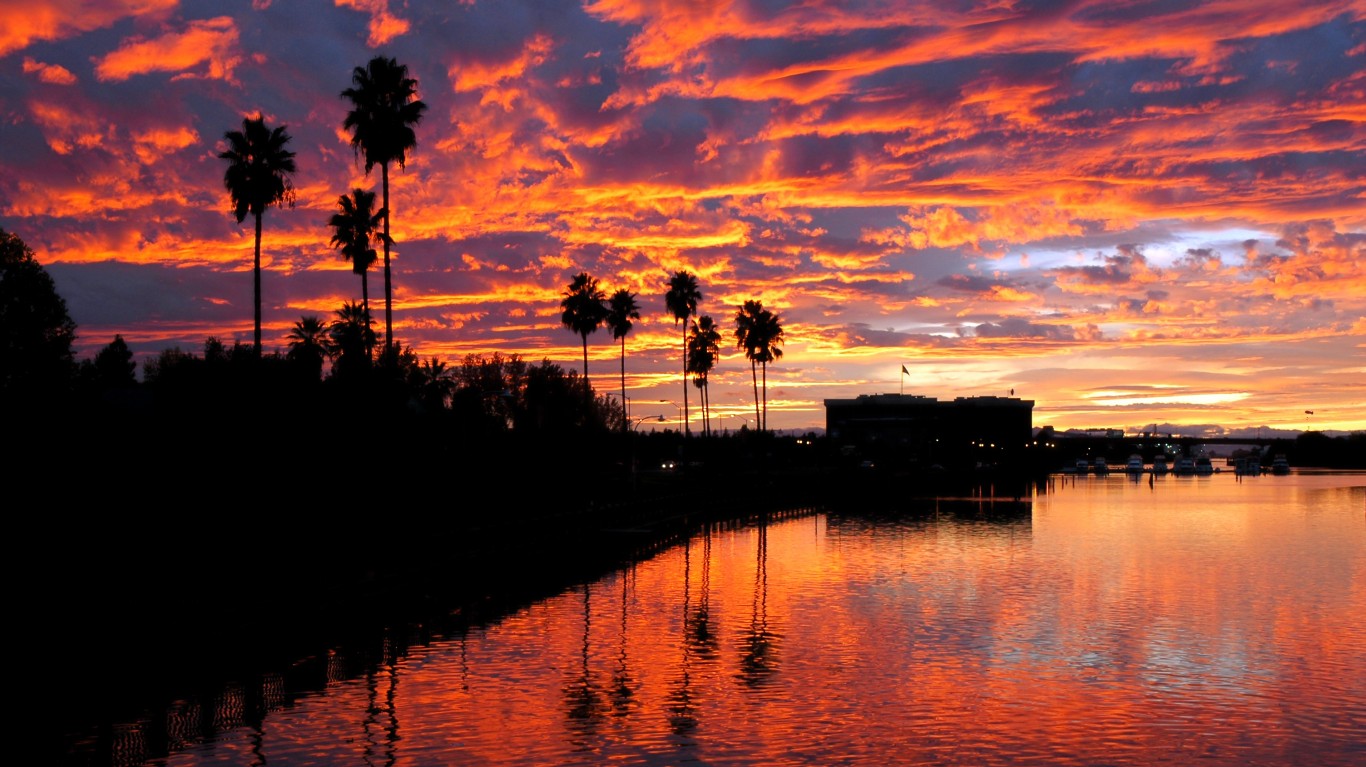
43. Stockton, California
> LawnStarter score: 38.5
> Resident satisfaction with city cleanliness: #5 worst out of 200 cities
> Avg daily PM2.5 (county): 14.1 micrograms per cubic meter
> Population: 309,228
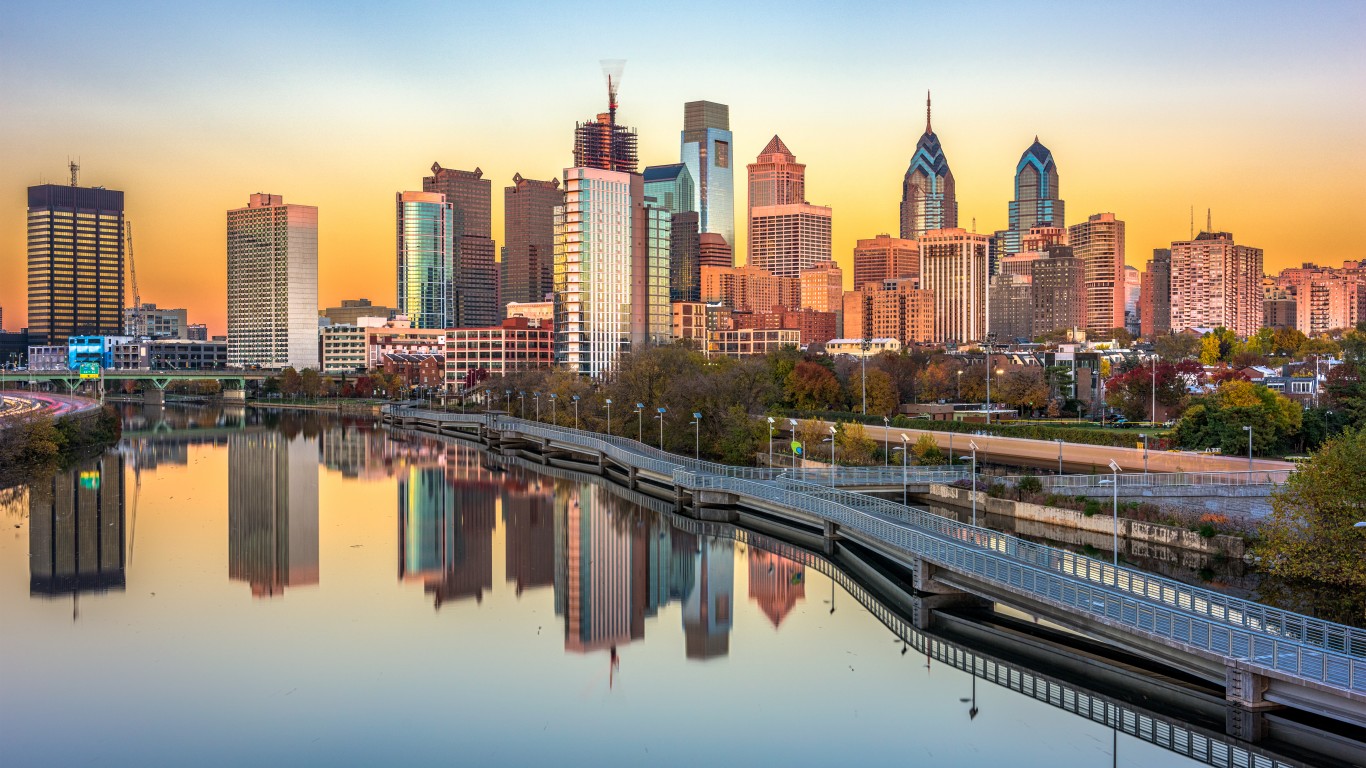
42. Philadelphia, Pennsylvania
> LawnStarter score: 38.8
> Resident satisfaction with city cleanliness: #19 worst out of 200 cities
> Avg daily PM2.5 (county): 10.5 micrograms per cubic meter
> Population: 1,579,075
[in-text-ad-2]
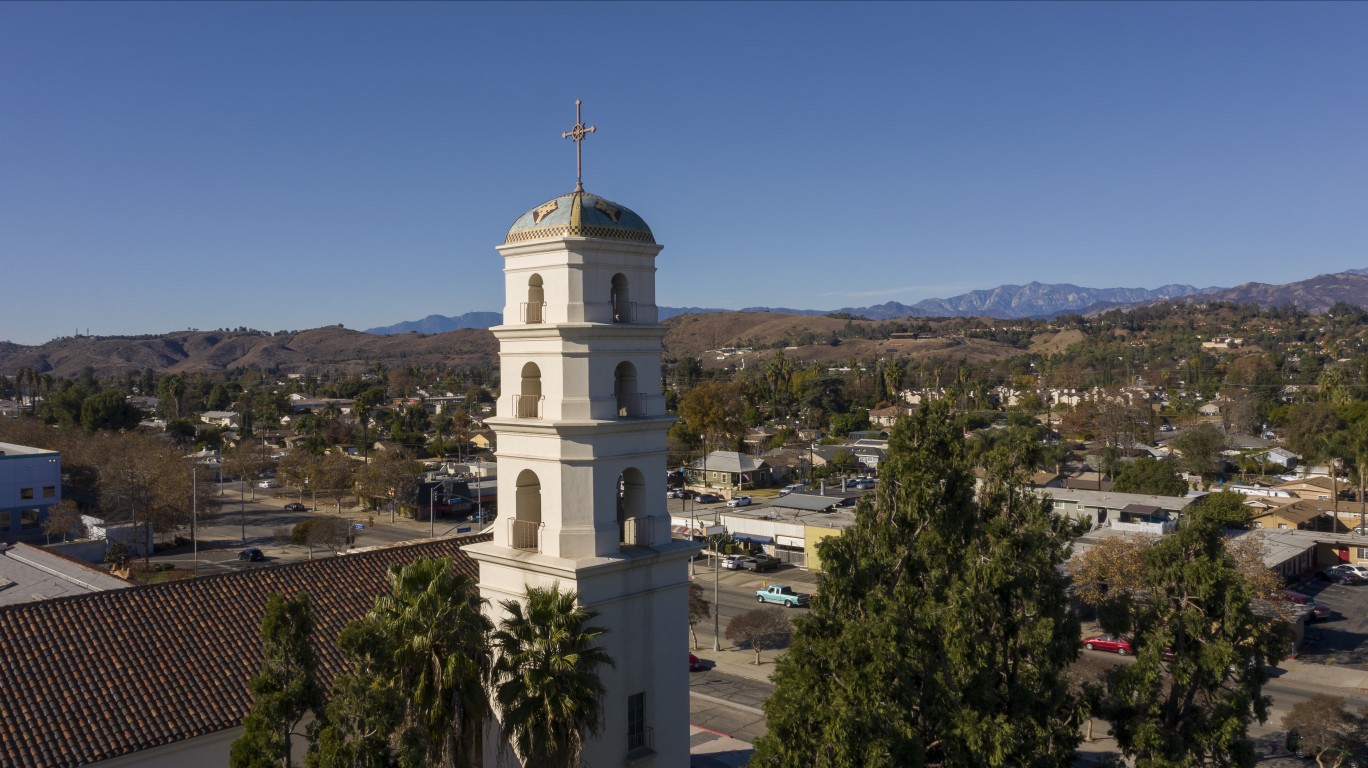
41. Pomona, California
> LawnStarter score: 38.9 (tie)
> Resident satisfaction with city cleanliness: #156 worst out of 200 cities
> Avg daily PM2.5 (county): 12 micrograms per cubic meter
> Population: 152,209
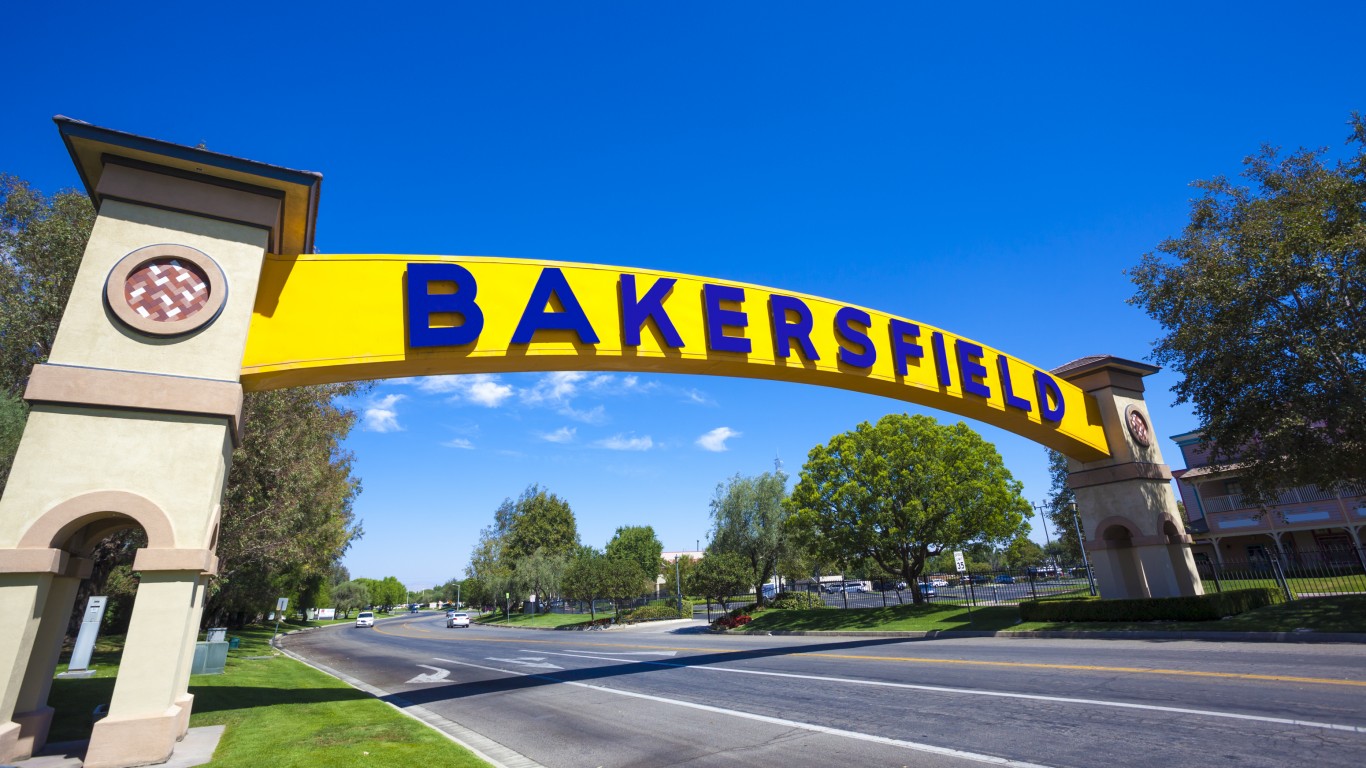
40. Bakersfield, California
> LawnStarter score: 38.9 (tie)
> Resident satisfaction with city cleanliness: #9 worst out of 200 cities
> Avg daily PM2.5 (county): 16 micrograms per cubic meter
> Population: 377,917
[in-text-ad]
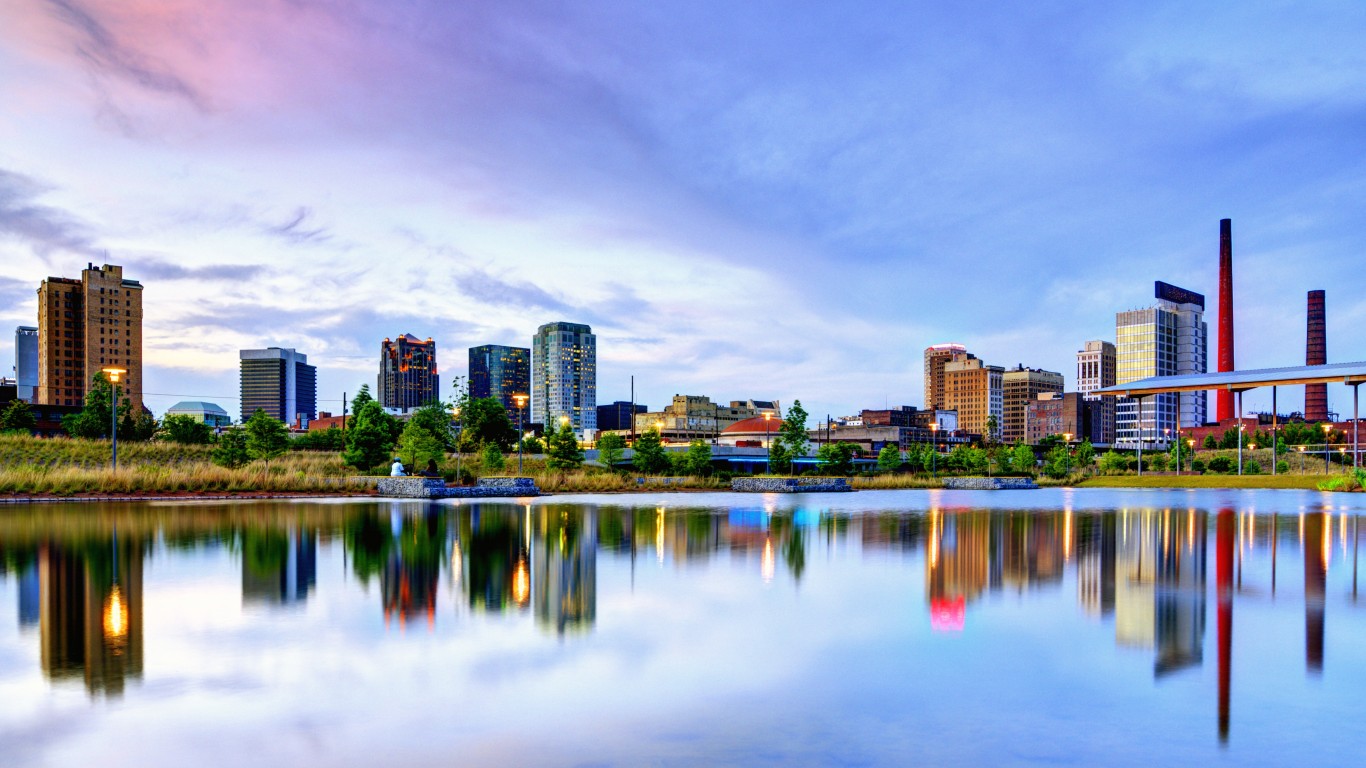
39. Birmingham, Alabama
> LawnStarter score: 39.3
> Resident satisfaction with city cleanliness: #79 worst out of 200 cities
> Avg daily PM2.5 (county): 10.8 micrograms per cubic meter
> Population: 212,297
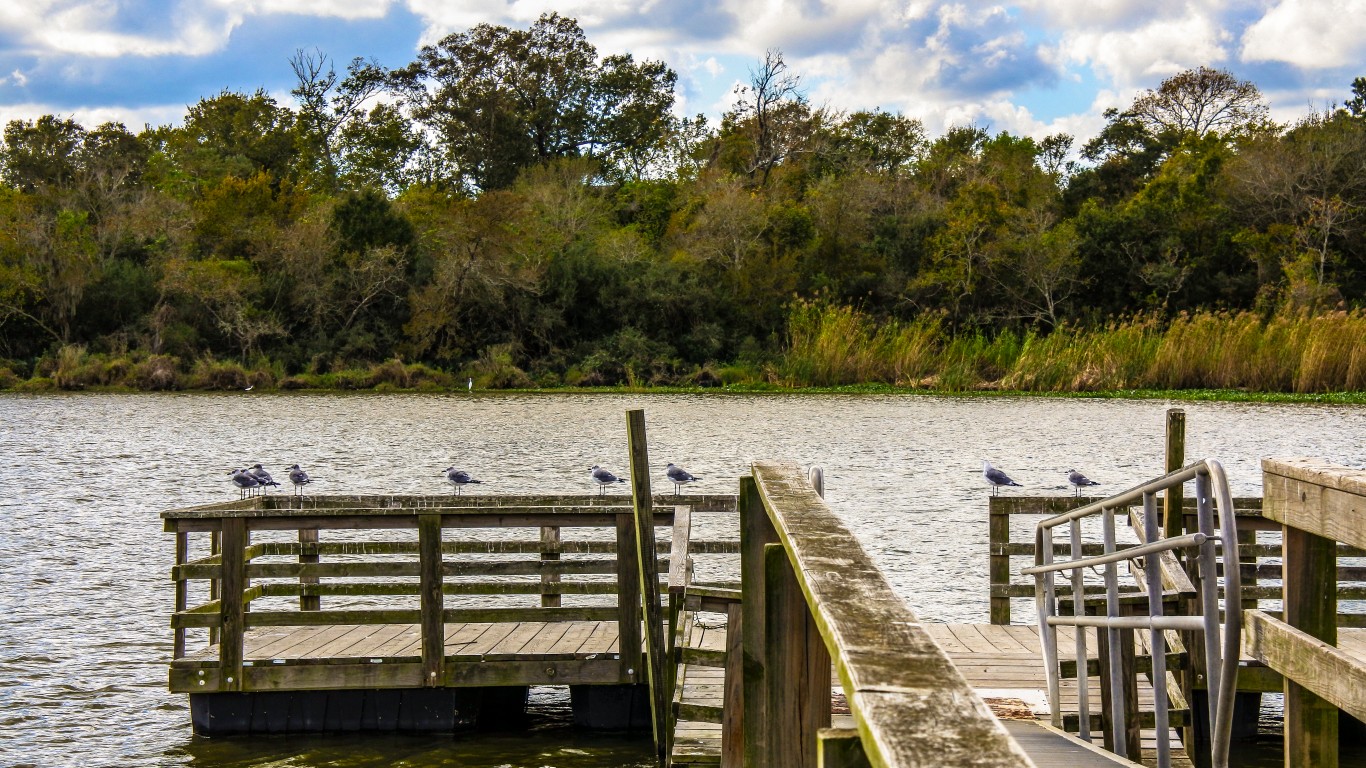
38. Pasadena, Texas
> LawnStarter score: 39.5 (tie)
> Resident satisfaction with city cleanliness: #156 worst out of 200 cities
> Avg daily PM2.5 (county): 10.1 micrograms per cubic meter
> Population: 153,350
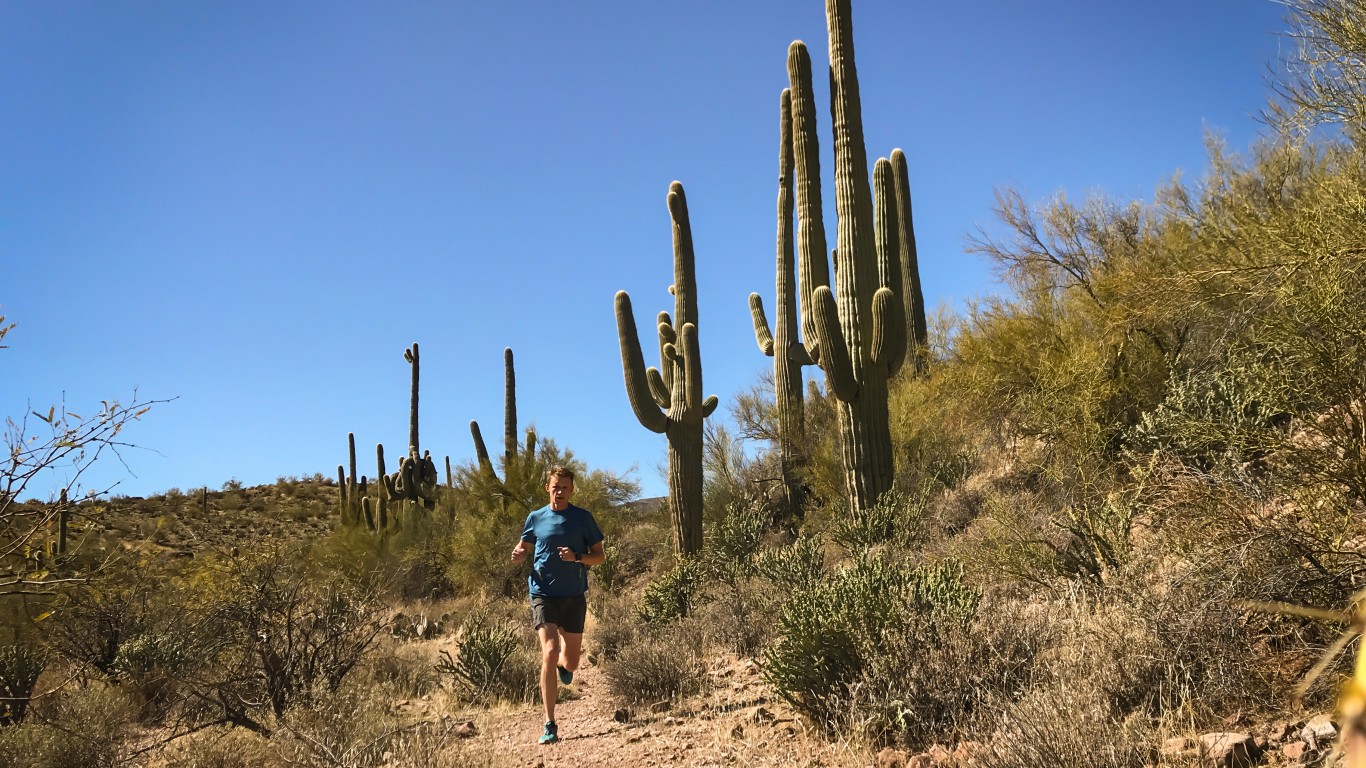
37. Peoria, Arizona
> LawnStarter score: 39.5 (tie)
> Resident satisfaction with city cleanliness: #120 worst out of 200 cities
> Avg daily PM2.5 (county): 9.5 micrograms per cubic meter
> Population: 168,196
[in-text-ad-2]
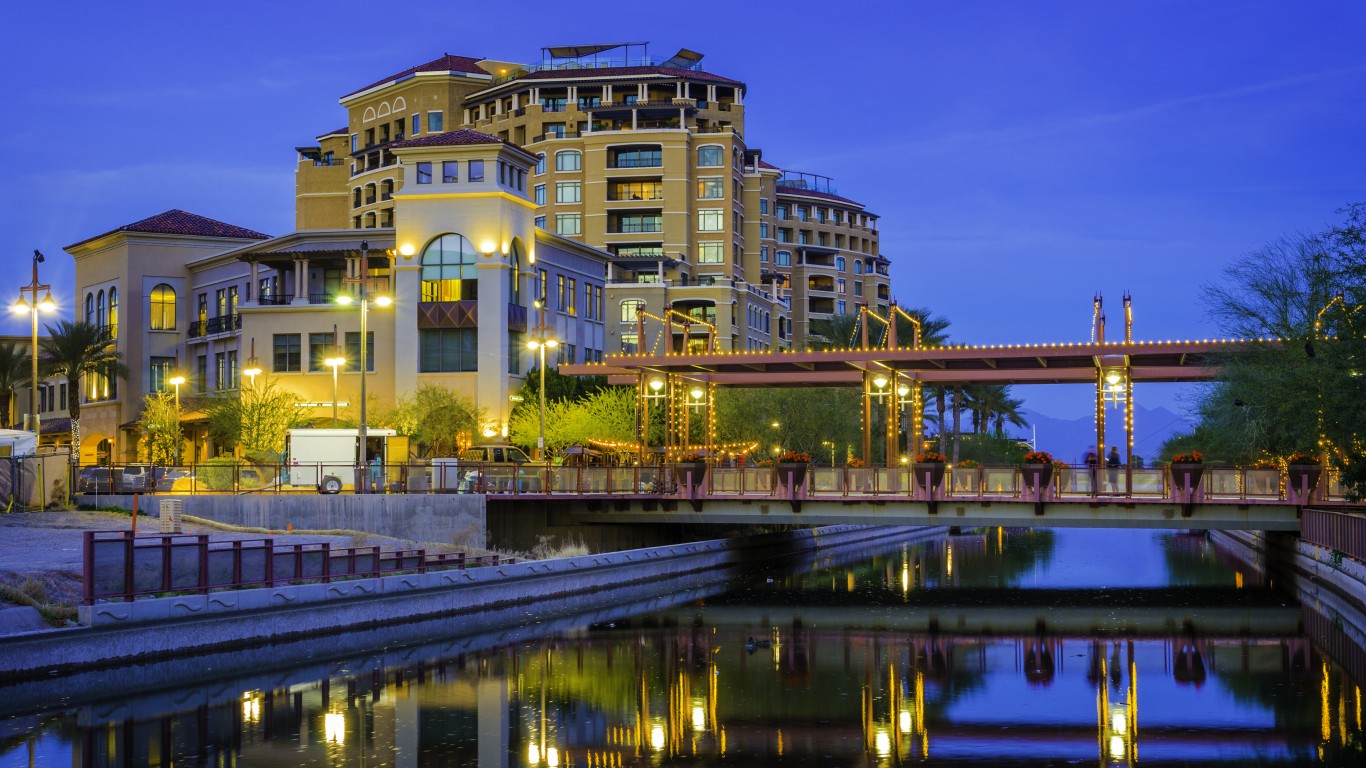
36. Scottsdale, Arizona
> LawnStarter score: 39.6
> Resident satisfaction with city cleanliness: #99 worst out of 200 cities
> Avg daily PM2.5 (county): 9.5 micrograms per cubic meter
> Population: 250,602
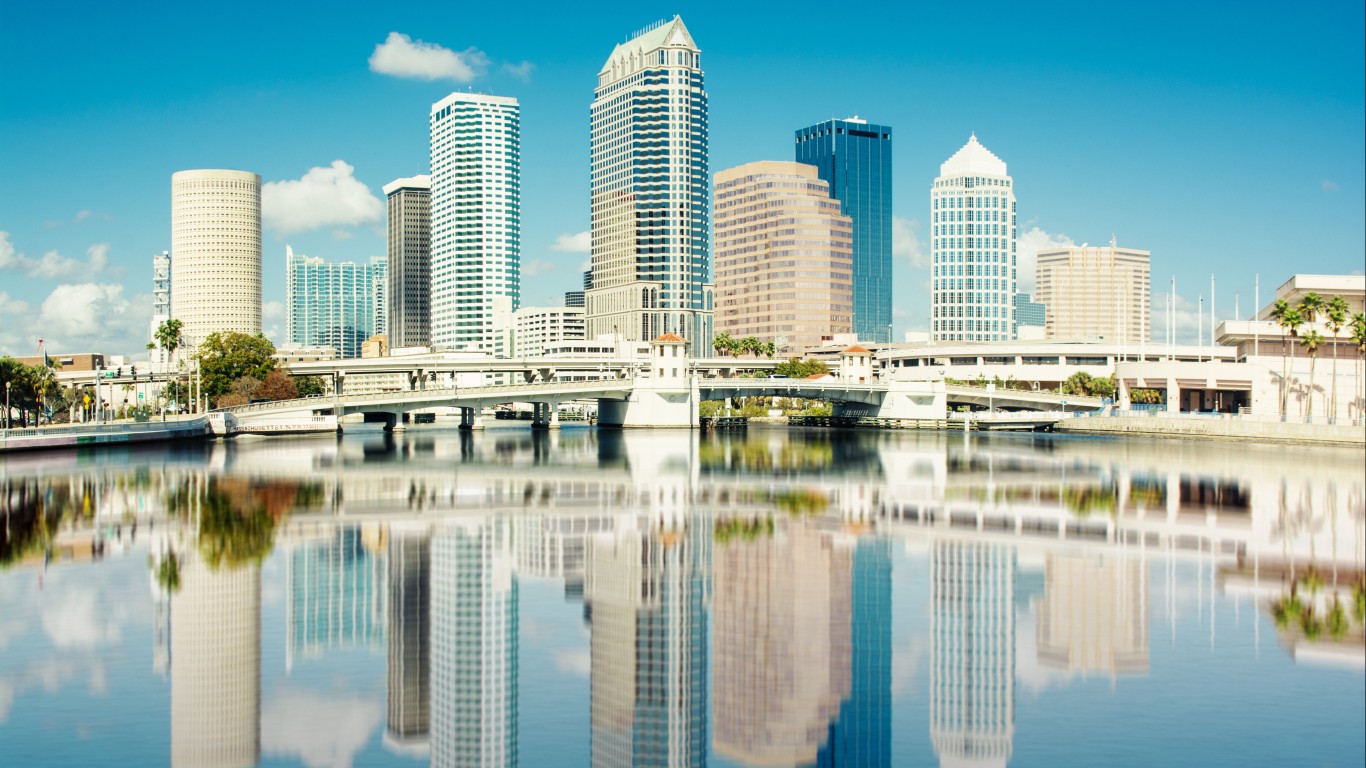
35. Tampa, Florida
> LawnStarter score: 40.1 (tie)
> Resident satisfaction with city cleanliness: #105 worst out of 200 cities
> Avg daily PM2.5 (county): 8.6 micrograms per cubic meter
> Population: 387,916
[in-text-ad]
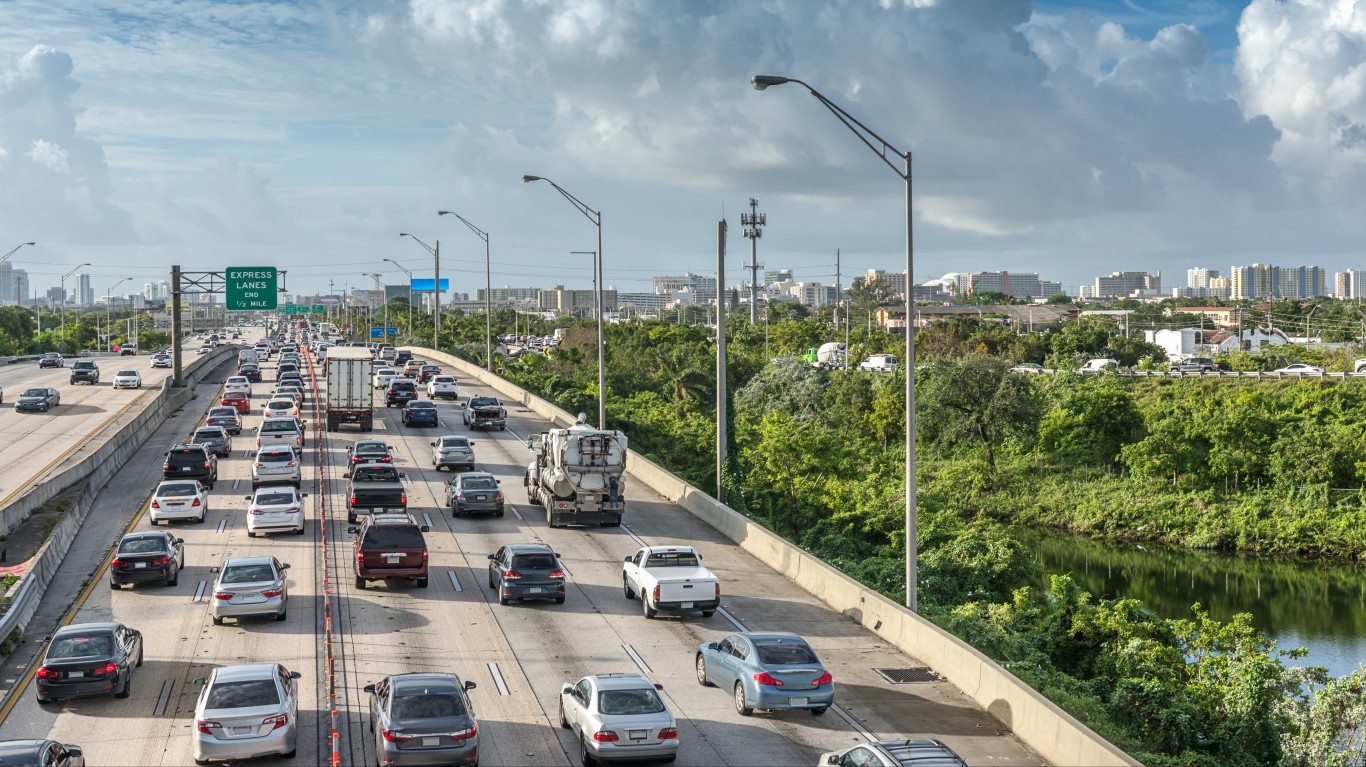
34. Miami, Florida
> LawnStarter score: 40.1 (tie)
> Resident satisfaction with city cleanliness: #50 worst out of 200 cities
> Avg daily PM2.5 (county): 7.7 micrograms per cubic meter
> Population: 454,279
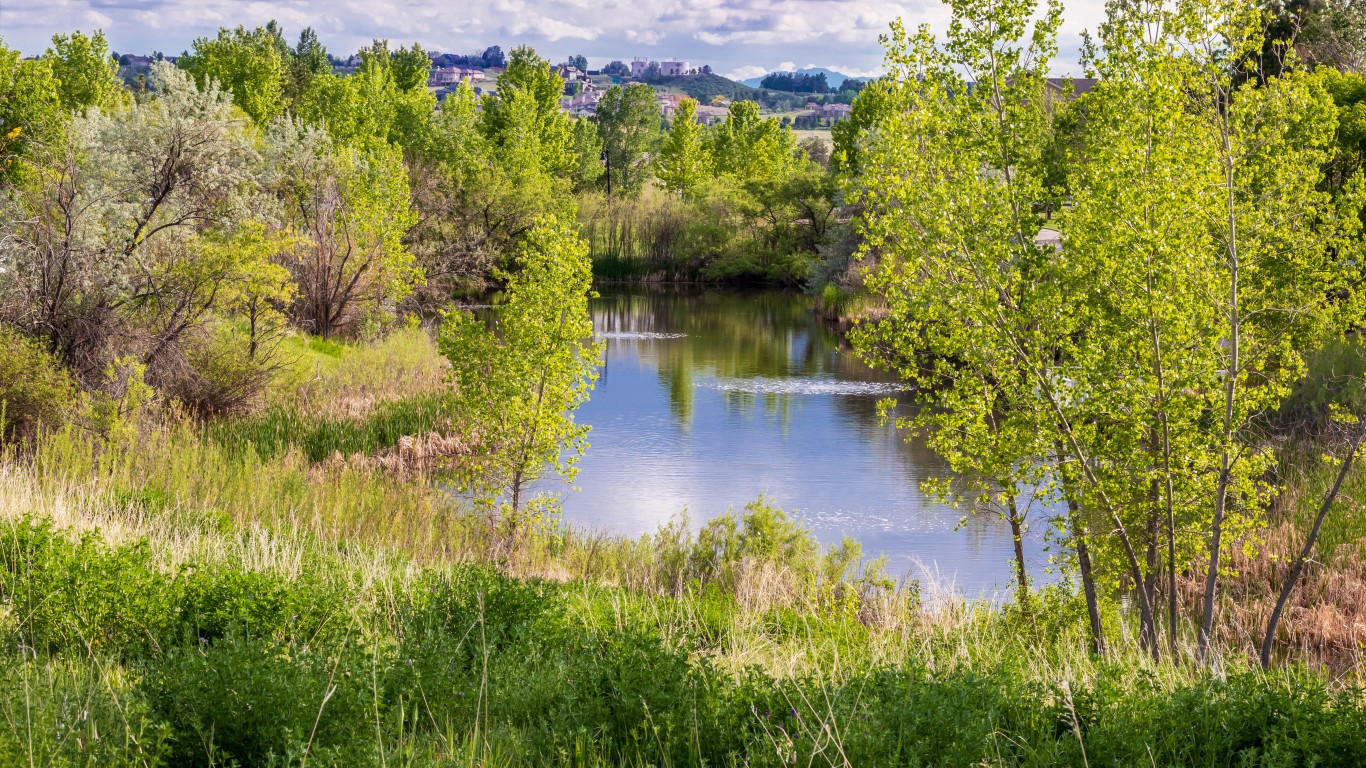
33. Aurora, Colorado
> LawnStarter score: 40.5
> Resident satisfaction with city cleanliness: #51 worst out of 200 cities
> Avg daily PM2.5 (county): 9.2 micrograms per cubic meter
> Population: 369,111

32. Tempe, Arizona
> LawnStarter score: 40.6
> Resident satisfaction with city cleanliness: #93 worst out of 200 cities
> Avg daily PM2.5 (county): 9.5 micrograms per cubic meter
> Population: 187,454
[in-text-ad-2]
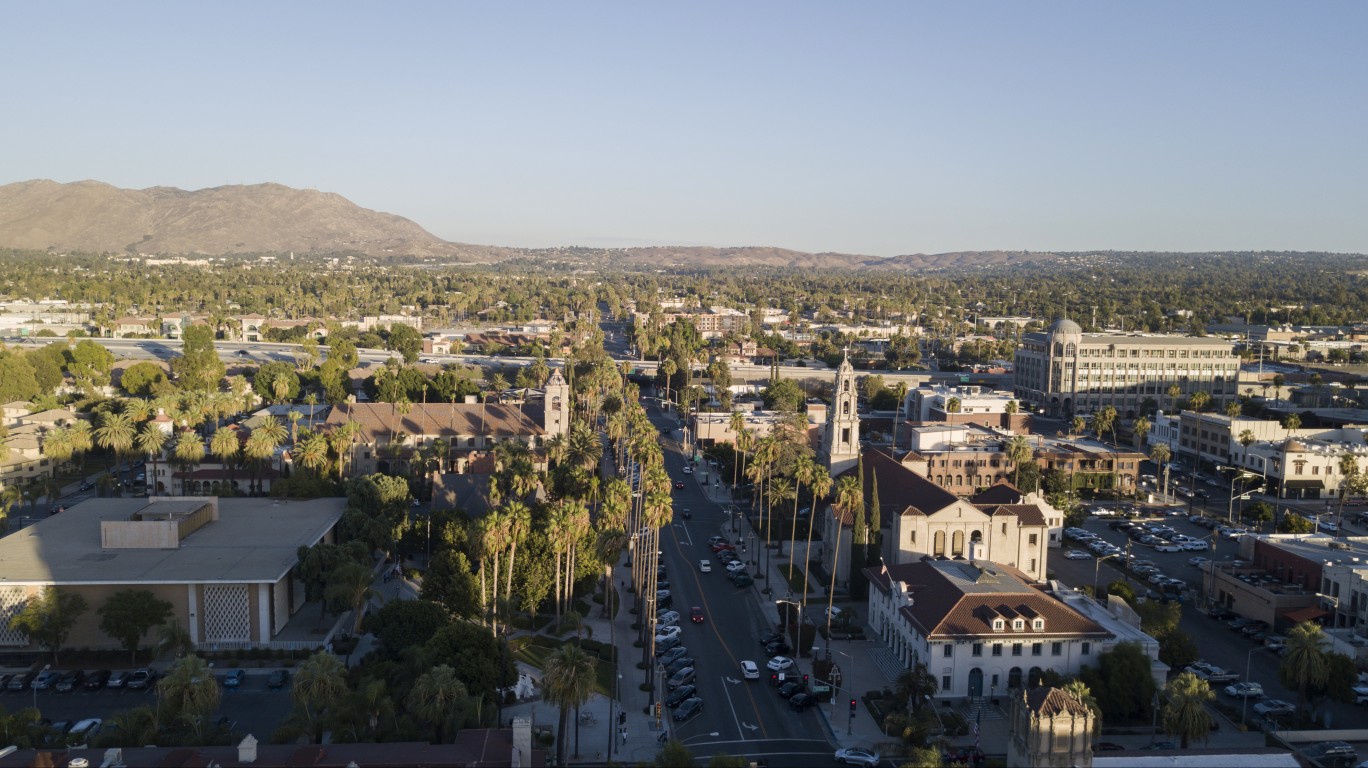
31. Riverside, California
> LawnStarter score: 40.8
> Resident satisfaction with city cleanliness: #44 worst out of 200 cities
> Avg daily PM2.5 (county): 14.1 micrograms per cubic meter
> Population: 326,414
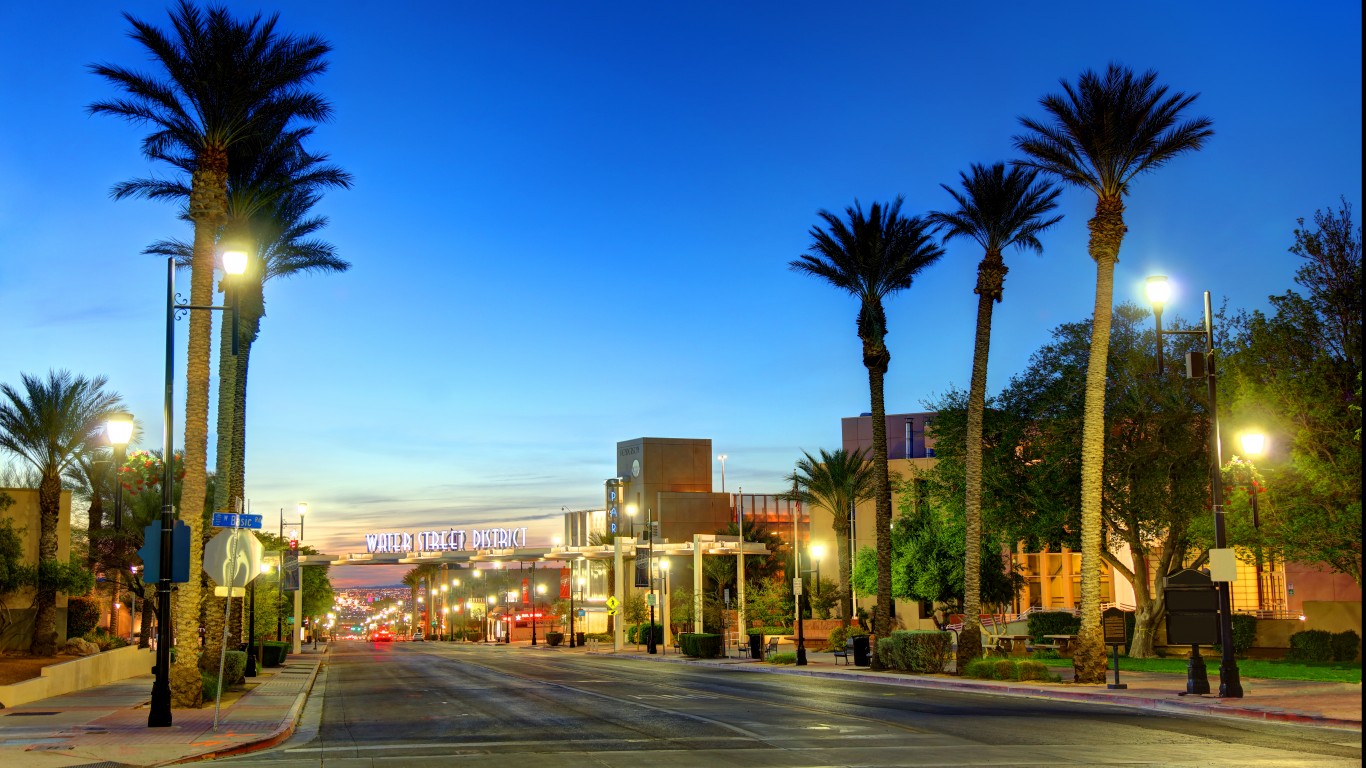
30. Henderson, Nevada
> LawnStarter score: 41
> Resident satisfaction with city cleanliness: #60 worst out of 200 cities
> Avg daily PM2.5 (county): 10.8 micrograms per cubic meter
> Population: 300,116
[in-text-ad]
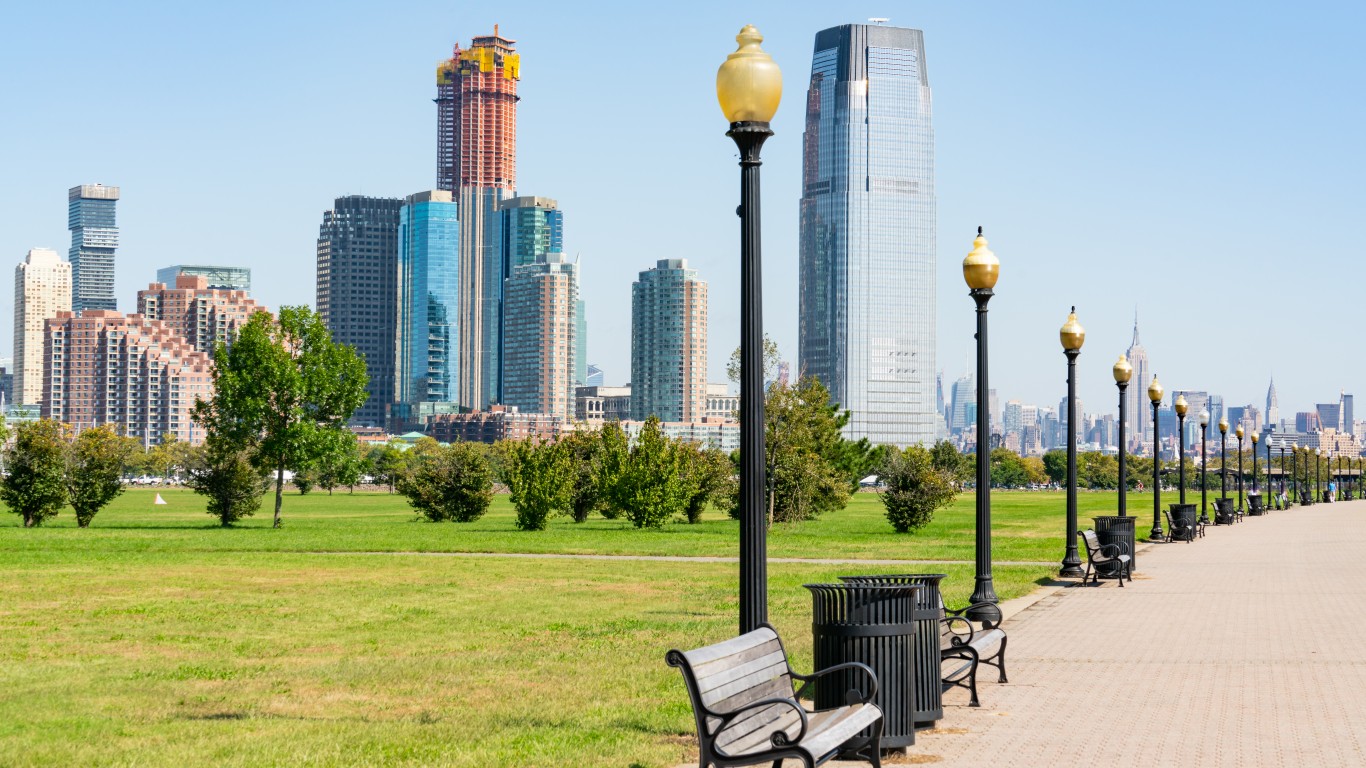
29. Jersey City, New Jersey
> LawnStarter score: 41.3
> Resident satisfaction with city cleanliness: #25 worst out of 200 cities
> Avg daily PM2.5 (county): 9.6 micrograms per cubic meter
> Population: 261,940
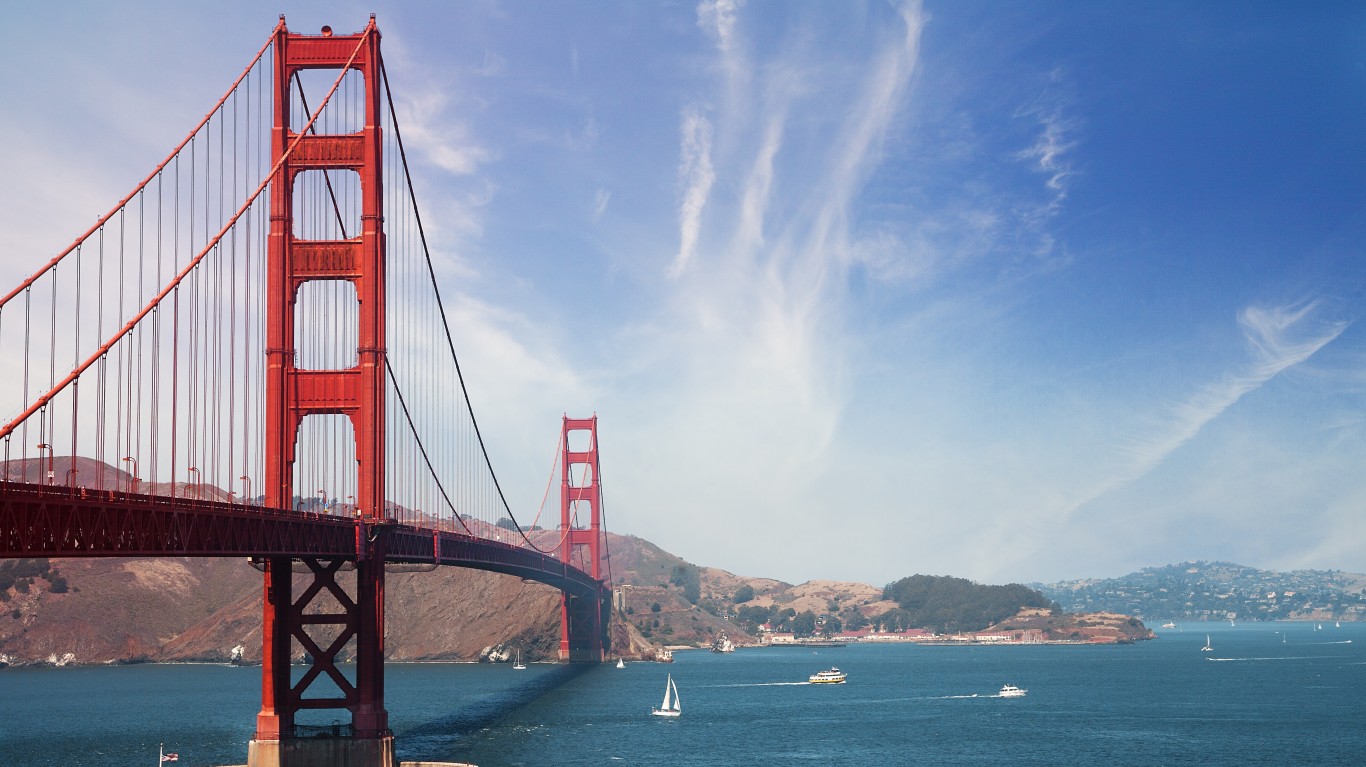
28. San Francisco, California
> LawnStarter score: 41.6
> Resident satisfaction with city cleanliness: #24 worst out of 200 cities
> Avg daily PM2.5 (county): 7.6 micrograms per cubic meter
> Population: 874,961
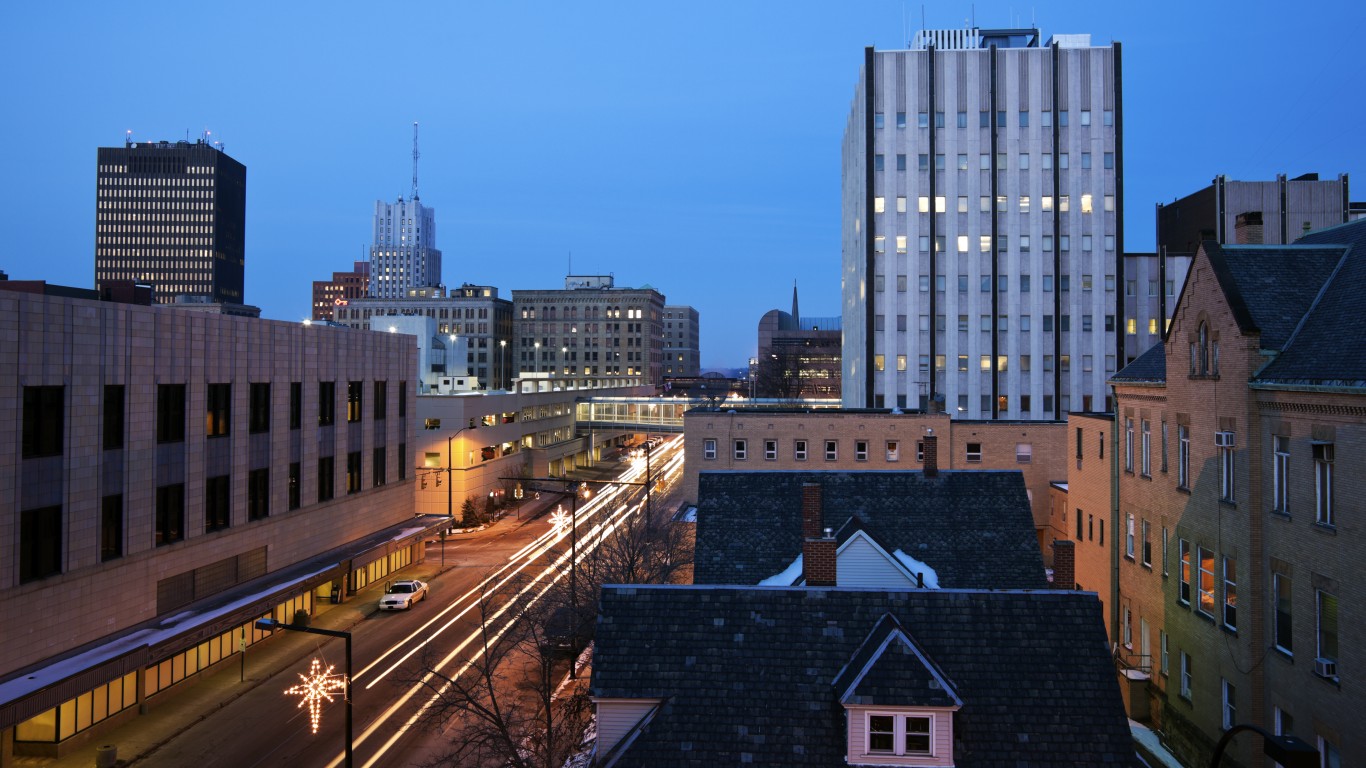
27. Akron, Ohio
> LawnStarter score: 41.7
> Resident satisfaction with city cleanliness: #29 worst out of 200 cities
> Avg daily PM2.5 (county): 10.3 micrograms per cubic meter
> Population: 198,051
[in-text-ad-2]
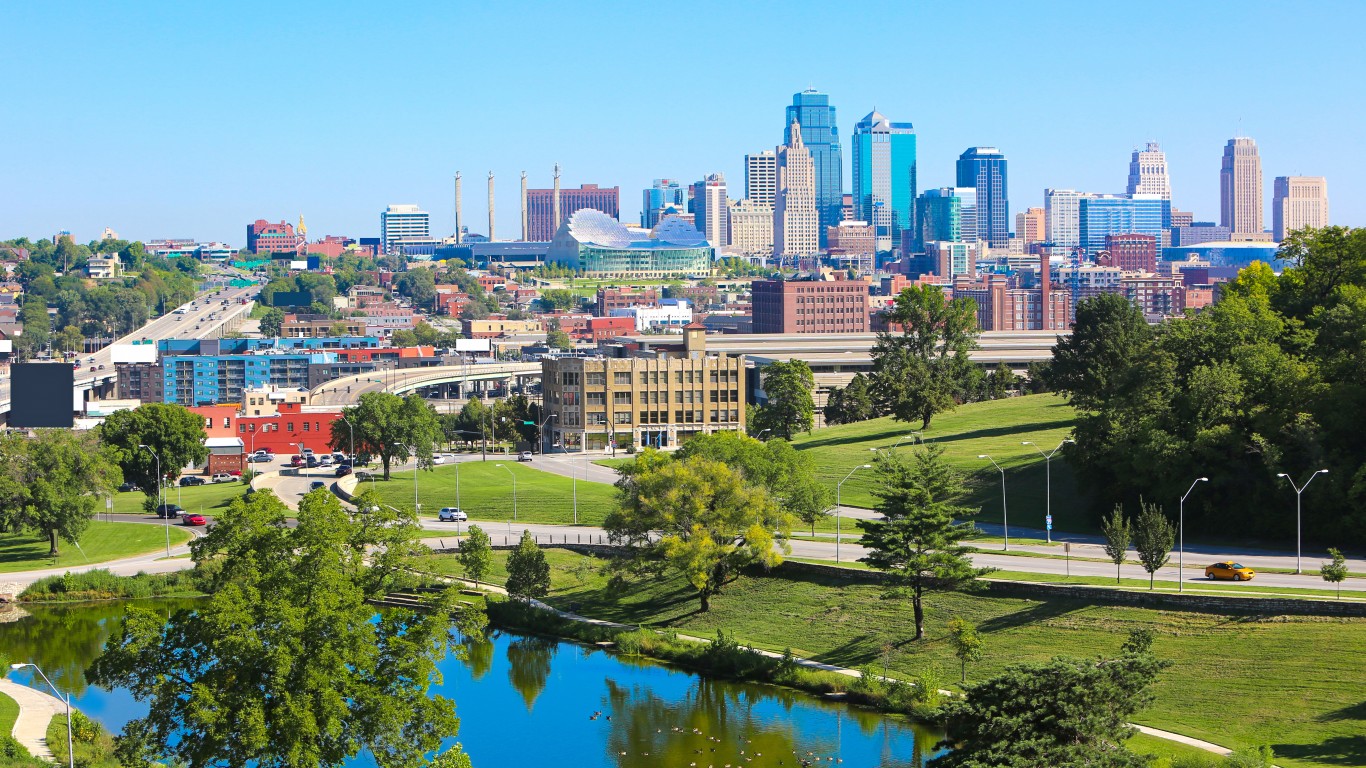
26. Kansas City, Kansas
> LawnStarter score: 42.1
> Resident satisfaction with city cleanliness: #67 worst out of 200 cities
> Avg daily PM2.5 (county): 8 micrograms per cubic meter
> Population: 152,522
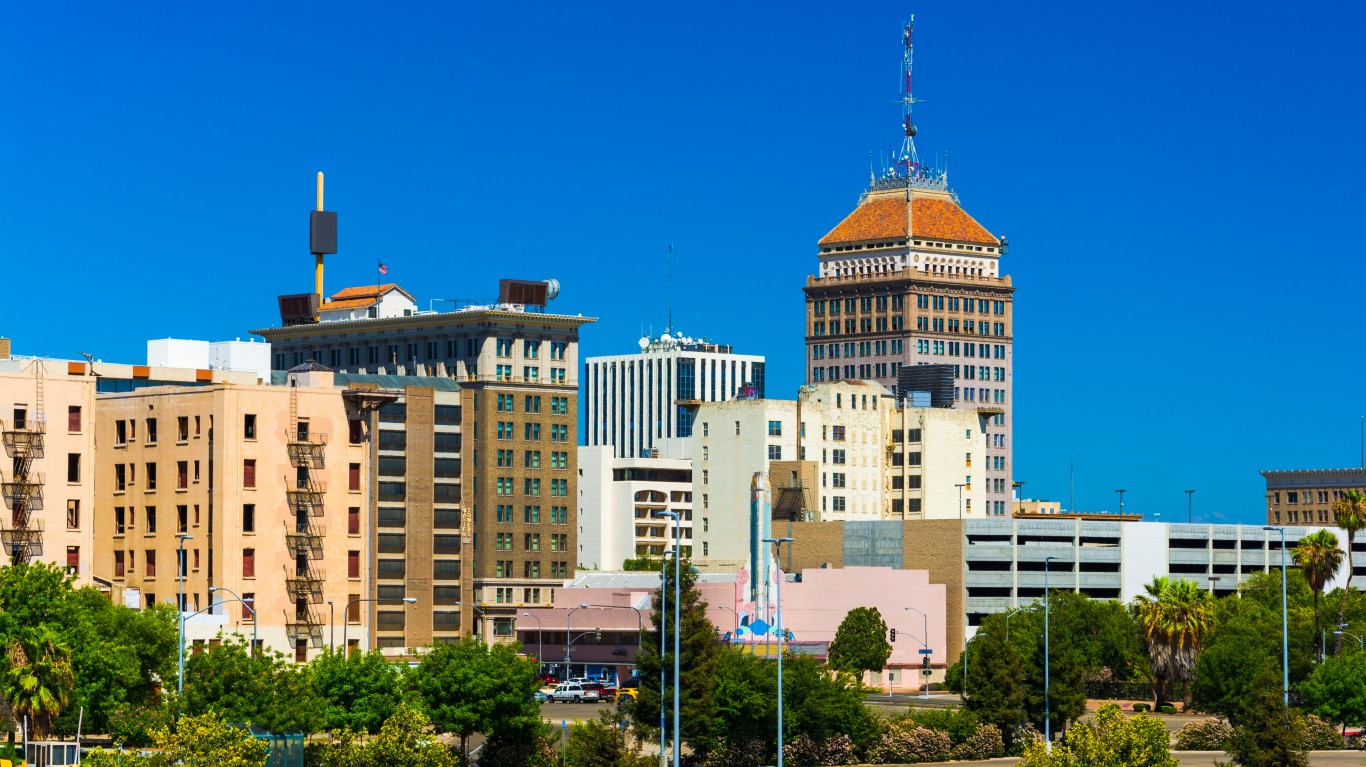
25. Fresno, California
> LawnStarter score: 42.5
> Resident satisfaction with city cleanliness: #6 worst out of 200 cities
> Avg daily PM2.5 (county): 14.4 micrograms per cubic meter
> Population: 525,010
[in-text-ad]
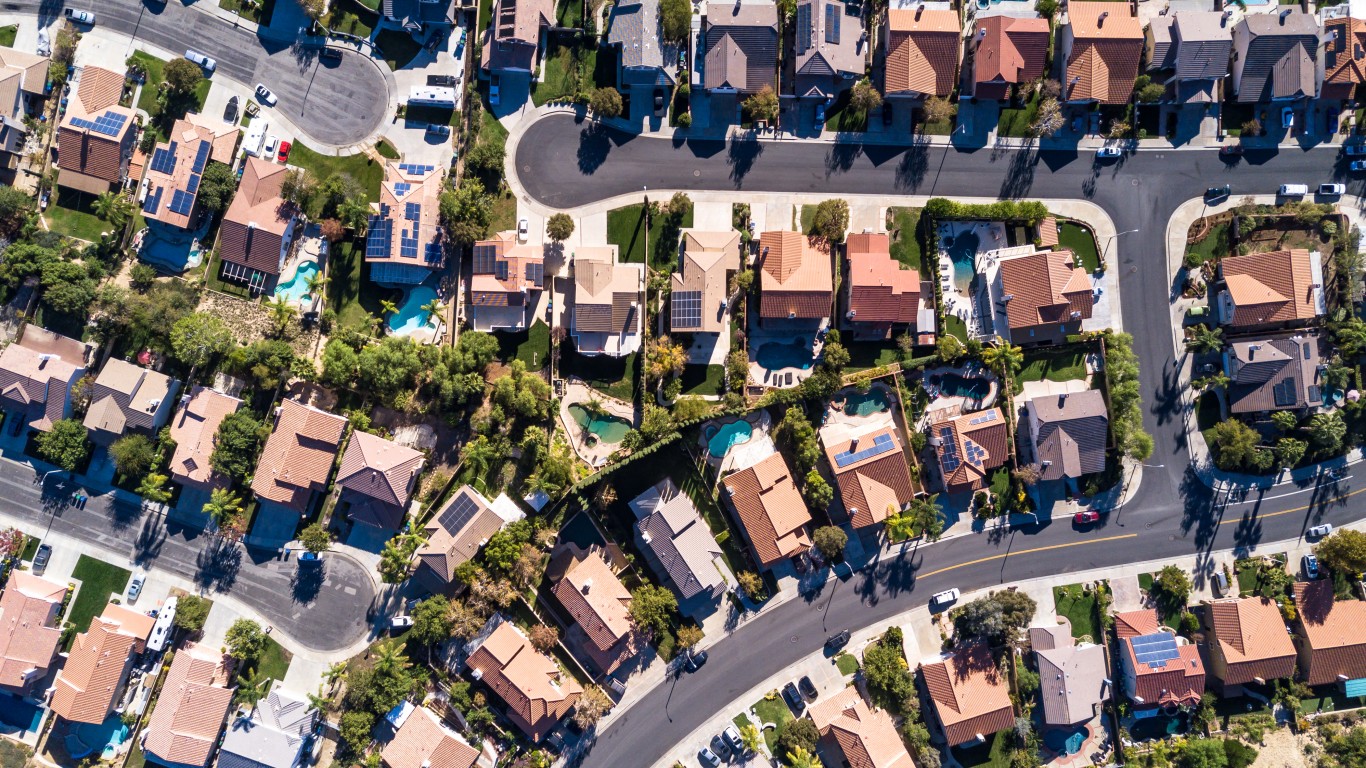
24. Santa Clarita, California
> LawnStarter score: 42.7
> Resident satisfaction with city cleanliness: #139 worst out of 200 cities
> Avg daily PM2.5 (county): 12 micrograms per cubic meter
> Population: 213,411
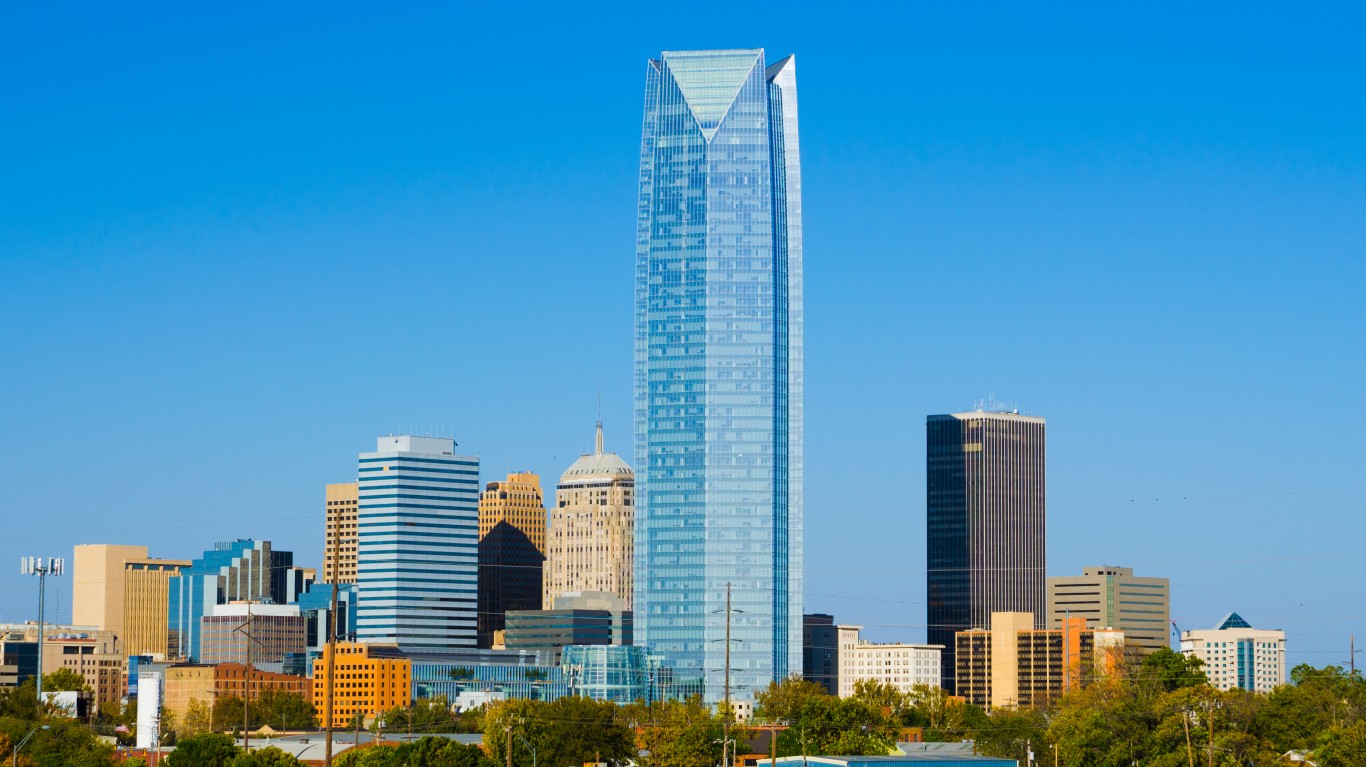
23. Oklahoma City, Oklahoma
> LawnStarter score: 42.8
> Resident satisfaction with city cleanliness: #111 worst out of 200 cities
> Avg daily PM2.5 (county): 8.4 micrograms per cubic meter
> Population: 643,692
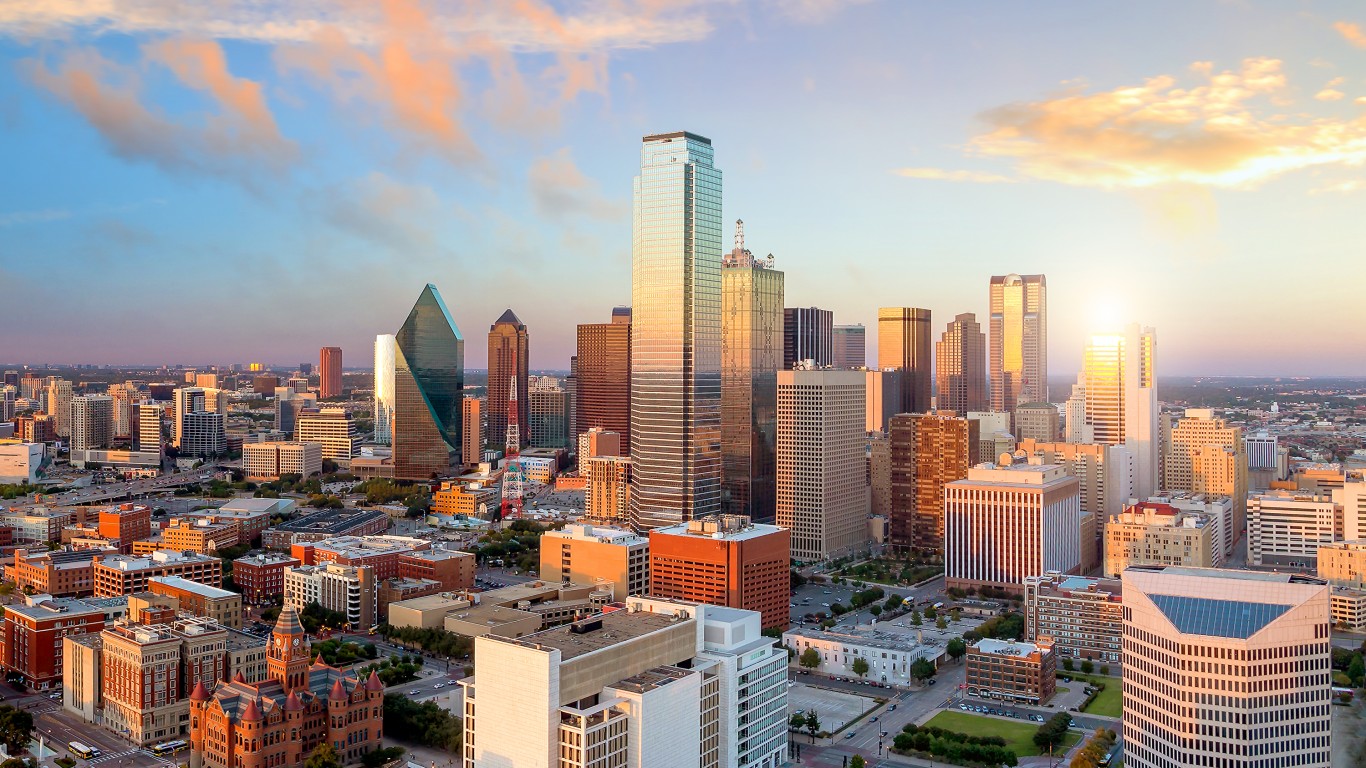
22. Dallas, Texas
> LawnStarter score: 43
> Resident satisfaction with city cleanliness: #47 worst out of 200 cities
> Avg daily PM2.5 (county): 8.8 micrograms per cubic meter
> Population: 1,330,612
[in-text-ad-2]
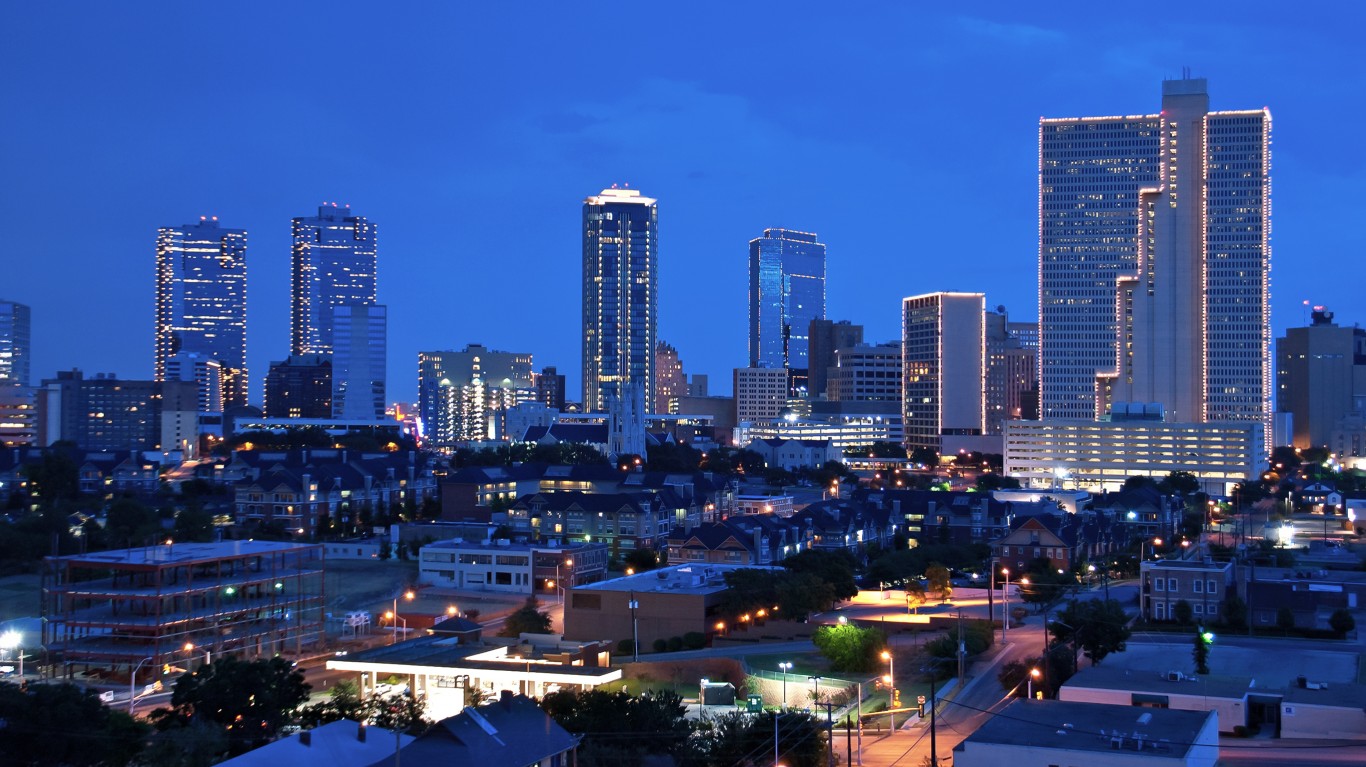
21. Fort Worth, Texas
> LawnStarter score: 43.2
> Resident satisfaction with city cleanliness: #18 worst out of 200 cities
> Avg daily PM2.5 (county): 8.5 micrograms per cubic meter
> Population: 874,401
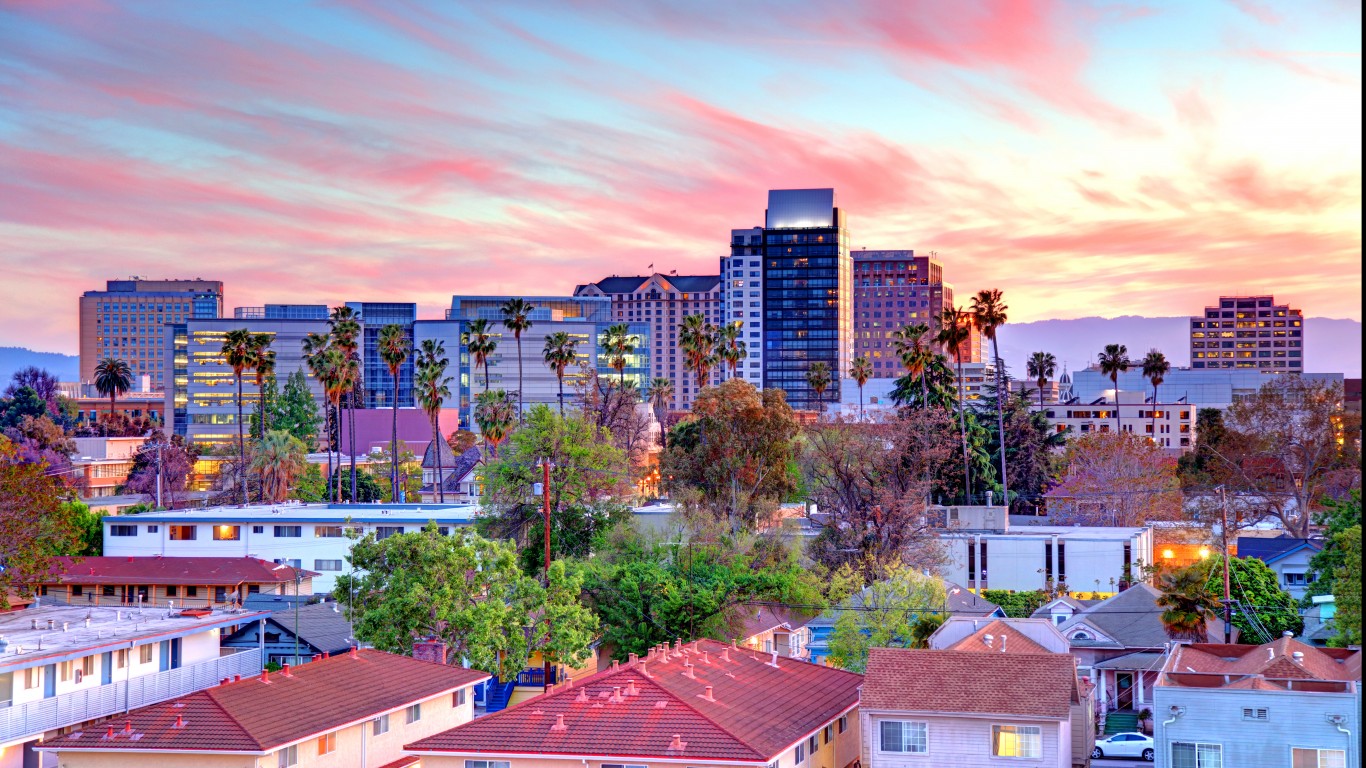
20. San Jose, California
> LawnStarter score: 43.5
> Resident satisfaction with city cleanliness: #28 worst out of 200 cities
> Avg daily PM2.5 (county): 9.1 micrograms per cubic meter
> Population: 1,027,690
[in-text-ad]
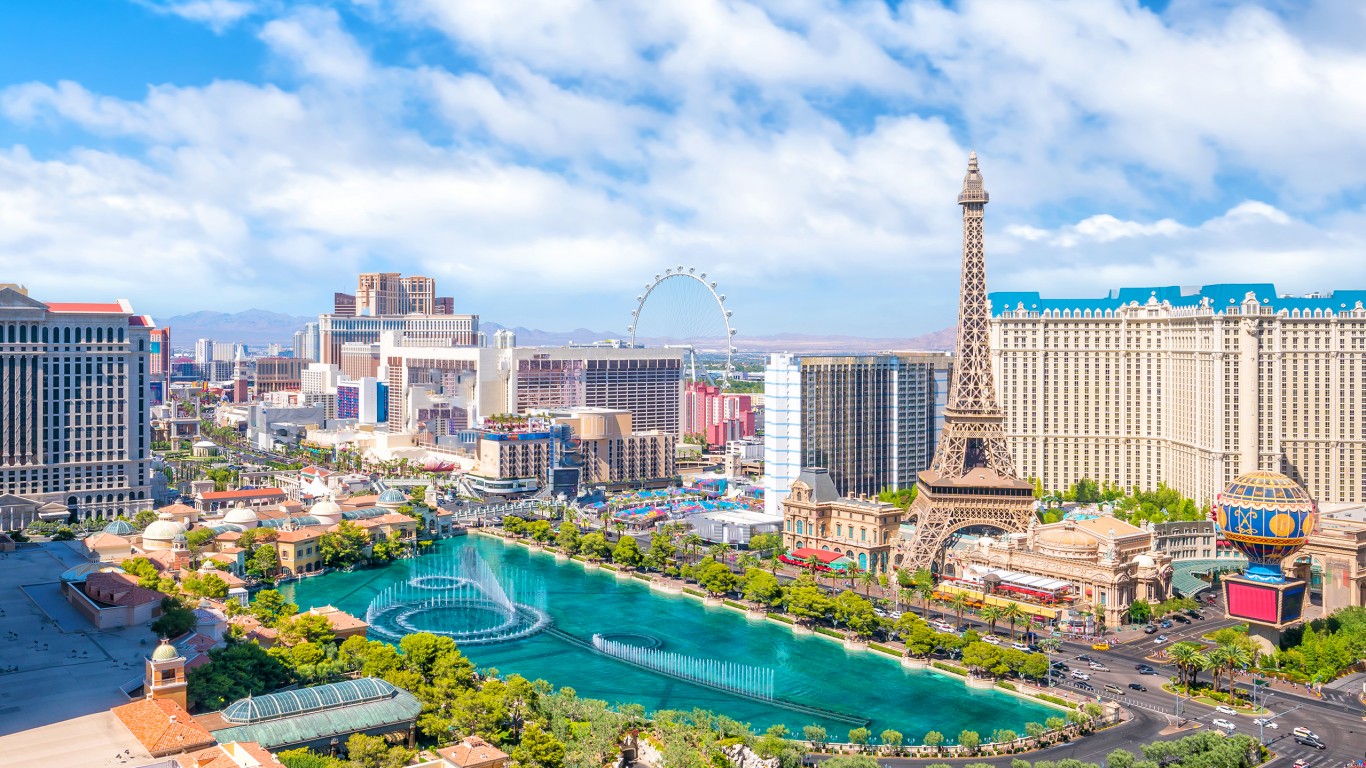
19. Las Vegas, Nevada
> LawnStarter score: 43.6
> Resident satisfaction with city cleanliness: #31 worst out of 200 cities
> Avg daily PM2.5 (county): 10.8 micrograms per cubic meter
> Population: 634,773
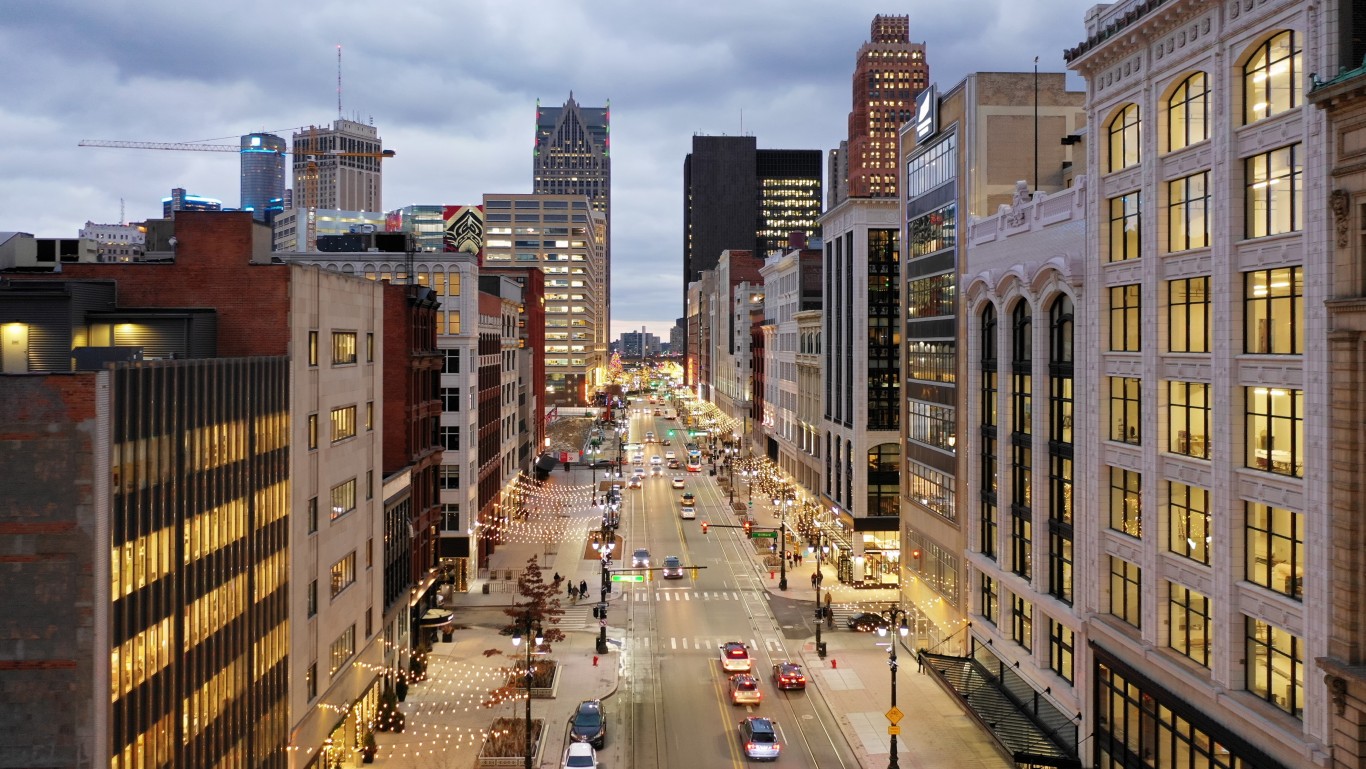
18. Detroit, Michigan
> LawnStarter score: 44.1 (tie)
> Resident satisfaction with city cleanliness: #3 worst out of 200 cities
> Avg daily PM2.5 (county): 11.3 micrograms per cubic meter
> Population: 674,841
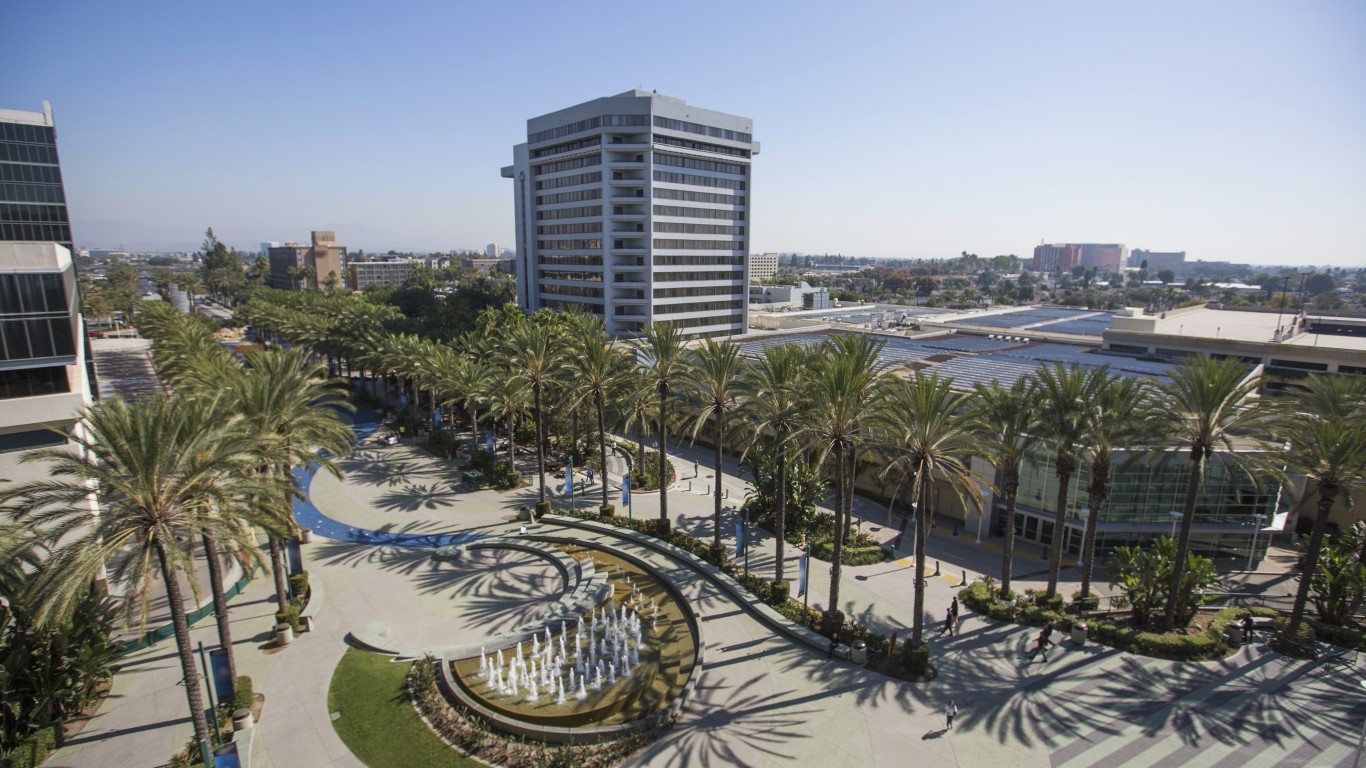
17. Anaheim, California
> LawnStarter score: 44.1 (tie)
> Resident satisfaction with city cleanliness: #22 worst out of 200 cities
> Avg daily PM2.5 (county): 9.4 micrograms per cubic meter
> Population: 349,964
[in-text-ad-2]
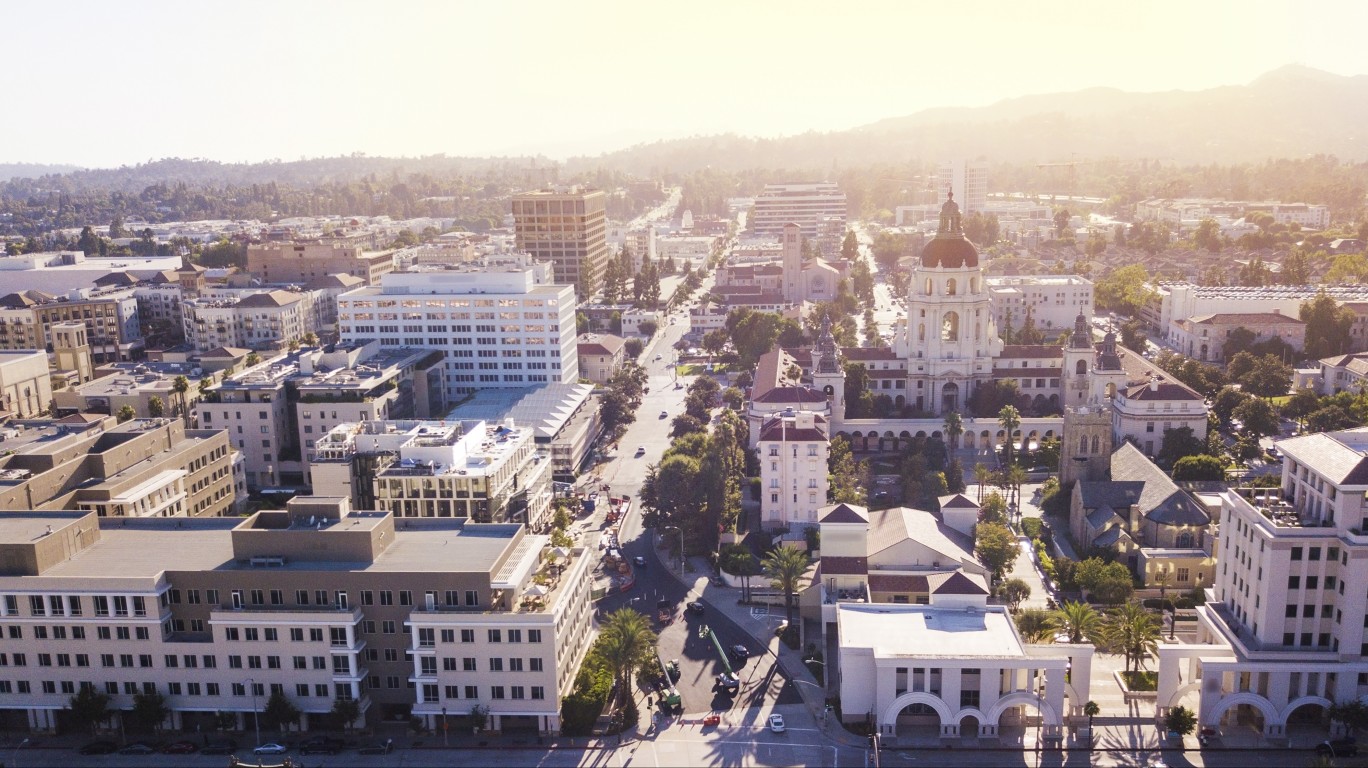
16. Pasadena, California
> LawnStarter score: 44.3
> Resident satisfaction with city cleanliness: #107 worst out of 200 cities
> Avg daily PM2.5 (county): 12 micrograms per cubic meter
> Population: 141,258
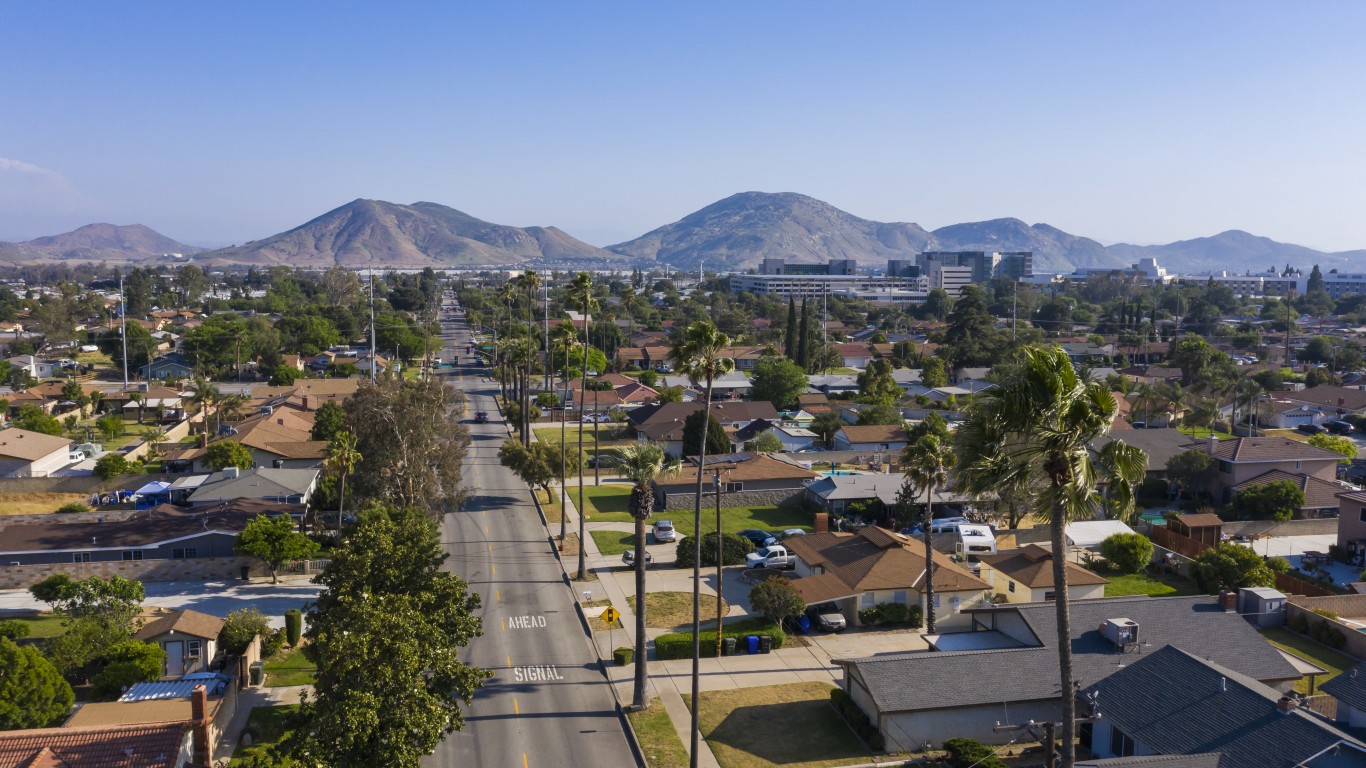
15. Fontana, California
> LawnStarter score: 44.4
> Resident satisfaction with city cleanliness: #21 worst out of 200 cities
> Avg daily PM2.5 (county): 14.8 micrograms per cubic meter
> Population: 210,759
[in-text-ad]
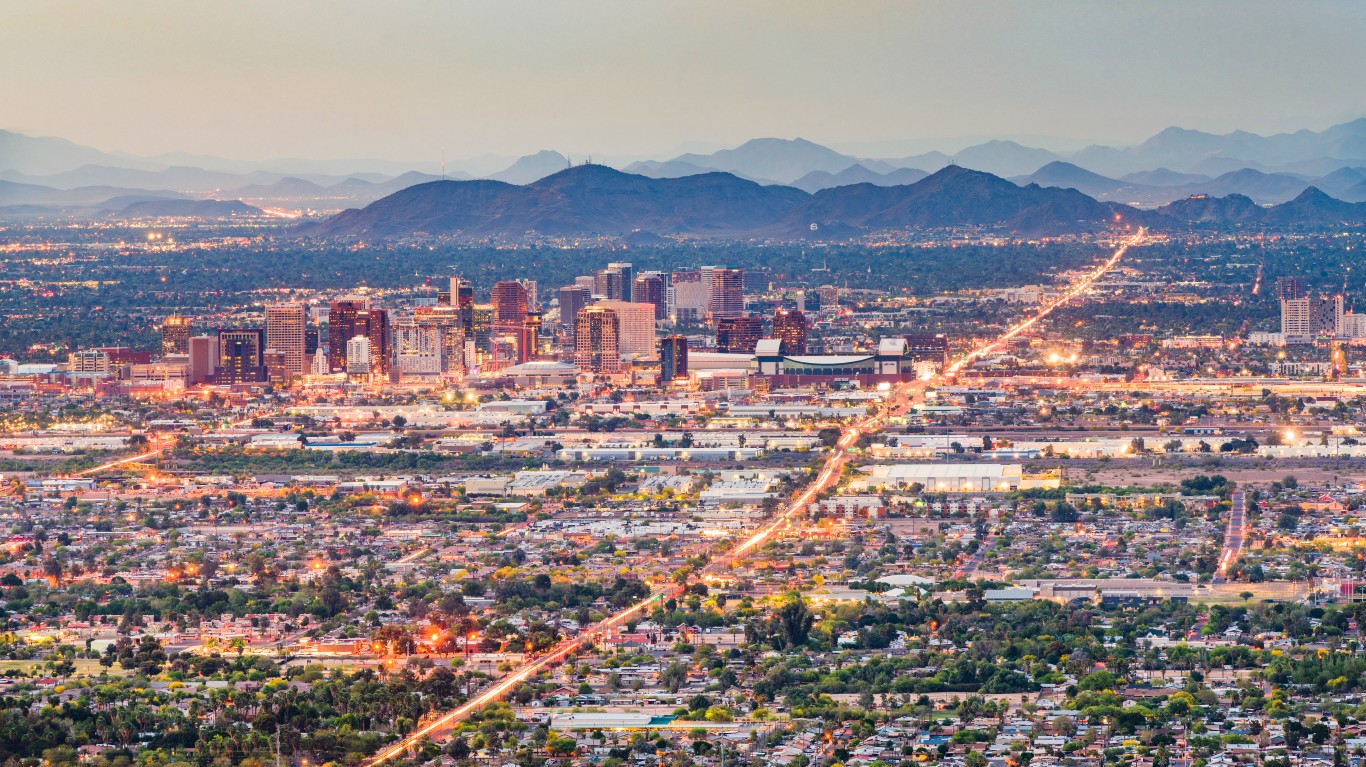
14. Phoenix, Arizona
> LawnStarter score: 44.8
> Resident satisfaction with city cleanliness: #38 worst out of 200 cities
> Avg daily PM2.5 (county): 9.5 micrograms per cubic meter
> Population: 1,633,017
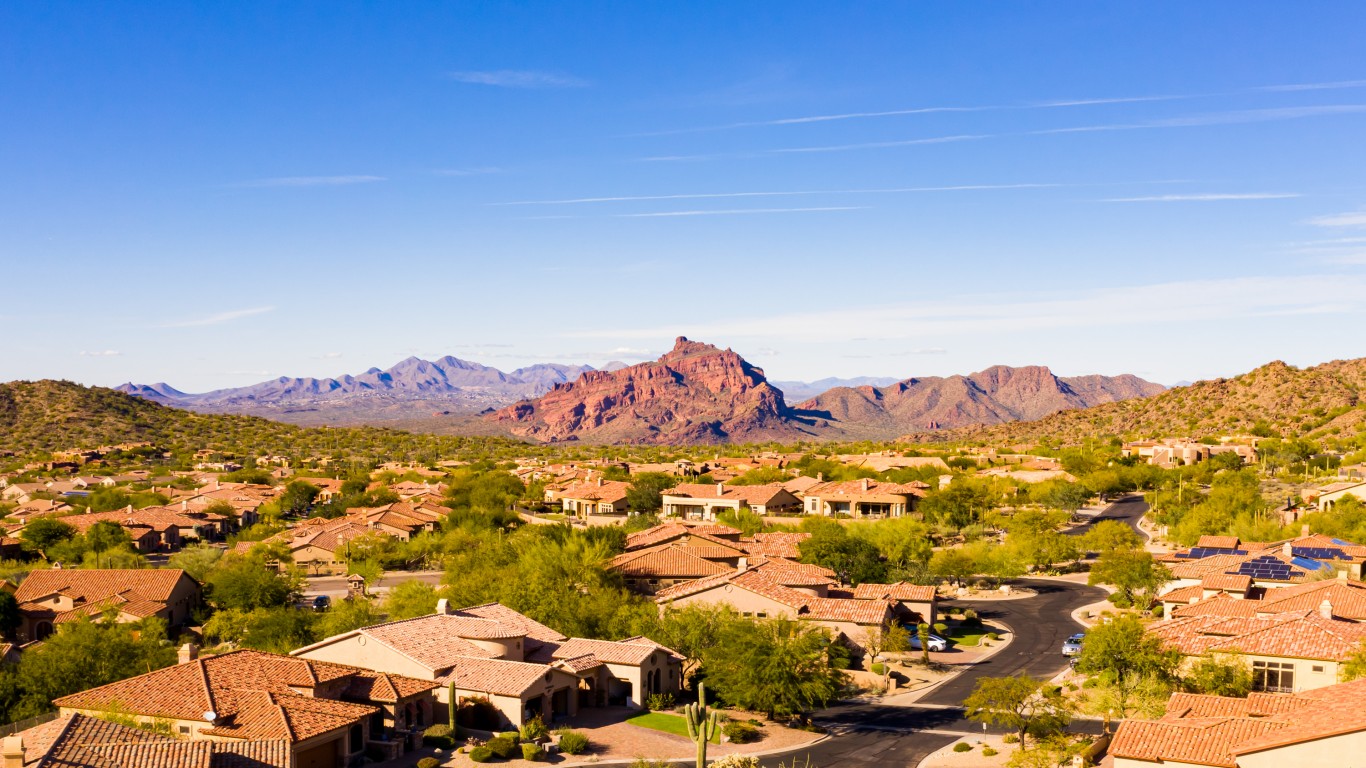
13. Mesa, Arizona
> LawnStarter score: 45
> Resident satisfaction with city cleanliness: #43 worst out of 200 cities
> Avg daily PM2.5 (county): 9.5 micrograms per cubic meter
> Population: 499,720
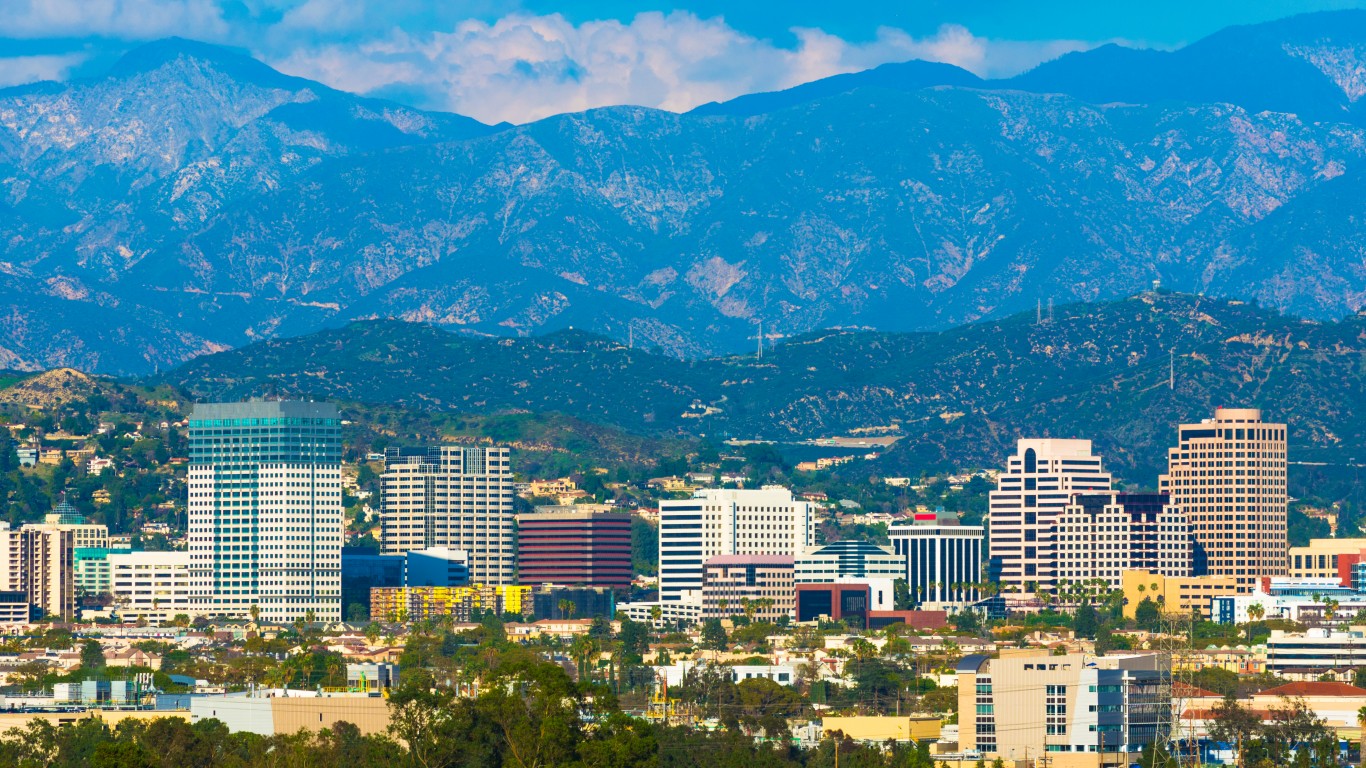
12. Glendale, California
> LawnStarter score: 46.3
> Resident satisfaction with city cleanliness: #78 worst out of 200 cities
> Avg daily PM2.5 (county): 12 micrograms per cubic meter
> Population: 200,232
[in-text-ad-2]
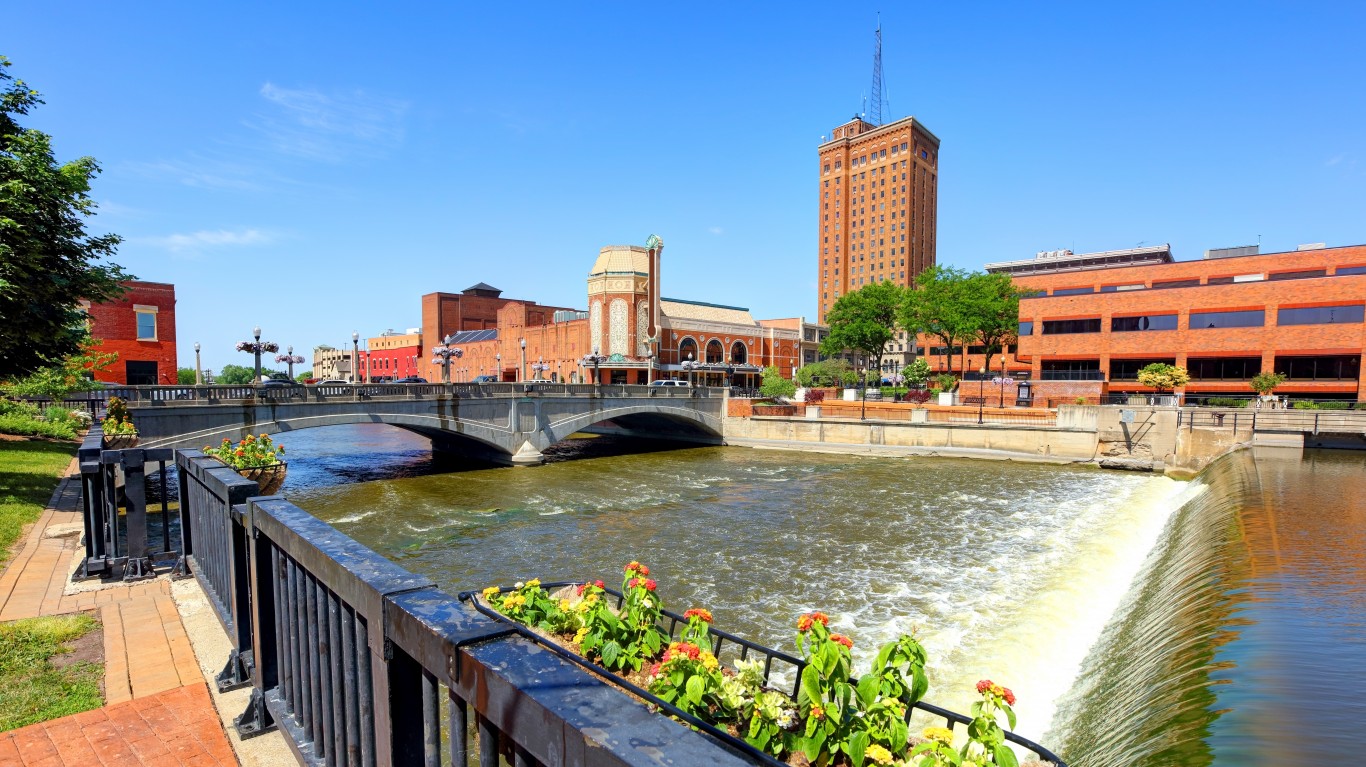
11. Aurora, Illinois
> LawnStarter score: 46.4
> Resident satisfaction with city cleanliness: #52 worst out of 200 cities
> Avg daily PM2.5 (county): 7.8 micrograms per cubic meter
> Population: 199,927
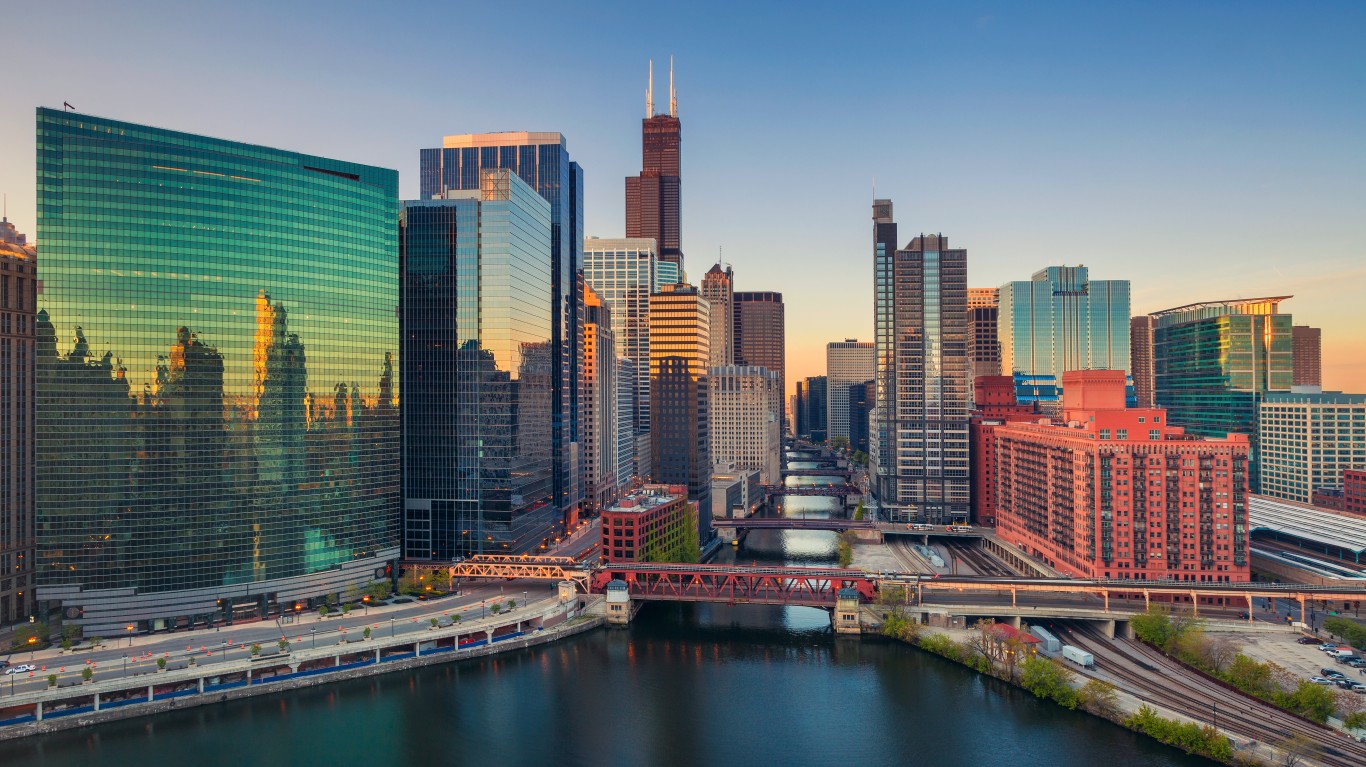
10. Chicago, Illinois
> LawnStarter score: 46.5
> Resident satisfaction with city cleanliness: #63 worst out of 200 cities
> Avg daily PM2.5 (county): 10 micrograms per cubic meter
> Population: 2,709,534
[in-text-ad]
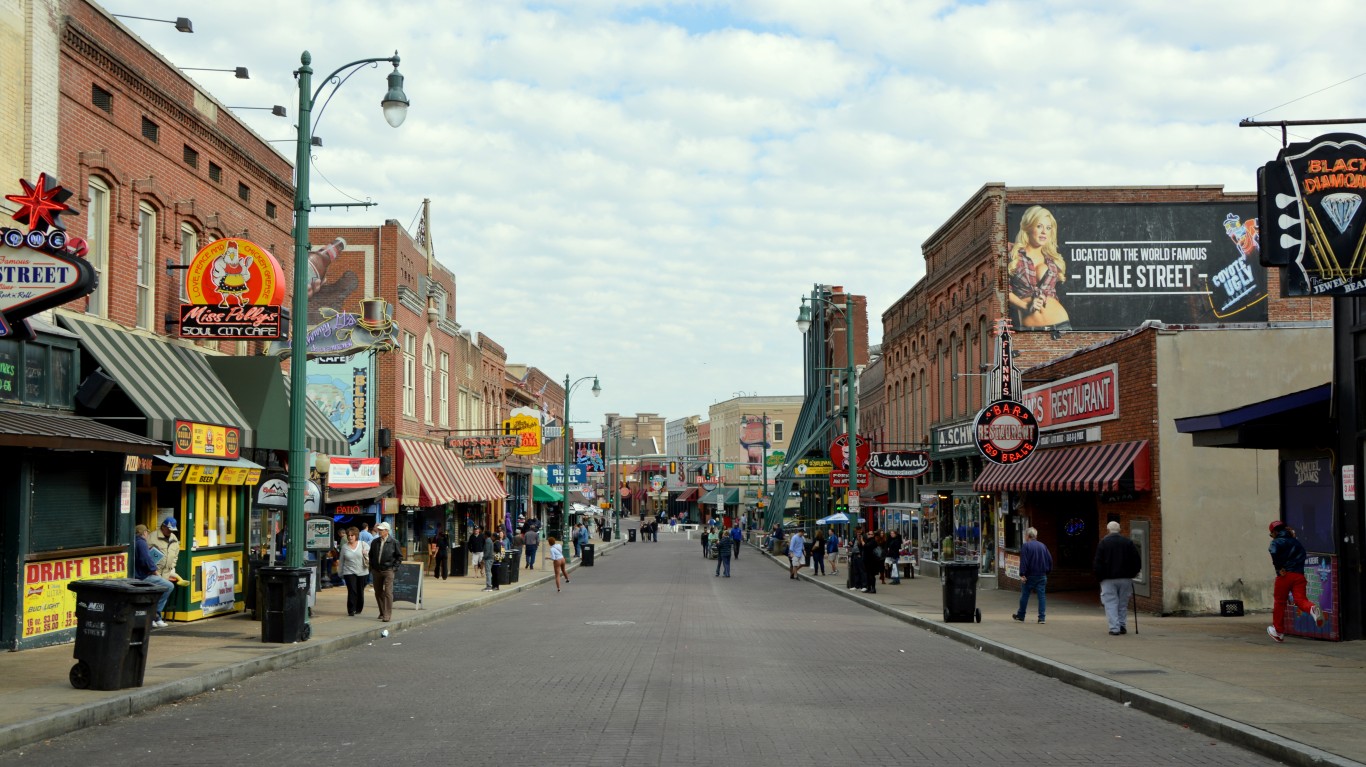
9. Memphis, Tennessee
> LawnStarter score: 46.9
> Resident satisfaction with city cleanliness: #14 worst out of 200 cities
> Avg daily PM2.5 (county): 8.7 micrograms per cubic meter
> Population: 651,932
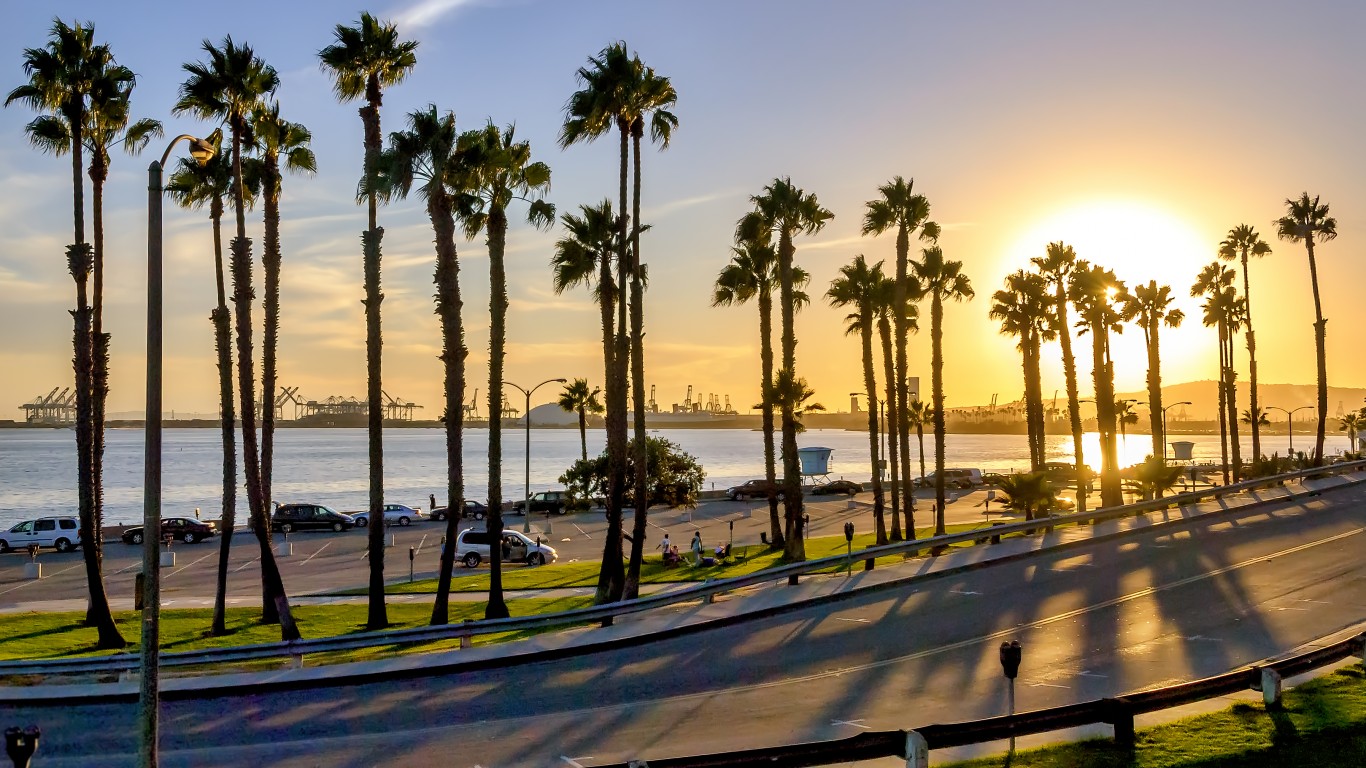
8. Long Beach, California
> LawnStarter score: 48
> Resident satisfaction with city cleanliness: #70 worst out of 200 cities
> Avg daily PM2.5 (county): 12 micrograms per cubic meter
> Population: 466,776
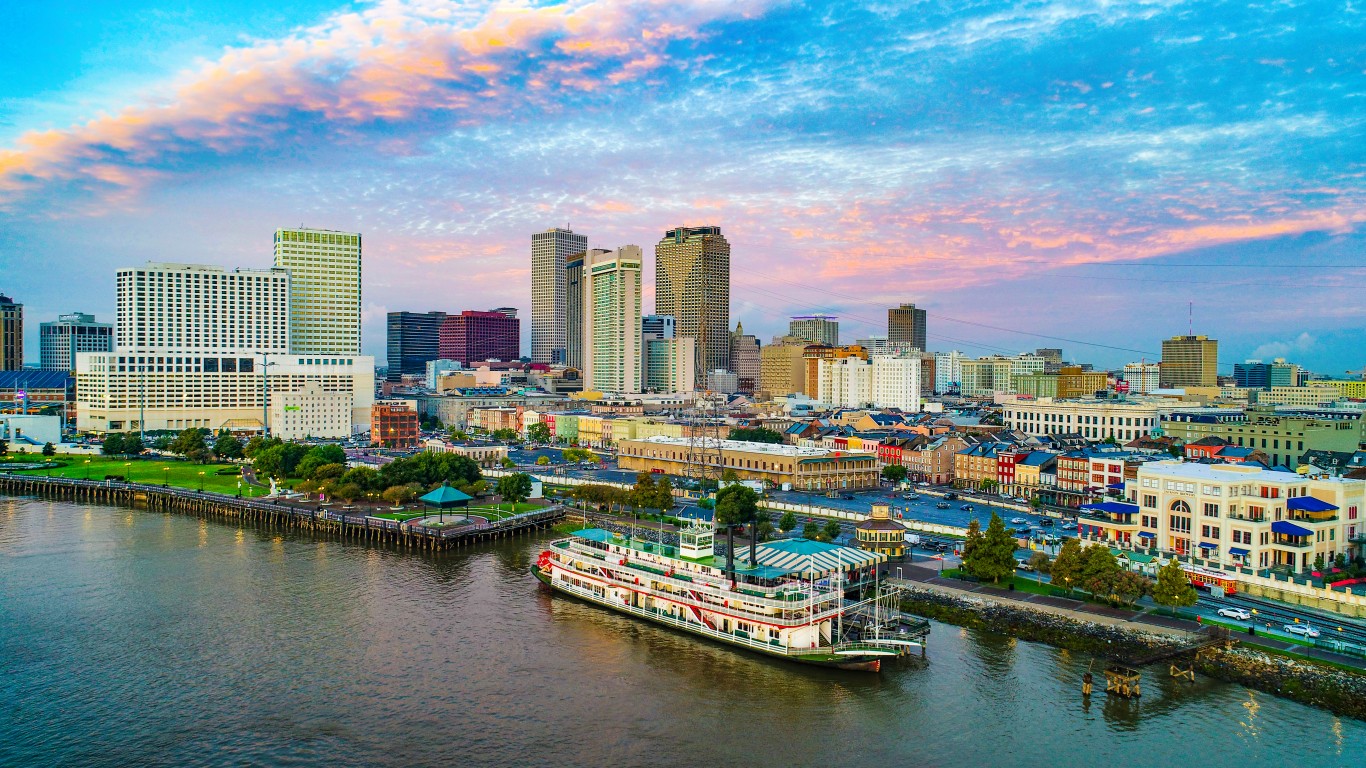
7. New Orleans, Louisiana
> LawnStarter score: 48.4
> Resident satisfaction with city cleanliness: #36 worst out of 200 cities
> Avg daily PM2.5 (county): 7.5 micrograms per cubic meter
> Population: 390,845
[in-text-ad-2]
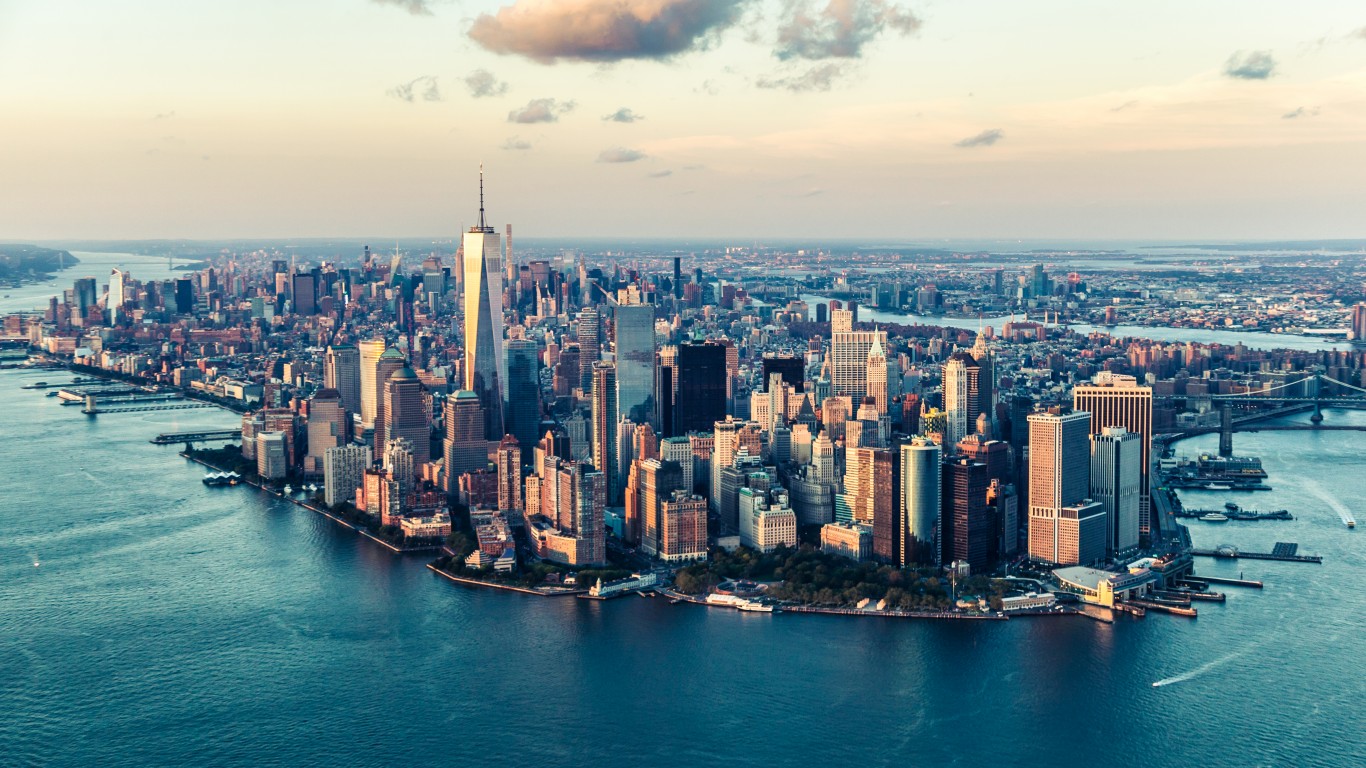
6. New York, New York
> LawnStarter score: 49.2
> Resident satisfaction with city cleanliness: #13 worst out of 200 cities
> Avg daily PM2.5 (county): 9 micrograms per cubic meter
> Population: 8,419,316
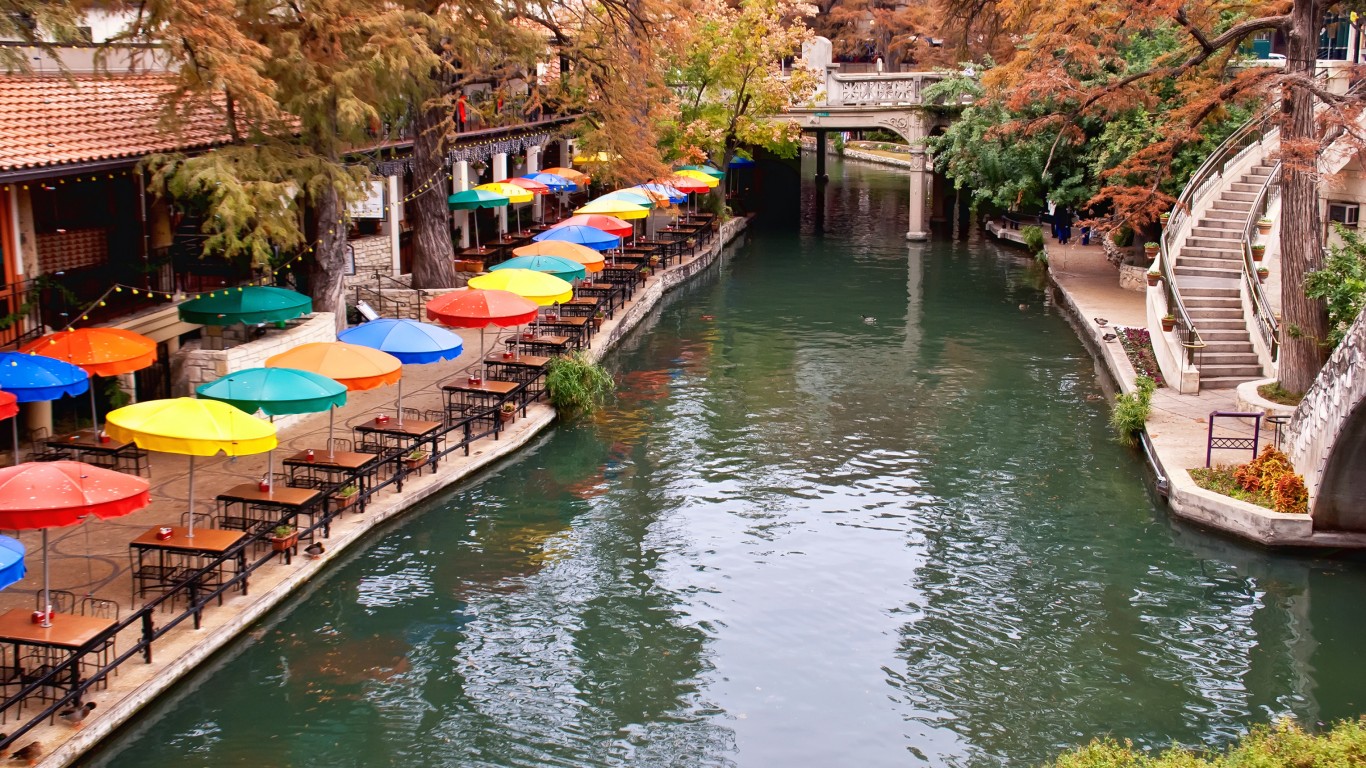
5. San Antonio, Texas
> LawnStarter score: 49.3
> Resident satisfaction with city cleanliness: #34 worst out of 200 cities
> Avg daily PM2.5 (county): 7.3 micrograms per cubic meter
> Population: 1,508,083
[in-text-ad]
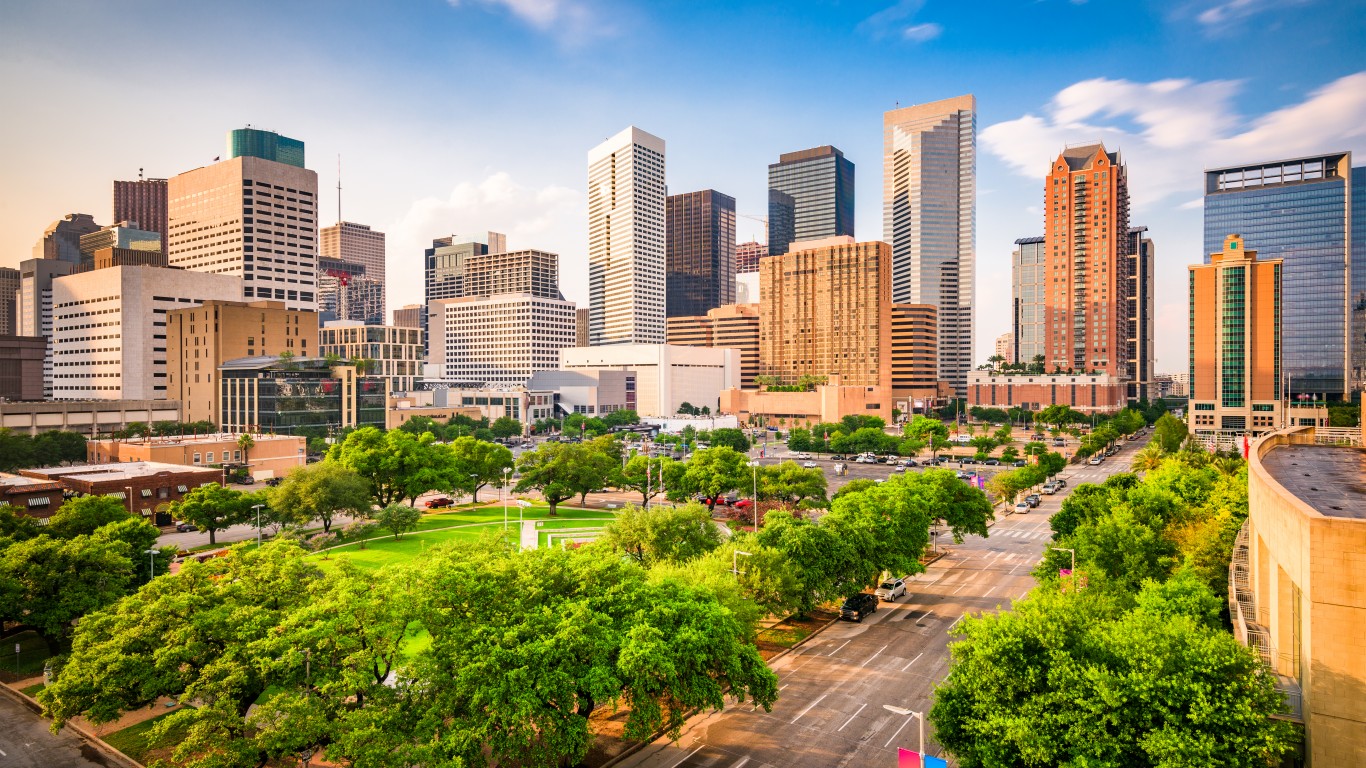
4. Houston, Texas
> LawnStarter score: 50
> Resident satisfaction with city cleanliness: #33 worst out of 200 cities
> Avg daily PM2.5 (county): 10.1 micrograms per cubic meter
> Population: 2,310,432
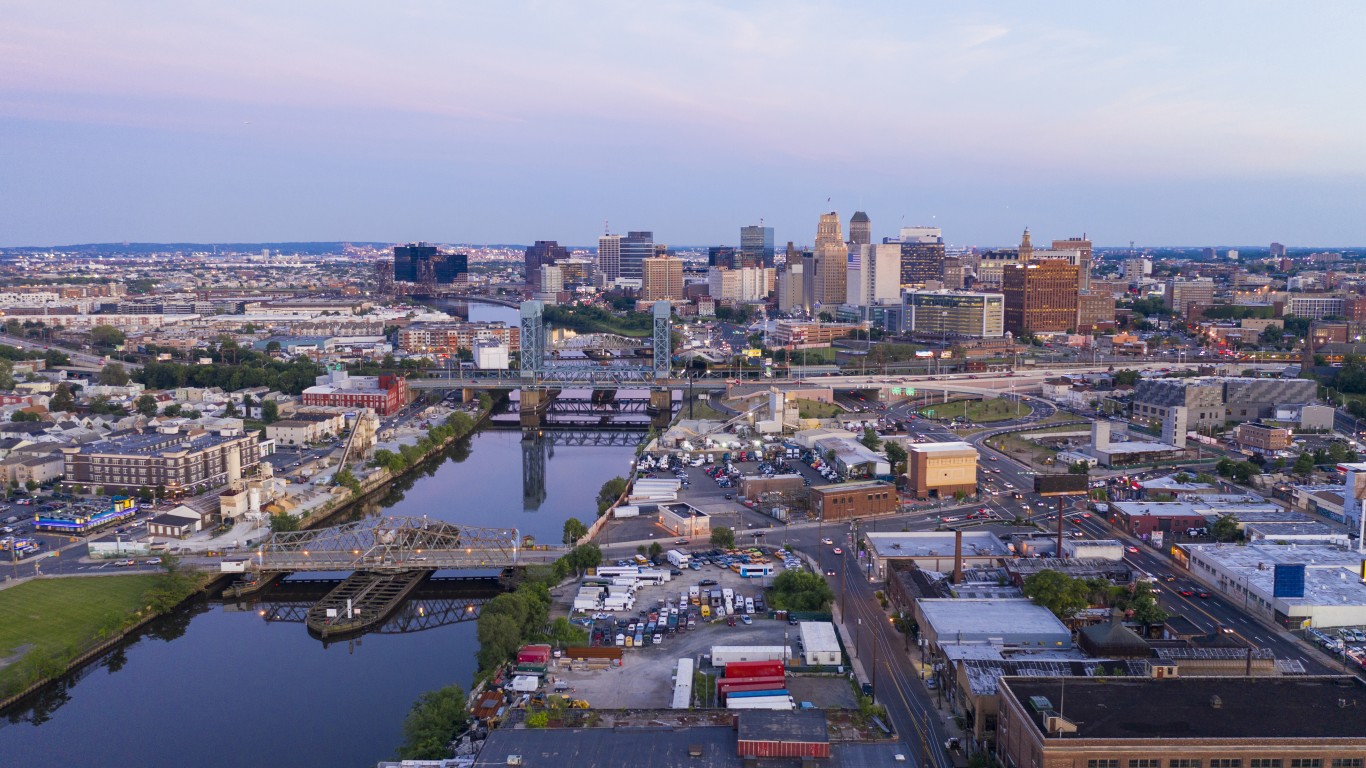
3. Newark, New Jersey
> LawnStarter score: 54.3
> Resident satisfaction with city cleanliness: #2 worst out of 200 cities
> Avg daily PM2.5 (county): 8.9 micrograms per cubic meter
> Population: 281,054
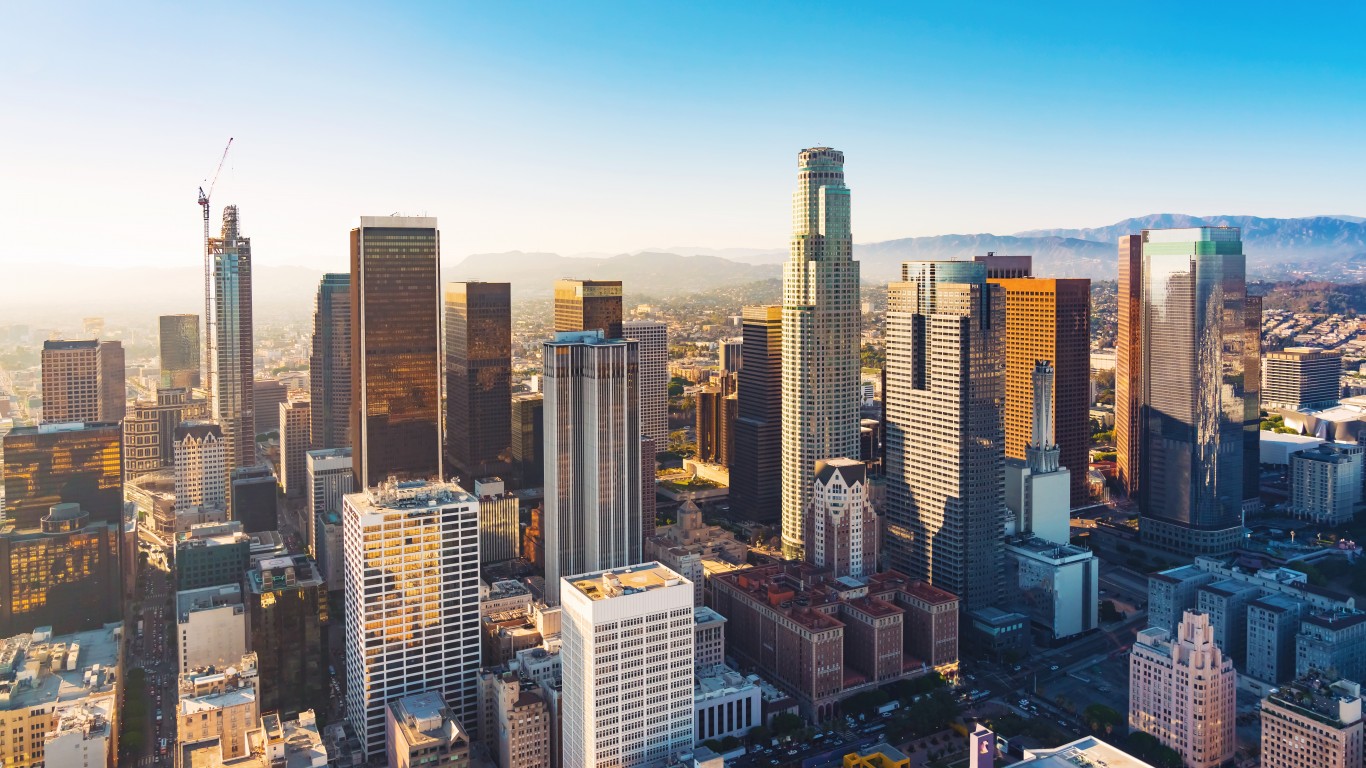
2. Los Angeles, California
> LawnStarter score: 54.7
> Resident satisfaction with city cleanliness: #12 worst out of 200 cities
> Avg daily PM2.5 (county): 12 micrograms per cubic meter
> Population: 3,966,936
[in-text-ad-2]
1. Palmdale, California
> LawnStarter score: 55.3
> Resident satisfaction with city cleanliness: #7 worst out of 200 cities
> Avg daily PM2.5 (county): 12.0 micrograms per cubic meter
> Population: 156,293
It’s Your Money, Your Future—Own It (sponsor)
Are you ahead, or behind on retirement? For families with more than $500,000 saved for retirement, finding a financial advisor who puts your interest first can be the difference, and today it’s easier than ever. SmartAsset’s free tool matches you with up to three fiduciary financial advisors who serve your area in minutes. Each advisor has been carefully vetted and must act in your best interests. Start your search now.
If you’ve saved and built a substantial nest egg for you and your family, don’t delay; get started right here and help your retirement dreams become a retirement reality.
Thank you for reading! Have some feedback for us?
Contact the 24/7 Wall St. editorial team.
 24/7 Wall St.
 24/7 Wall St.
 24/7 Wall St.
 24/7 Wall St.