Special Report
States Where It's Most Difficult to Get Welfare - Even If You Need It
Published:

The Temporary Assistance for Needy Families program replaced in 1997 the Aid to Families with Dependent Children program as the nation’s core welfare program. At the time, the reason was that AFDC was not reducing poverty. But according to the nonpartisan research institute Center on Budget and Policy Priorities, the changes have resulted in even less families in poverty receiving assistance.
While the federal government set a two-year time limit for the receipt of welfare payments and added work requirements, other nationwide standards went by the wayside. States were given block grants and allowed to run their welfare programs on their own terms, with little federal oversight.
With a new emphasis on reducing the number of out-of-wedlock children and incentivizing work for parents, there has been a de-emphasis on cash payments, necessary for food, rent, clothing, utilities, health care, diapers, and other essentials for a home where children are being raised. States have enacted harsh eligibility rules for cash payments and, in many cases, are misspending their block grants for non-poverty related purposes.
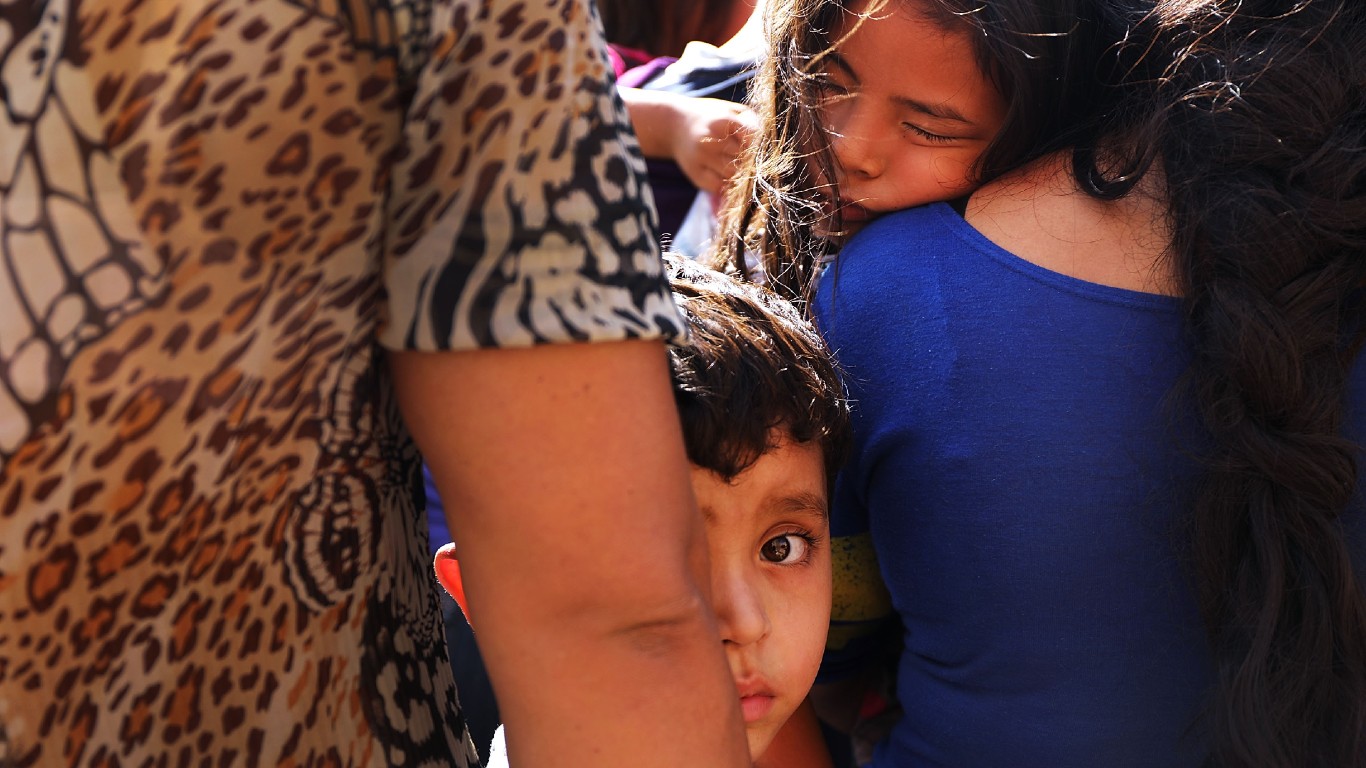
Only 21 out of 100 poor families received cash payments from TANF in 2020, down from 68 out of 100 in 1996, the last year of the AFDC program. And the amount of available cash is getting lower in practical terms, as the investment in the block grant program has not changed in its 25-year history, during which time it has lost 40% of its value. (This is the city where most people live below the poverty line in every state.)
Moreover, today, far fewer children in poor families than at any time in modern history are likely to be receiving help to meet minimal basic needs. According to a recent study, in 1995, 2.8 million children were taken out of deep poverty – defined as family incomes 50% lower than the poverty level – while in 2017, only 260,000 children were. Black children receive the least help, as black populations tend to be larger in the states with the most miserly TANF programs.
To determine the states where welfare supports the fewest families, 24/7 Wall St. reviewed data on TANF benefits recipiency and poverty from the nonpartisan research institute Center on Budget and Policy Priorities. States were ranked based on the number of families receiving TANF benefits for every 100 families with income below the poverty line – the TANF-to-poverty ratio.
As measured by the TANF-to-poverty ratio, the number of families receiving TANF assistance out of every 100 families living in poverty ranges from a meager 3.5 for every 100 poor families in the lowest state to 71.3 for every 100 poor families in the highest state. In 1996, no state had a TANF-to-poverty ratio of less than 10. In 2016, three states did, and by 2020, there were 14 states where less than 10% of poor families were receiving TANF cash grants.
It is impossible to measure the long-term impacts of the nation’s failure to rescue children from poverty and protect them against future poverty, but they are certainly significant. Studies show that the level of cash assistance to families with children has a direct correlation with higher brain function and social skills in children. (These are the ZIP codes with the highest poverty rates in the nation.)
These are the states where it’s most difficult to get welfare – even if you need it
Click here to read our detailed methodology
50. Vermont
> Families receiving TANF benefits: 71.3 for every 100 poor families
> Family poverty rate: 6.4% (8th lowest)
> Median family income: $83,023 (19th highest)
> Max. monthly benefit for single-parent family of three: $699 (10th highest)
> State TANF spending allocated to basic cash assistance: 13.9% (22nd lowest)
[in-text-ad]
49. California
> Families receiving TANF benefits: 70.9 for every 100 poor families
> Family poverty rate: 9.0% (19th highest)
> Median family income: $89,798 (12th highest)
> Max. monthly benefit for single-parent family of three: $878 (3rd highest)
> State TANF spending allocated to basic cash assistance: 38.8% (6th highest)
48. Minnesota
> Families receiving TANF benefits: 60.1 for every 100 poor families
> Family poverty rate: 5.6% (2nd lowest)
> Median family income: $92,692 (9th highest)
> Max. monthly benefit for single-parent family of three: $632 (13th highest)
> State TANF spending allocated to basic cash assistance: 16.4% (25th highest)
47. Oregon
> Families receiving TANF benefits: 48.6 for every 100 poor families
> Family poverty rate: 7.8% (24th lowest)
> Median family income: $80,630 (23rd highest)
> Max. monthly benefit for single-parent family of three: $506 (24th highest)
> State TANF spending allocated to basic cash assistance: 34.0% (8th highest)
[in-text-ad-2]

46. New Hampshire
> Families receiving TANF benefits: 45.9 for every 100 poor families
> Family poverty rate: 4.6% (the lowest)
> Median family income: $97,001 (6th highest)
> Max. monthly benefit for single-parent family of three: $1,098 (the highest)
> State TANF spending allocated to basic cash assistance: 42.5% (4th highest)
45. Massachusetts
> Families receiving TANF benefits: 42.8 for every 100 poor families
> Family poverty rate: 6.6% (11th lowest)
> Median family income: $106,526 (the highest)
> Max. monthly benefit for single-parent family of three: $712 (8th highest)
> State TANF spending allocated to basic cash assistance: 20.9% (19th highest)
[in-text-ad]
44. Washington
> Families receiving TANF benefits: 39.0 for every 100 poor families
> Family poverty rate: 6.5% (9th lowest)
> Median family income: $92,422 (11th highest)
> Max. monthly benefit for single-parent family of three: $654 (11th highest)
> State TANF spending allocated to basic cash assistance: 13.2% (20th lowest)
43. New York
> Families receiving TANF benefits: 38.8 for every 100 poor families
> Family poverty rate: 10.0% (14th highest)
> Median family income: $87,270 (14th highest)
> Max. monthly benefit for single-parent family of three: $789 (4th highest)
> State TANF spending allocated to basic cash assistance: 28.0% (13th highest)

42. Delaware
> Families receiving TANF benefits: 35.0 for every 100 poor families
> Family poverty rate: 7.7% (22nd lowest)
> Median family income: $84,825 (17th highest)
> Max. monthly benefit for single-parent family of three: $338 (16th lowest)
> State TANF spending allocated to basic cash assistance: 9.1% (13th lowest)
[in-text-ad-2]

41. Hawaii
> Families receiving TANF benefits: 34.0 for every 100 poor families
> Family poverty rate: 6.3% (7th lowest)
> Median family income: $97,813 (5th highest)
> Max. monthly benefit for single-parent family of three: $610 (16th highest)
> State TANF spending allocated to basic cash assistance: 17.5% (24th highest)

40. Maryland
> Families receiving TANF benefits: 28.8 for every 100 poor families
> Family poverty rate: 5.9% (3rd lowest)
> Median family income: $105,790 (2nd highest)
> Max. monthly benefit for single-parent family of three: $727 (5th highest)
> State TANF spending allocated to basic cash assistance: 28.1% (12th highest)
[in-text-ad]
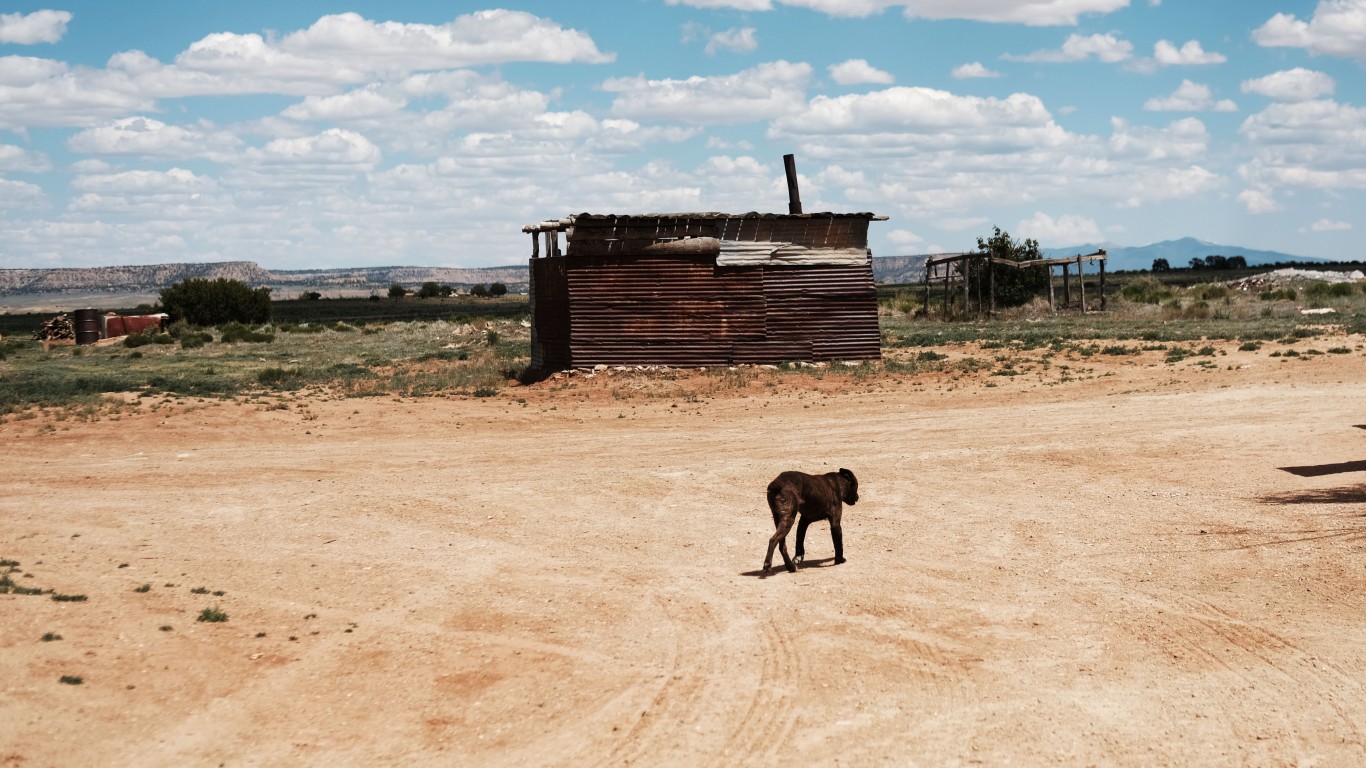
39. New Mexico
> Families receiving TANF benefits: 26.7 for every 100 poor families
> Family poverty rate: 14.2% (2nd highest)
> Median family income: $62,611 (4th lowest)
> Max. monthly benefit for single-parent family of three: $447 (22nd lowest)
> State TANF spending allocated to basic cash assistance: 22.5% (17th highest)
38. Rhode Island
> Families receiving TANF benefits: 26.1 for every 100 poor families
> Family poverty rate: 7.8% (24th lowest)
> Median family income: $89,330 (13th highest)
> Max. monthly benefit for single-parent family of three: $721 (7th highest)
> State TANF spending allocated to basic cash assistance: 14.0% (23rd lowest)
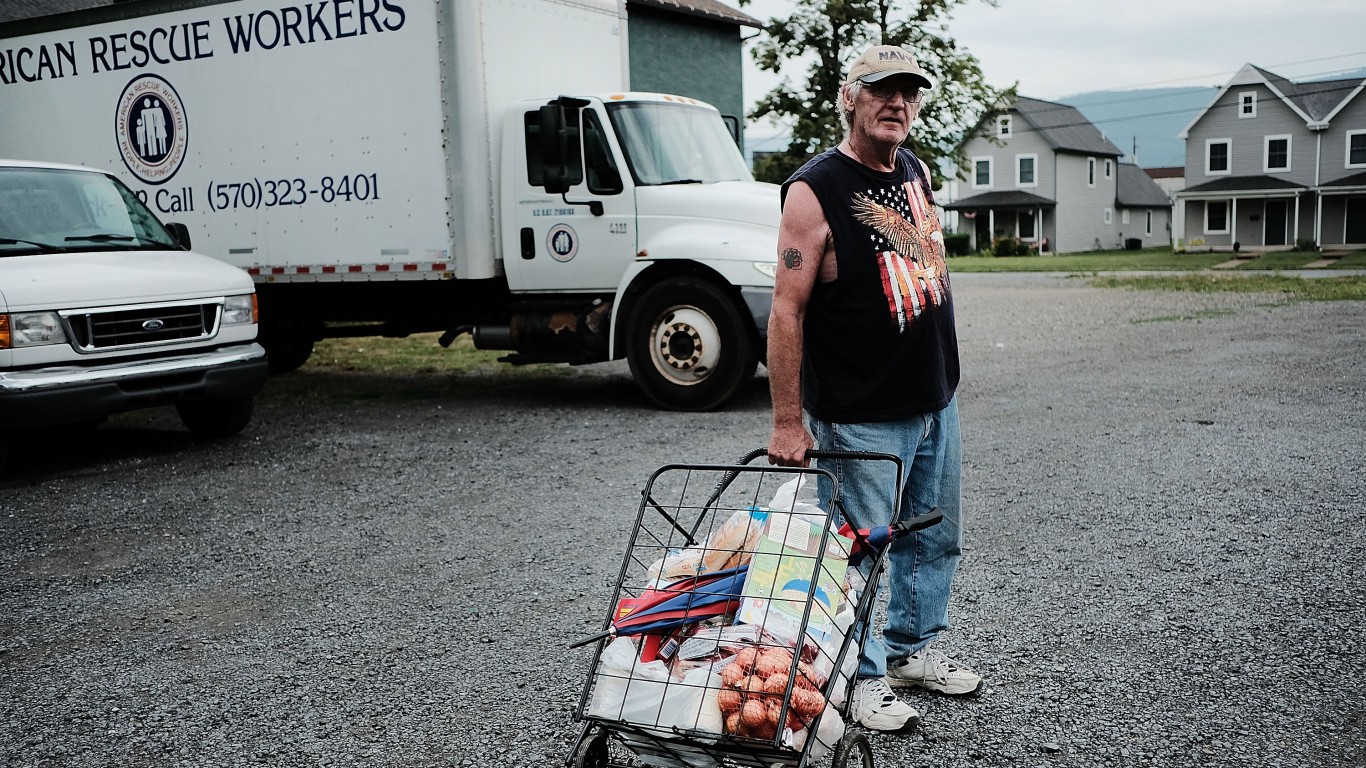
37. Pennsylvania
> Families receiving TANF benefits: 25.2 for every 100 poor families
> Family poverty rate: 8.1% (24th highest)
> Median family income: $80,996 (21st highest)
> Max. monthly benefit for single-parent family of three: $403 (19th lowest)
> State TANF spending allocated to basic cash assistance: 11.5% (17th lowest)
[in-text-ad-2]
36. Ohio
> Families receiving TANF benefits: 24.8 for every 100 poor families
> Family poverty rate: 9.6% (16th highest)
> Median family income: $74,391 (20th lowest)
> Max. monthly benefit for single-parent family of three: $512 (22nd highest)
> State TANF spending allocated to basic cash assistance: 20.7% (20th highest)

35. Montana
> Families receiving TANF benefits: 23.1 for every 100 poor families
> Family poverty rate: 7.7% (22nd lowest)
> Median family income: $72,773 (14th lowest)
> Max. monthly benefit for single-parent family of three: $588 (17th highest)
> State TANF spending allocated to basic cash assistance: 36.0% (7th highest)
[in-text-ad]
34. Iowa
> Families receiving TANF benefits: 22.7 for every 100 poor families
> Family poverty rate: 7.1% (19th lowest)
> Median family income: $79,186 (25th highest)
> Max. monthly benefit for single-parent family of three: $426 (20th lowest)
> State TANF spending allocated to basic cash assistance: 15.9% (25th lowest)
33. Maine
> Families receiving TANF benefits: 22.0 for every 100 poor families
> Family poverty rate: 6.7% (14th lowest)
> Median family income: $76,192 (23rd lowest)
> Max. monthly benefit for single-parent family of three: $620 (15th highest)
> State TANF spending allocated to basic cash assistance: 29.4% (10th highest)

32. Connecticut
> Families receiving TANF benefits: 21.9 for every 100 poor families
> Family poverty rate: 6.7% (14th lowest)
> Median family income: $102,061 (4th highest)
> Max. monthly benefit for single-parent family of three: $709 (9th highest)
> State TANF spending allocated to basic cash assistance: 7.2% (9th lowest)
[in-text-ad-2]
31. Kentucky
> Families receiving TANF benefits: 20.6 for every 100 poor families
> Family poverty rate: 12.3% (4th highest)
> Median family income: $65,893 (6th lowest)
> Max. monthly benefit for single-parent family of three: $262 (5th lowest)
> State TANF spending allocated to basic cash assistance: 68.3% (the highest)
30. Wisconsin
> Families receiving TANF benefits: 20.2 for every 100 poor families
> Family poverty rate: 6.8% (16th lowest)
> Median family income: $80,844 (22nd highest)
> Max. monthly benefit for single-parent family of three: $653 (12th highest)
> State TANF spending allocated to basic cash assistance: 13.0% (19th lowest)
[in-text-ad]
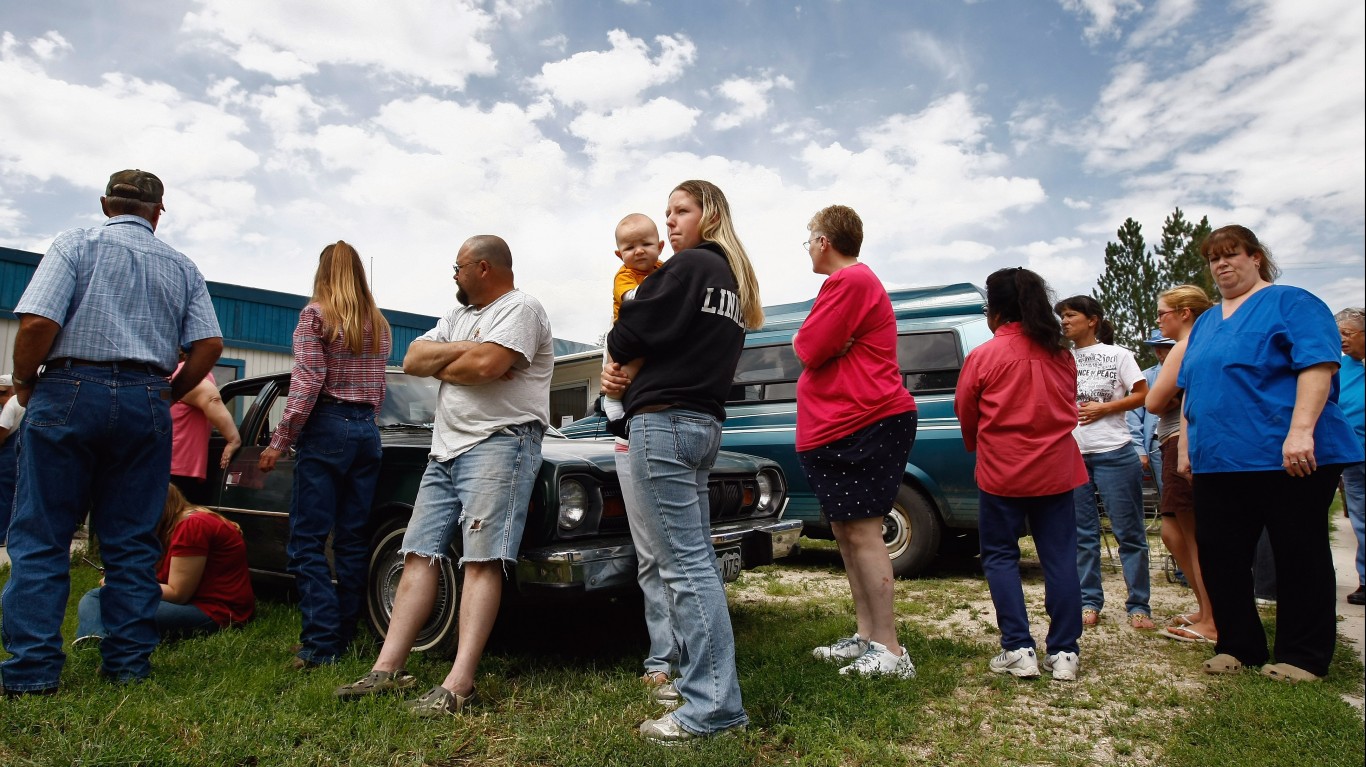
29. Colorado
> Families receiving TANF benefits: 19.9 for every 100 poor families
> Family poverty rate: 6.1% (4th lowest)
> Median family income: $92,752 (8th highest)
> Max. monthly benefit for single-parent family of three: $508 (23rd highest)
> State TANF spending allocated to basic cash assistance: 17.8% (23rd highest)

28. Nebraska
> Families receiving TANF benefits: 19.7 for every 100 poor families
> Family poverty rate: 6.6% (11th lowest)
> Median family income: $80,125 (24th highest)
> Max. monthly benefit for single-parent family of three: $485 (23rd lowest)
> State TANF spending allocated to basic cash assistance: 27.3% (15th highest)
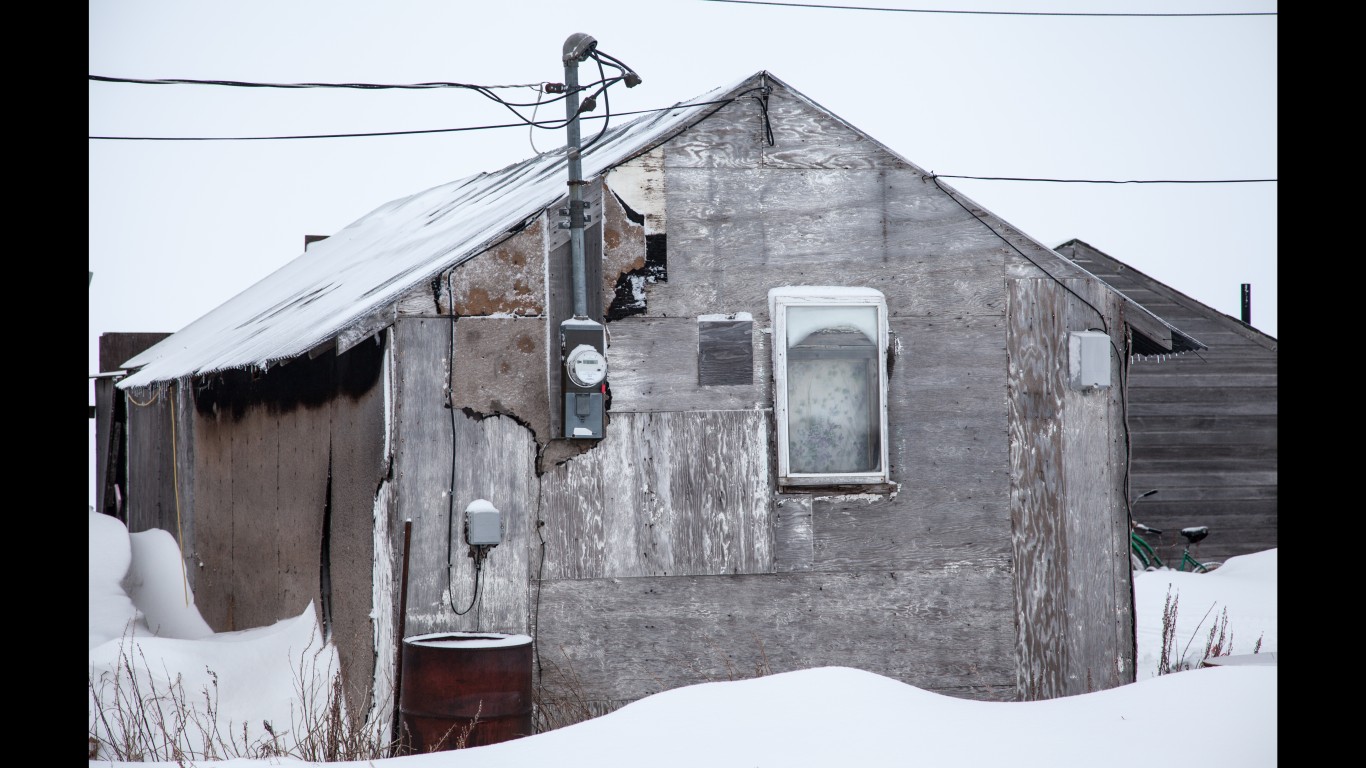
27. Alaska
> Families receiving TANF benefits: 19.5 for every 100 poor families
> Family poverty rate: 7.0% (18th lowest)
> Median family income: $92,648 (10th highest)
> Max. monthly benefit for single-parent family of three: $923 (2nd highest)
> State TANF spending allocated to basic cash assistance: 49.7% (2nd highest)
[in-text-ad-2]
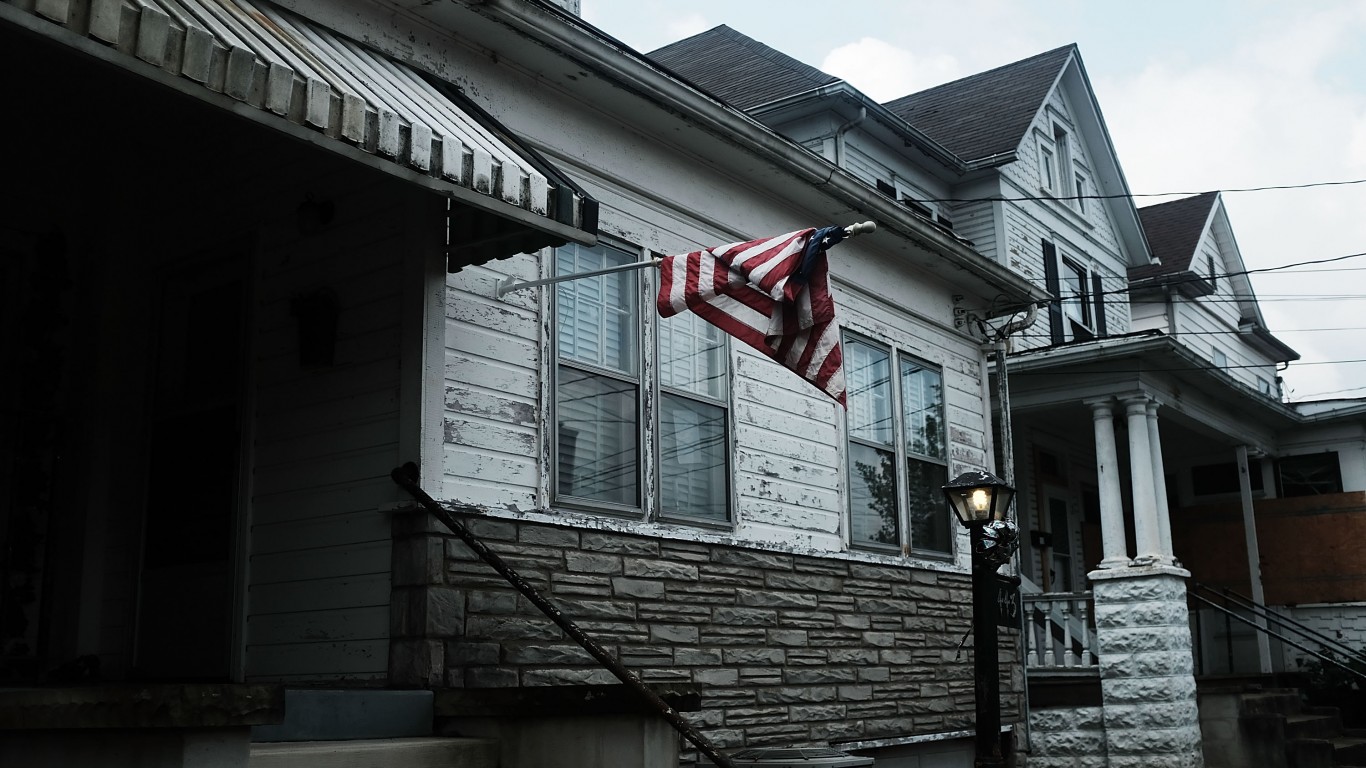
26. West Virginia
> Families receiving TANF benefits: 19.2 for every 100 poor families
> Family poverty rate: 12.3% (4th highest)
> Median family income: $61,707 (2nd lowest)
> Max. monthly benefit for single-parent family of three: $542 (21st highest)
> State TANF spending allocated to basic cash assistance: 27.8% (14th highest)

25. Virginia
> Families receiving TANF benefits: 18.1 for every 100 poor families
> Family poverty rate: 6.8% (16th lowest)
> Median family income: $93,284 (7th highest)
> Max. monthly benefit for single-parent family of three: $559 (18th highest)
> State TANF spending allocated to basic cash assistance: 21.9% (18th highest)
[in-text-ad]
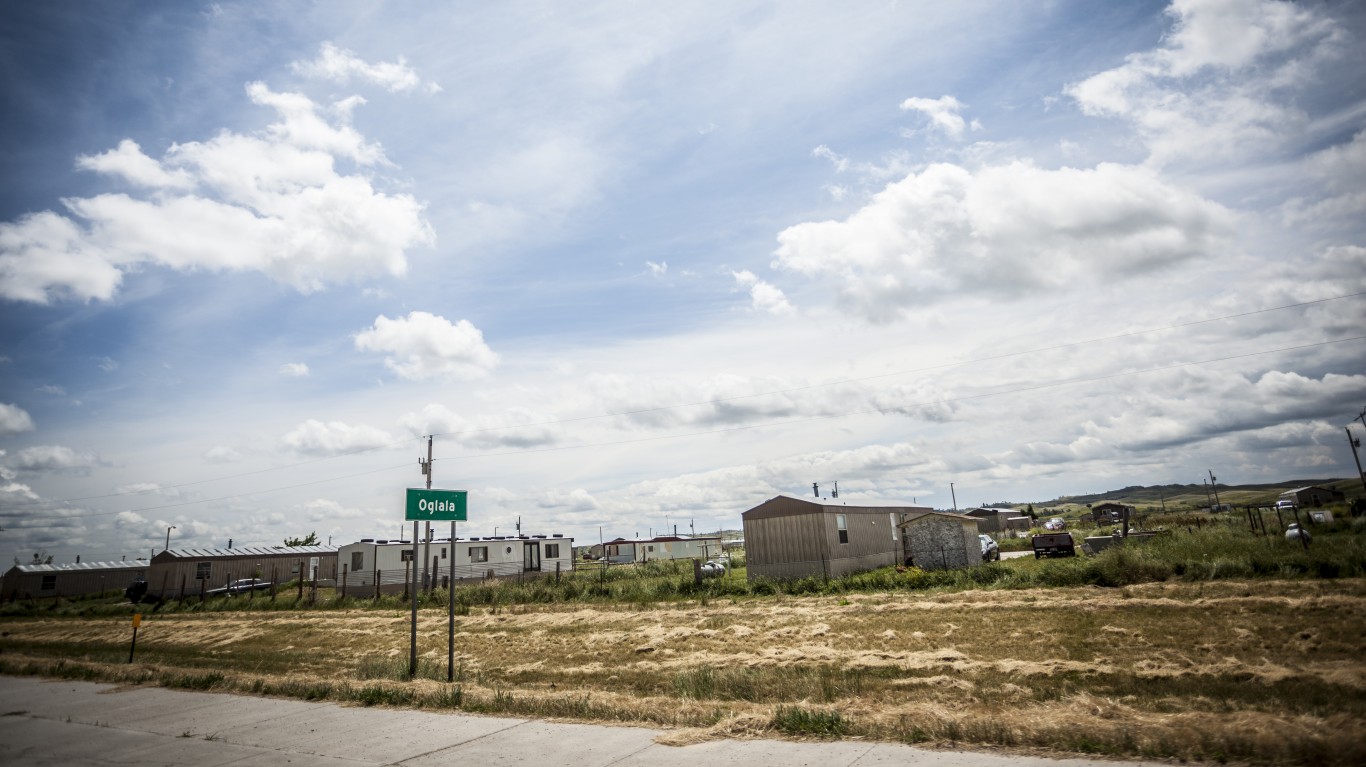
24. South Dakota
> Families receiving TANF benefits: 18.1 for every 100 poor families
> Family poverty rate: 8.0% (25th lowest)
> Median family income: $77,042 (24th lowest)
> Max. monthly benefit for single-parent family of three: $630 (14th highest)
> State TANF spending allocated to basic cash assistance: 45.0% (3rd highest)

23. Nevada
> Families receiving TANF benefits: 17.7 for every 100 poor families
> Family poverty rate: 9.0% (19th highest)
> Median family income: $74,077 (18th lowest)
> Max. monthly benefit for single-parent family of three: $386 (17th lowest)
> State TANF spending allocated to basic cash assistance: 29.0% (11th highest)
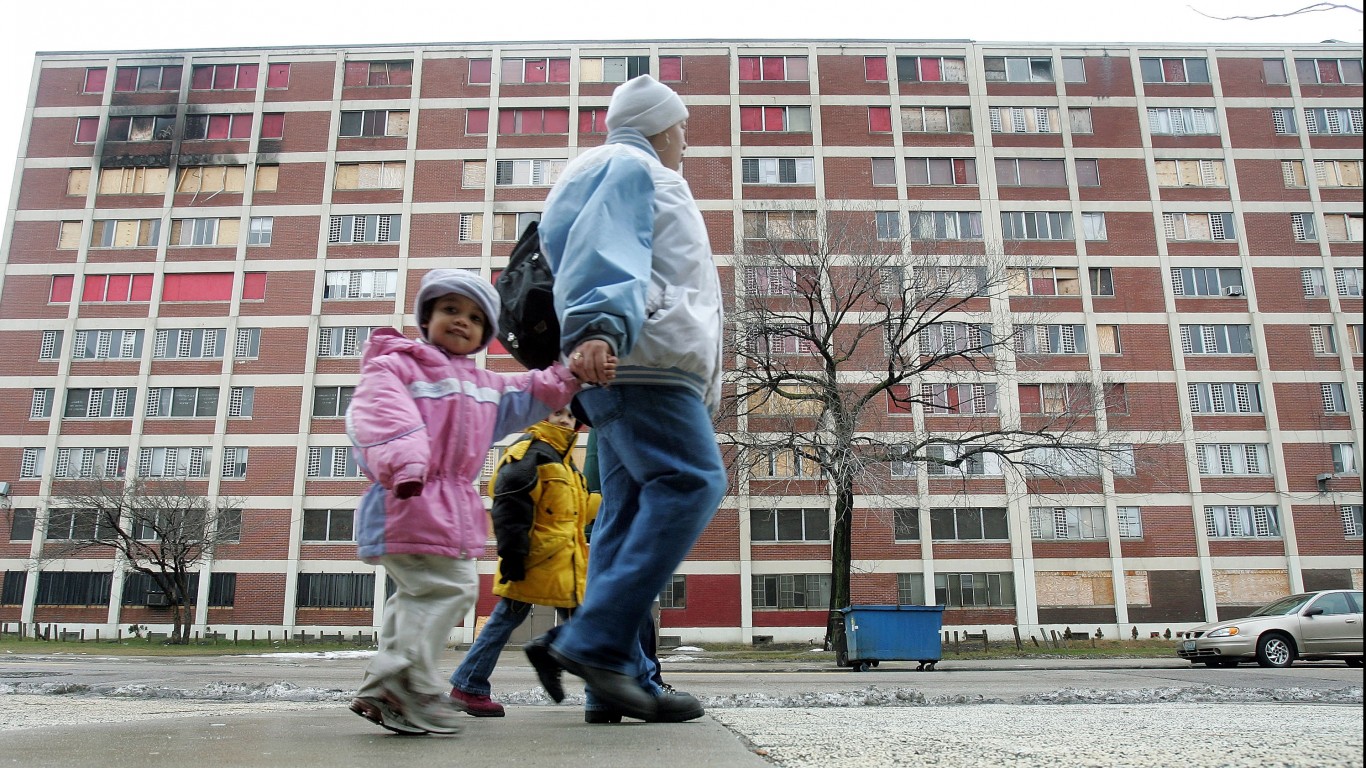
22. Illinois
> Families receiving TANF benefits: 16.2 for every 100 poor families
> Family poverty rate: 8.4% (23rd highest)
> Median family income: $86,251 (16th highest)
> Max. monthly benefit for single-parent family of three: $543 (20th highest)
> State TANF spending allocated to basic cash assistance: 4.4% (the lowest)
[in-text-ad-2]

21. New Jersey
> Families receiving TANF benefits: 15.9 for every 100 poor families
> Family poverty rate: 7.0% (18th lowest)
> Median family income: $104,804 (3rd highest)
> Max. monthly benefit for single-parent family of three: $559 (18th highest)
> State TANF spending allocated to basic cash assistance: 5.5% (6th lowest)
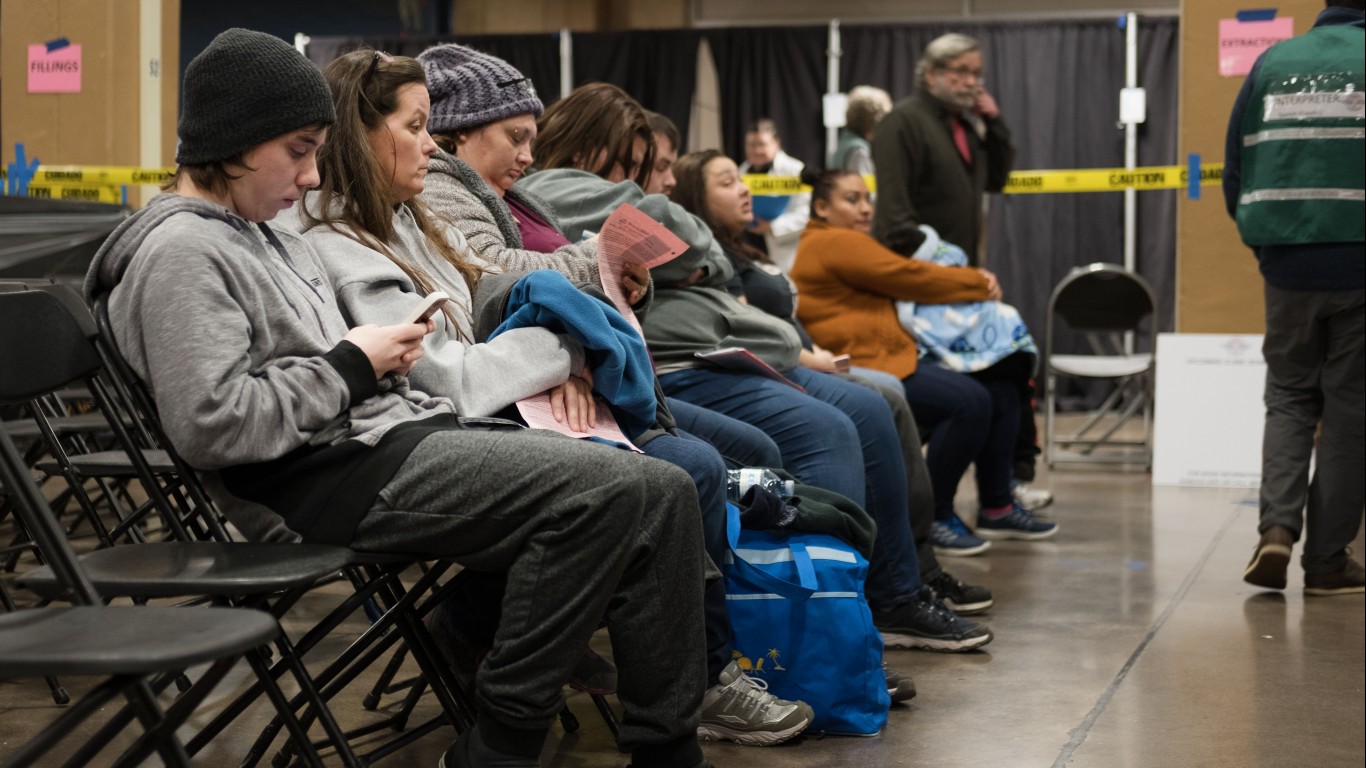
20. Tennessee
> Families receiving TANF benefits: 15.2 for every 100 poor families
> Family poverty rate: 10.6% (10th highest)
> Median family income: $68,793 (9th lowest)
> Max. monthly benefit for single-parent family of three: $387 (18th lowest)
> State TANF spending allocated to basic cash assistance: 10.6% (16th lowest)
[in-text-ad]
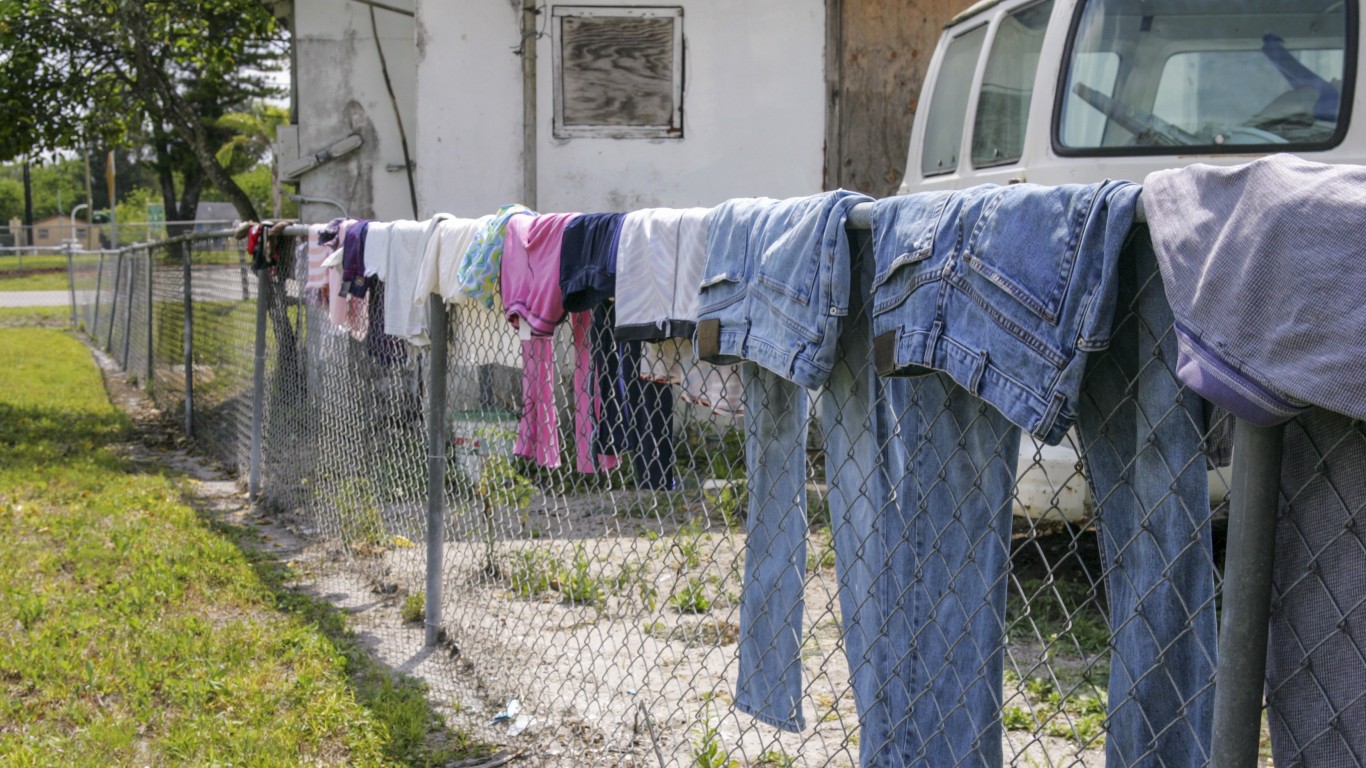
19. Florida
> Families receiving TANF benefits: 13.0 for every 100 poor families
> Family poverty rate: 9.4% (17th highest)
> Median family income: $69,670 (11th lowest)
> Max. monthly benefit for single-parent family of three: $303 (12th lowest)
> State TANF spending allocated to basic cash assistance: 14.1% (24th lowest)
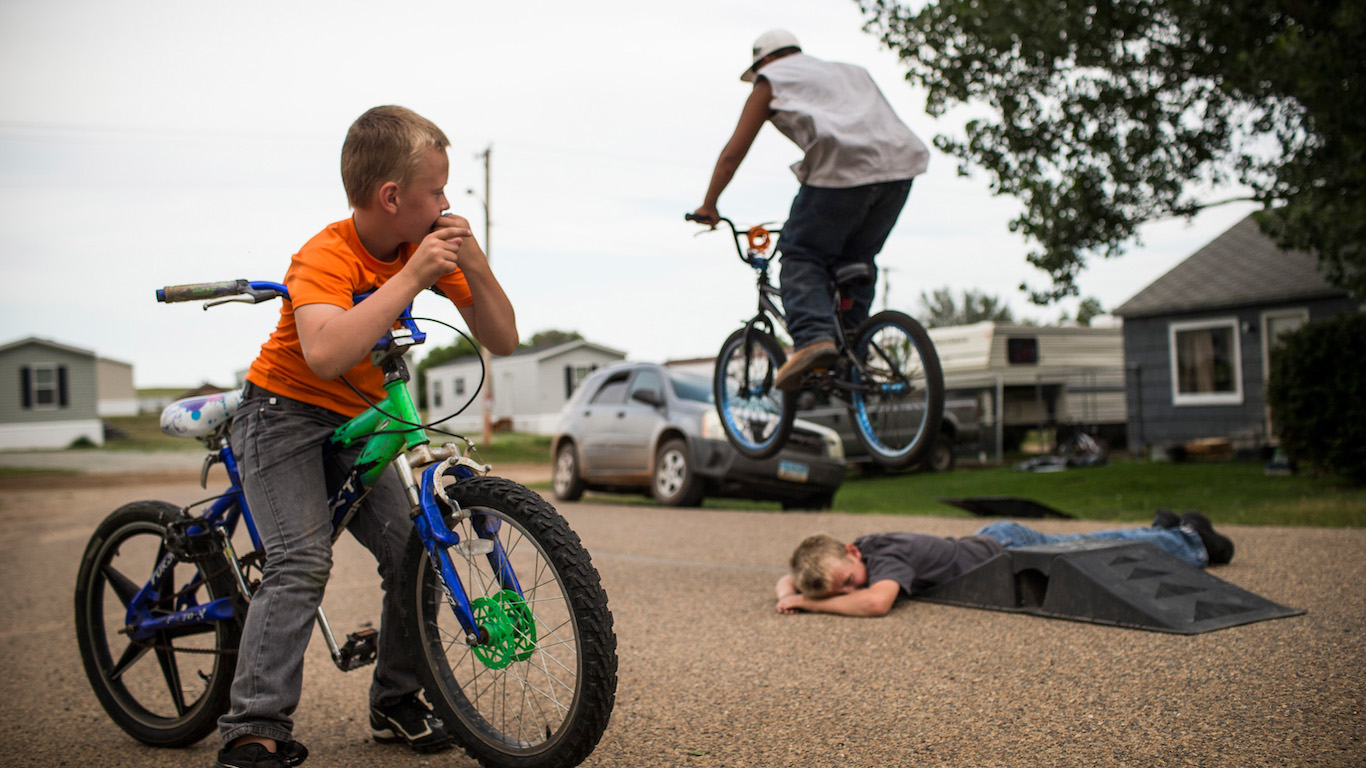
18. North Dakota
> Families receiving TANF benefits: 11.6 for every 100 poor families
> Family poverty rate: 6.2% (5th lowest)
> Median family income: $86,798 (15th highest)
> Max. monthly benefit for single-parent family of three: $486 (24th lowest)
> State TANF spending allocated to basic cash assistance: 9.8% (15th lowest)
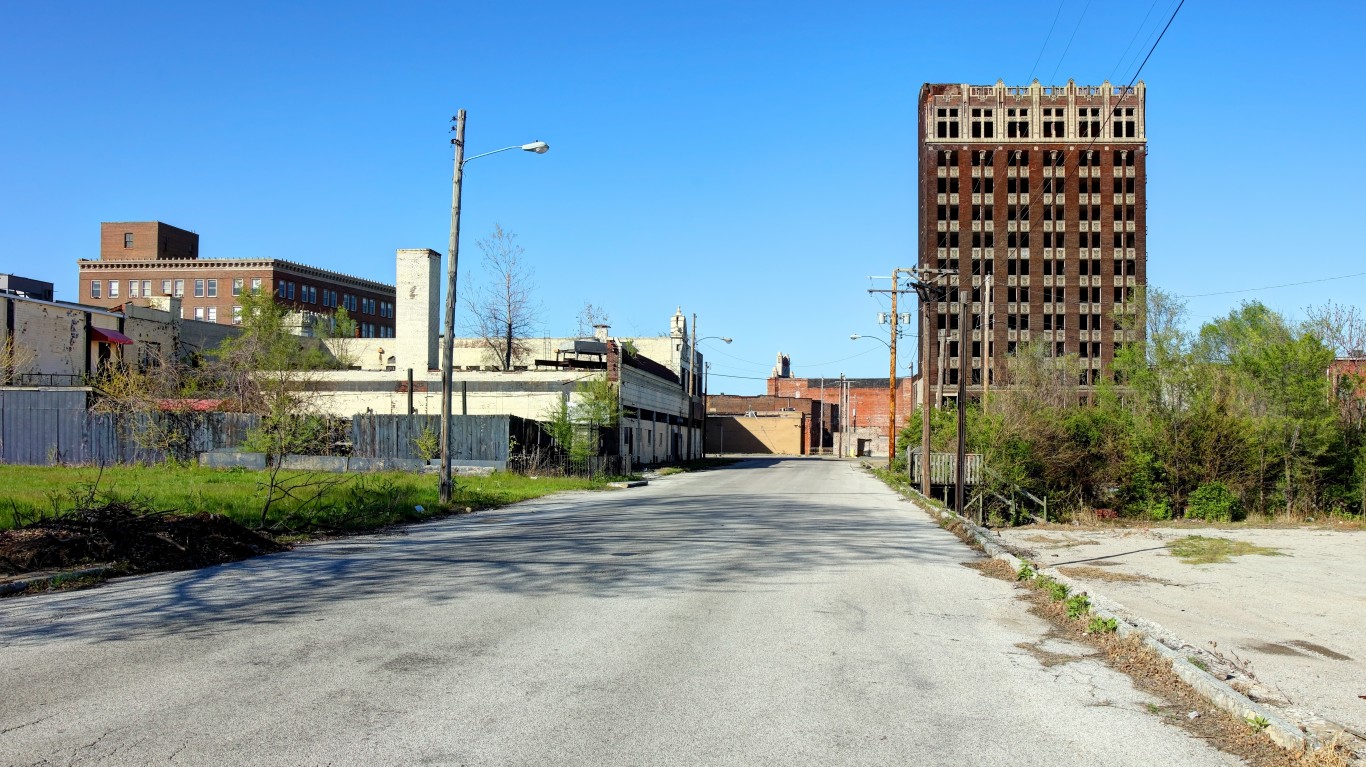
17. Missouri
> Families receiving TANF benefits: 11.3 for every 100 poor families
> Family poverty rate: 8.9% (21st highest)
> Median family income: $72,834 (15th lowest)
> Max. monthly benefit for single-parent family of three: $292 (11th lowest)
> State TANF spending allocated to basic cash assistance: 8.5% (12th lowest)
[in-text-ad-2]

16. Idaho
> Families receiving TANF benefits: 11.0 for every 100 poor families
> Family poverty rate: 8.1% (24th highest)
> Median family income: $70,885 (12th lowest)
> Max. monthly benefit for single-parent family of three: $309 (15th lowest)
> State TANF spending allocated to basic cash assistance: 18.1% (21st highest)

15. Michigan
> Families receiving TANF benefits: 10.9 for every 100 poor families
> Family poverty rate: 9.2% (18th highest)
> Median family income: $75,470 (21st lowest)
> Max. monthly benefit for single-parent family of three: $492 (25th lowest)
> State TANF spending allocated to basic cash assistance: 9.7% (14th lowest)
[in-text-ad]
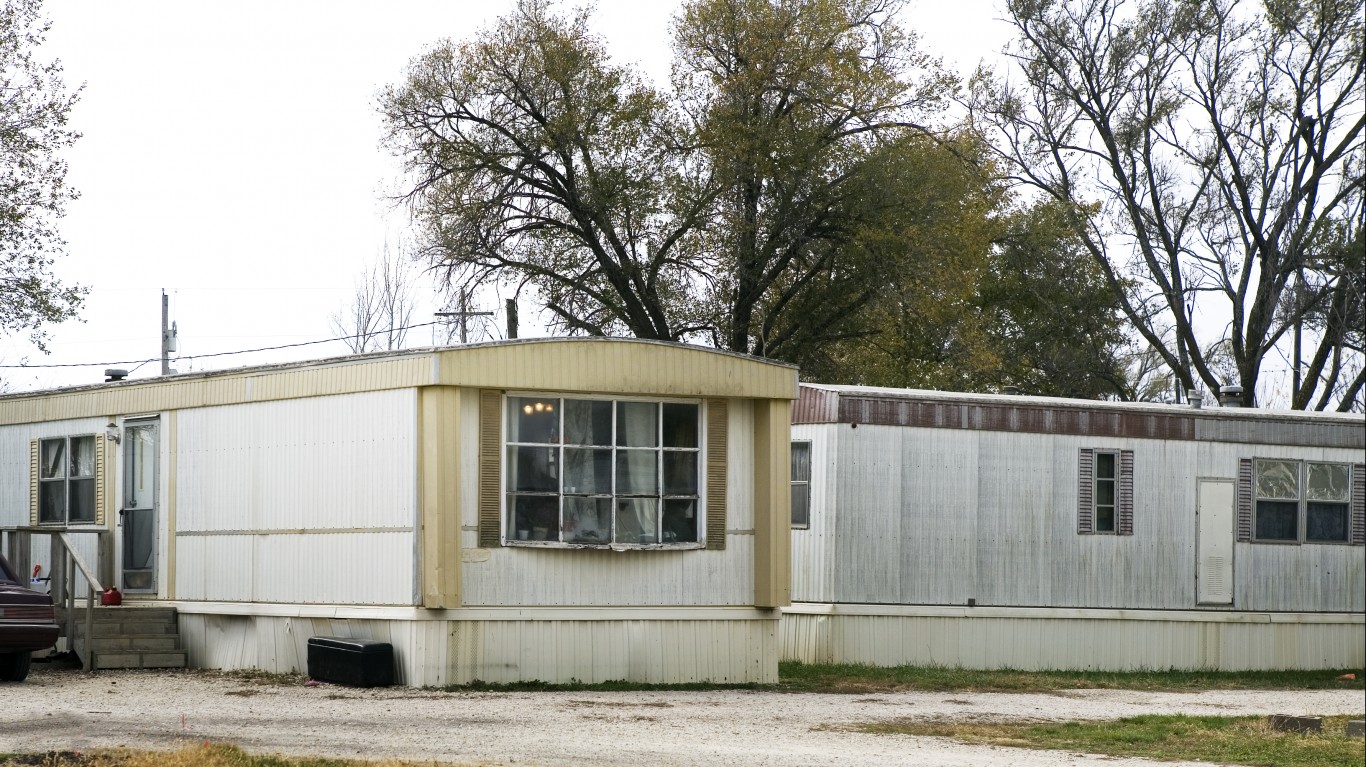
14. Kansas
> Families receiving TANF benefits: 9.0 for every 100 poor families
> Family poverty rate: 7.6% (20th lowest)
> Median family income: $77,620 (25th lowest)
> Max. monthly benefit for single-parent family of three: $429 (21st lowest)
> State TANF spending allocated to basic cash assistance: 7.4% (10th lowest)
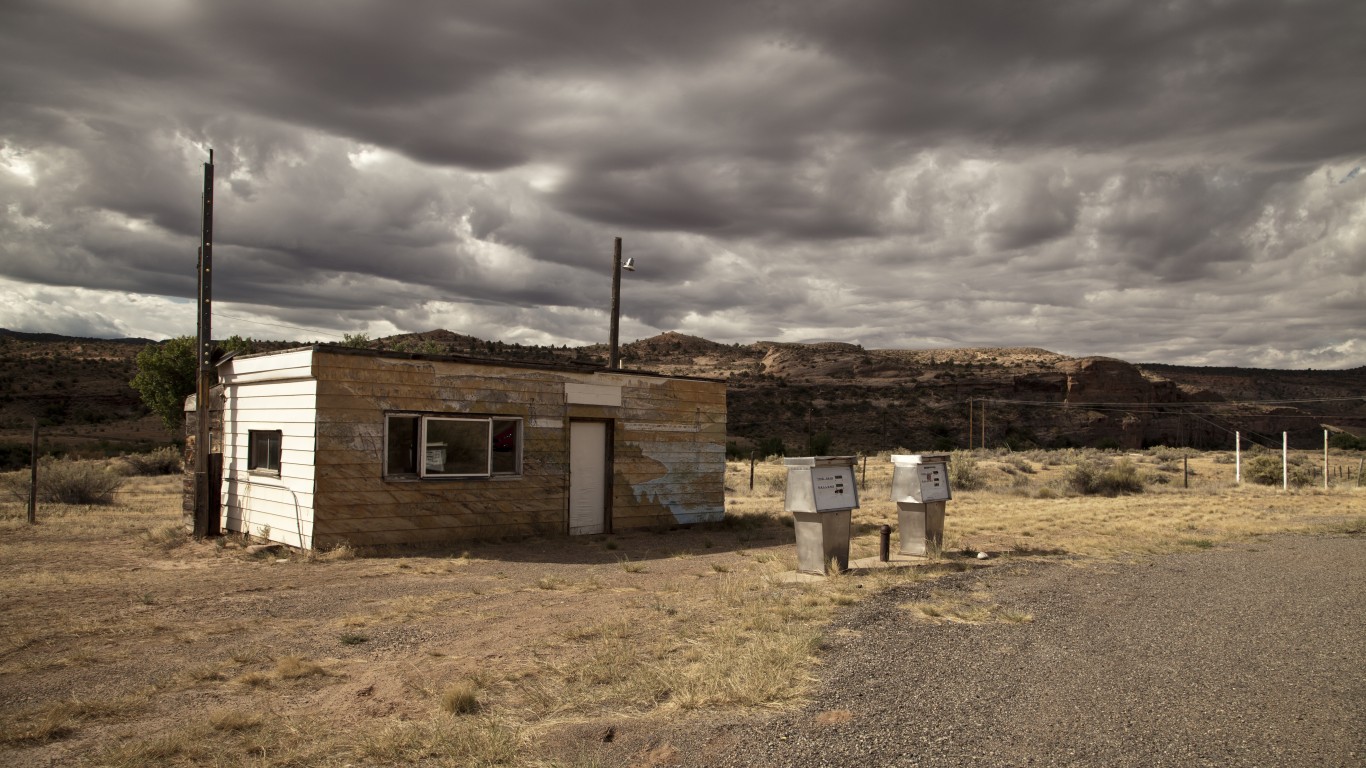
13. Utah
> Families receiving TANF benefits: 8.7 for every 100 poor families
> Family poverty rate: 6.3% (7th lowest)
> Median family income: $84,590 (18th highest)
> Max. monthly benefit for single-parent family of three: $498 (25th highest)
> State TANF spending allocated to basic cash assistance: 17.9% (22nd highest)

12. South Carolina
> Families receiving TANF benefits: 8.6 for every 100 poor families
> Family poverty rate: 10.5% (12th highest)
> Median family income: $68,813 (10th lowest)
> Max. monthly benefit for single-parent family of three: $305 (13th lowest)
> State TANF spending allocated to basic cash assistance: 29.4% (9th highest)
[in-text-ad-2]
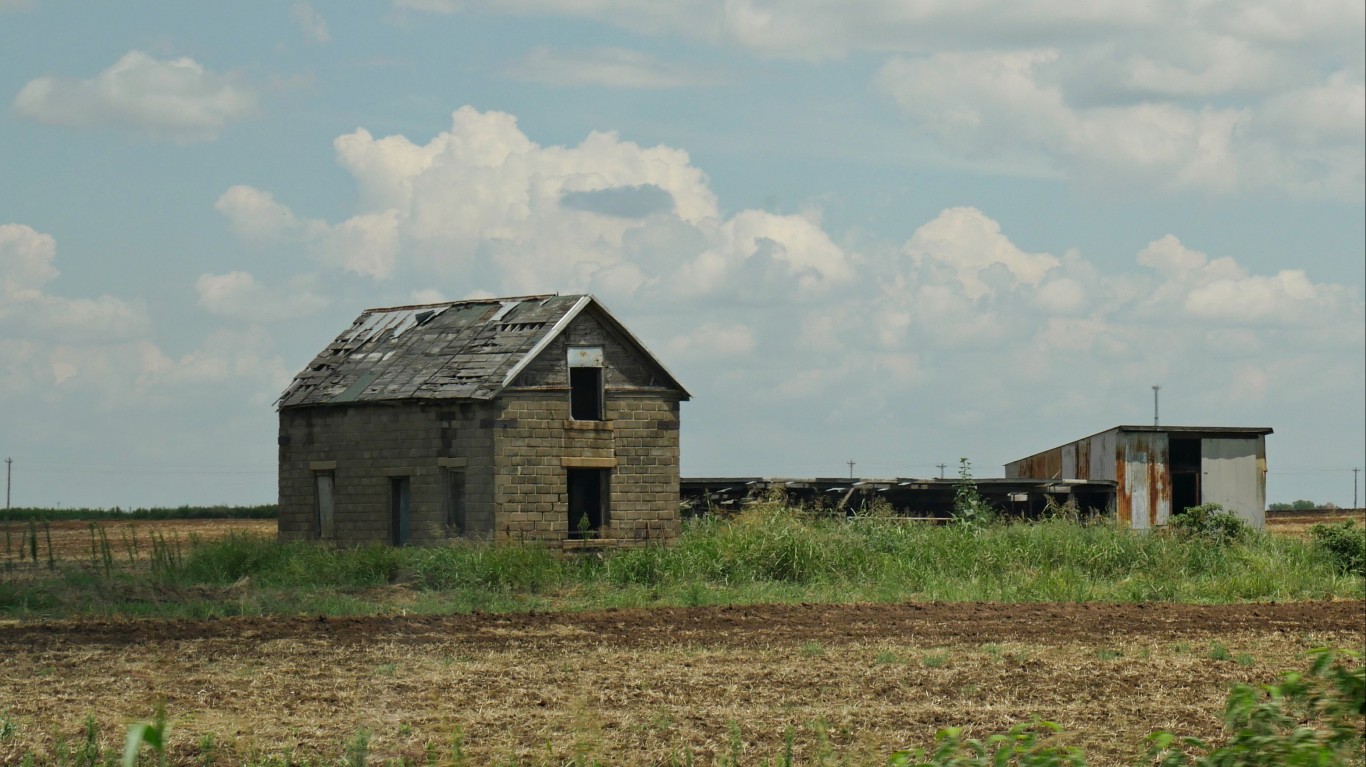
11. Oklahoma
> Families receiving TANF benefits: 8.4 for every 100 poor families
> Family poverty rate: 11.2% (8th highest)
> Median family income: $67,511 (8th lowest)
> Max. monthly benefit for single-parent family of three: $292 (11th lowest)
> State TANF spending allocated to basic cash assistance: 13.3% (21st lowest)
10. Alabama
> Families receiving TANF benefits: 7.4 for every 100 poor families
> Family poverty rate: 11.6% (7th highest)
> Median family income: $66,772 (7th lowest)
> Max. monthly benefit for single-parent family of three: $215 (2nd lowest)
> State TANF spending allocated to basic cash assistance: 8.0% (11th lowest)
[in-text-ad]

9. Wyoming
> Families receiving TANF benefits: 7.4 for every 100 poor families
> Family poverty rate: 6.7% (14th lowest)
> Median family income: $81,290 (20th highest)
> Max. monthly benefit for single-parent family of three: $726 (6th highest)
> State TANF spending allocated to basic cash assistance: 38.9% (5th highest)

8. Arizona
> Families receiving TANF benefits: 6.2 for every 100 poor families
> Family poverty rate: 10.1% (13th highest)
> Median family income: $73,456 (17th lowest)
> Max. monthly benefit for single-parent family of three: $278 (7th lowest)
> State TANF spending allocated to basic cash assistance: 12.7% (18th lowest)
7. Georgia
> Families receiving TANF benefits: 6.0 for every 100 poor families
> Family poverty rate: 10.6% (10th highest)
> Median family income: $74,127 (19th lowest)
> Max. monthly benefit for single-parent family of three: $280 (8th lowest)
> State TANF spending allocated to basic cash assistance: 22.7% (16th highest)
[in-text-ad-2]

6. Indiana
> Families receiving TANF benefits: 5.4 for every 100 poor families
> Family poverty rate: 8.9% (21st highest)
> Median family income: $73,265 (16th lowest)
> Max. monthly benefit for single-parent family of three: $288 (9th lowest)
> State TANF spending allocated to basic cash assistance: 4.8% (3rd lowest)

5. North Carolina
> Families receiving TANF benefits: 5.4 for every 100 poor families
> Family poverty rate: 10.0% (14th highest)
> Median family income: $70,978 (13th lowest)
> Max. monthly benefit for single-parent family of three: $272 (6th lowest)
> State TANF spending allocated to basic cash assistance: 5.9% (7th lowest)
[in-text-ad]
4. Louisiana
> Families receiving TANF benefits: 3.8 for every 100 poor families
> Family poverty rate: 14.2% (2nd highest)
> Median family income: $65,427 (5th lowest)
> Max. monthly benefit for single-parent family of three: $240 (3rd lowest)
> State TANF spending allocated to basic cash assistance: 7.1% (8th lowest)
3. Arkansas
> Families receiving TANF benefits: 3.8 for every 100 poor families
> Family poverty rate: 11.8% (6th highest)
> Median family income: $62,067 (3rd lowest)
> Max. monthly benefit for single-parent family of three: $204 (the lowest)
> State TANF spending allocated to basic cash assistance: 5.1% (4th lowest)

2. Mississippi
> Families receiving TANF benefits: 3.7 for every 100 poor families
> Family poverty rate: 15.0% (the highest)
> Median family income: $58,923 (the lowest)
> Max. monthly benefit for single-parent family of three: $260 (4th lowest)
> State TANF spending allocated to basic cash assistance: 5.3% (5th lowest)
[in-text-ad-2]
1. Texas
> Families receiving TANF benefits: 3.5 for every 100 poor families
> Family poverty rate: 10.9% (9th highest)
> Median family income: $76,073 (22nd lowest)
> Max. monthly benefit for single-parent family of three: $308 (14th lowest)
> State TANF spending allocated to basic cash assistance: 4.6% (2nd lowest)
Methodology
To determine the states where welfare supports the fewest families, 24/7 Wall St. reviewed data on Temporary Assistance for Needy Families benefits recipiency and poverty from the nonpartisan research institute Center on Budget and Policy Priorities. States were ranked based on the number of families receiving TANF benefits for every 100 families with income below the poverty line. Data on the TANF-to-poverty ratio are two-year averages for 2019 and 2020.
Data on the maximum monthly TANF benefit for a single-parent family of three is also from the CBPP and is current as of July 2021. Data on the percentage of state TANF spending that is allocated to basic cash assistance – as opposed to work, education, and training activities, work supports and supportive services, child care, refundable tax credits, pre-kindergarten and Head Start, child welfare, program management, or other state budget areas – is from the CBPP and is for fiscal 2020. Data on the percentage of families in poverty and the median family income is from the U.S. Census Bureau’s 2020 American Community Survey and figures are five-year estimates.
Thank you for reading! Have some feedback for us?
Contact the 24/7 Wall St. editorial team.