The average annual expenditure for different consumer units in the U.S. added up to $61,334, or $5,111.20 a month in 2020, according to the most recent Consumer Expenditure Survey from the Bureau of Labor Statistics. That figure represents a 2.7% drop from 2019. Consumer units include families, single persons living alone or with others who are financially independent, or two more persons living together who share expenses.
Housing costs rose 3.5%, while food expenditures decreased by 10.4% in 2020. The BLS attributes the decline in food expenses to more people eating at home during the pandemic.
While that is a monthly average across the U.S. and across different household units, expenses are often higher in major metropolitan areas. A lot more, in fact, according to the nonprofit think tank Economic Policy Institute. EPI’s Family Budget Calculator estimates monthly living expenses — including housing, food, transportation, health care, other necessities, and taxes — for 10 family types (one or two adults with zero to four children).
To determine what it actually costs to live in America’s 30 most expensive cities, 24/7 Wall St. ranked metropolitan areas by regional price parity, or cost of living, in 2020 from the Bureau of Economic Analysis. We added estimated monthly expenses for one adult with no children from the Family Budget Calculator, estimated for 2020. Because we chose one adult living alone, expenses are the lowest in a given area and do not include child care.
To cover monthly living expenses, adults living alone in the Chicago-Naperville-Elgin region, which straddles Illinois, Indiana, and Wisconsin, would need $3,430, the lowest among the most expensive metro areas. (A family of four in the Chicago area would need $7,741 to cover monthly expenses.) Compared to the national cost of living average, it costs 4.8% more to live in the Chicago metro area. (Here are metros where families pay the least for food.)
In the most expensive area, San Francisco-Oakland-Berkeley, California, total monthly expenses for one adult living alone add up to $6,347, as the cost of living is 17.4% more than the national average. (As opposed to one adult living alone, here is the income a family needs to cover normal living expenses in every state.)
Yet for those who live in those cities and surrounding metro areas, the ability to find jobs and access to cultural activities may be well worth the price.
Click here to see what it actually costs to live in America’s most expensive cities
Click here to read our detailed methodology

30. Chicago-Naperville-Elgin, IL-IN-WI
> Cost of living: 4.8% more than national avg.
> Est. monthly housing costs (adult living alone): $1,012
> Est. monthly food costs (adult living alone): $277
> Est. monthly transportation costs (adult living alone): $711
> Est. total monthly expenses (adult living alone): $3,430
> Monthly per capita income: $3,302
[in-text-ad]

29. Dallas-Fort Worth-Arlington, TX
> Cost of living: 5.1% more than national avg.
> Est. monthly housing costs (adult living alone): $1,029
> Est. monthly food costs (adult living alone): $256
> Est. monthly transportation costs (adult living alone): $784
> Est. total monthly expenses (adult living alone): $3,352
> Monthly per capita income: $3,031

28. Baltimore-Columbia-Towson, MD
> Cost of living: 5.4% more than national avg.
> Est. monthly housing costs (adult living alone): $917
> Est. monthly food costs (adult living alone): $295
> Est. monthly transportation costs (adult living alone): $773
> Est. total monthly expenses (adult living alone): $3,250
> Monthly per capita income: $3,565

27. Bremerton-Silverdale-Port Orchard, WA
> Cost of living: 5.5% more than national avg.
> Est. monthly housing costs (adult living alone): $976
> Est. monthly food costs (adult living alone): $297
> Est. monthly transportation costs (adult living alone): $901
> Est. total monthly expenses (adult living alone): $3,440
> Monthly per capita income: $3,333
[in-text-ad-2]

26. Bridgeport-Stamford-Norwalk, CT
> Cost of living: 5.6% more than national avg.
> Est. monthly housing costs (adult living alone): $954
> Est. monthly food costs (adult living alone): $351
> Est. monthly transportation costs (adult living alone): $807
> Est. total monthly expenses (adult living alone): $3,654
> Monthly per capita income: $4,904

25. Portland-Vancouver-Hillsboro, OR-WA
> Cost of living: 5.7% more than national avg.
> Est. monthly housing costs (adult living alone): $1,245
> Est. monthly food costs (adult living alone): $299
> Est. monthly transportation costs (adult living alone): $828
> Est. total monthly expenses (adult living alone): $4,028
> Monthly per capita income: $3,345
[in-text-ad]
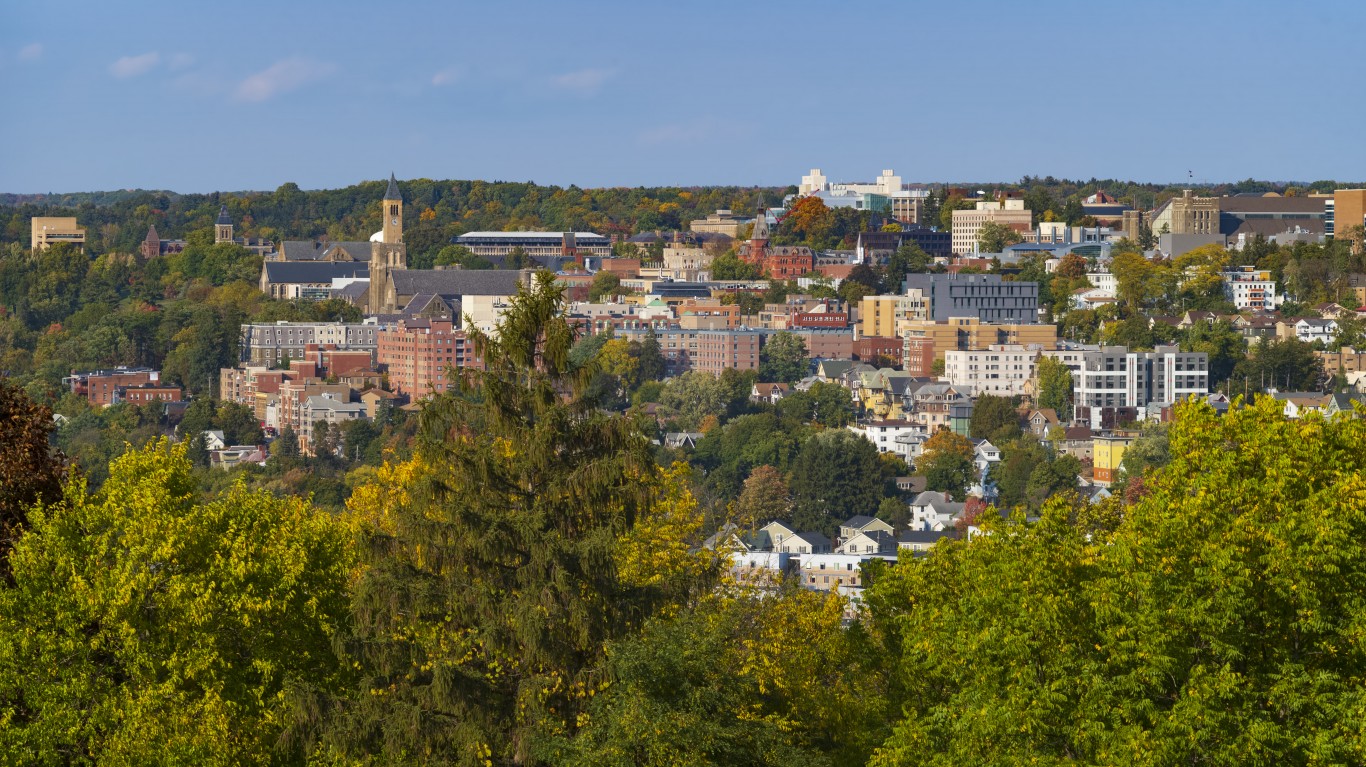
24. Ithaca, NY
> Cost of living: 5.8% more than national avg.
> Est. monthly housing costs (adult living alone): $980
> Est. monthly food costs (adult living alone): $303
> Est. monthly transportation costs (adult living alone): $827
> Est. total monthly expenses (adult living alone): $3,663
> Monthly per capita income: $2,850

23. Sacramento-Roseville-Folsom, CA
> Cost of living: 6.1% more than national avg.
> Est. monthly housing costs (adult living alone): $1,060
> Est. monthly food costs (adult living alone): $304
> Est. monthly transportation costs (adult living alone): $874
> Est. total monthly expenses (adult living alone): $3,785
> Monthly per capita income: $3,094

22. Barnstable Town, MA
> Cost of living: 7.0% more than national avg.
> Est. monthly housing costs (adult living alone): $1,100
> Est. monthly food costs (adult living alone): $380
> Est. monthly transportation costs (adult living alone): $908
> Est. total monthly expenses (adult living alone): $3,949
> Monthly per capita income: $3,943
[in-text-ad-2]

21. Denver-Aurora-Lakewood, CO
> Cost of living: 7.3% more than national avg.
> Est. monthly housing costs (adult living alone): $1,179
> Est. monthly food costs (adult living alone): $302
> Est. monthly transportation costs (adult living alone): $831
> Est. total monthly expenses (adult living alone): $3,796
> Monthly per capita income: $3,619

20. Vallejo, CA
> Cost of living: 8.4% more than national avg.
> Est. monthly housing costs (adult living alone): $1,190
> Est. monthly food costs (adult living alone): $287
> Est. monthly transportation costs (adult living alone): $949
> Est. total monthly expenses (adult living alone): $4,088
> Monthly per capita income: $3,057
[in-text-ad]

19. Kahului-Wailuku-Lahaina, HI
> Cost of living: 9.0% more than national avg.
> Est. monthly housing costs (adult living alone): $1,321
> Est. monthly food costs (adult living alone): $449
> Est. monthly transportation costs (adult living alone): $945
> Est. total monthly expenses (adult living alone): $4,652
> Monthly per capita income: $3,073

18. Santa Cruz-Watsonville, CA
> Cost of living: 9.4% more than national avg.
> Est. monthly housing costs (adult living alone): $1,993
> Est. monthly food costs (adult living alone): $354
> Est. monthly transportation costs (adult living alone): $983
> Est. total monthly expenses (adult living alone): $5,808
> Monthly per capita income: $3,690

17. San Luis Obispo-Paso Robles, CA
> Cost of living: 9.5% more than national avg.
> Est. monthly housing costs (adult living alone): $1,166
> Est. monthly food costs (adult living alone): $324
> Est. monthly transportation costs (adult living alone): $1,028
> Est. total monthly expenses (adult living alone): $4,230
> Monthly per capita income: $3,224
[in-text-ad-2]

16. Santa Rosa-Petaluma, CA
> Cost of living: 9.8% more than national avg.
> Est. monthly housing costs (adult living alone): $1,340
> Est. monthly food costs (adult living alone): $346
> Est. monthly transportation costs (adult living alone): $989
> Est. total monthly expenses (adult living alone): $4,544
> Monthly per capita income: $3,673

15. Miami-Fort Lauderdale-Pompano Beach, FL
> Cost of living: 10.0% more than national avg.
> Est. monthly housing costs (adult living alone): $1,057
> Est. monthly food costs (adult living alone): $312
> Est. monthly transportation costs (adult living alone): $687
> Est. total monthly expenses (adult living alone): $3,424
> Monthly per capita income: $2,813
[in-text-ad]

14. Santa Maria-Santa Barbara, CA
> Cost of living: 10.0% more than national avg.
> Est. monthly housing costs (adult living alone): $1,728
> Est. monthly food costs (adult living alone): $297
> Est. monthly transportation costs (adult living alone): $984
> Est. total monthly expenses (adult living alone): $5,200
> Monthly per capita income: $3,178

13. Boston-Cambridge-Newton, MA-NH
> Cost of living: 10.2% more than national avg.
> Est. monthly housing costs (adult living alone): $1,742
> Est. monthly food costs (adult living alone): $350
> Est. monthly transportation costs (adult living alone): $729
> Est. total monthly expenses (adult living alone): $4,801
> Monthly per capita income: $4,127

12. Salinas, CA
> Cost of living: 10.7% more than national avg.
> Est. monthly housing costs (adult living alone): $1,348
> Est. monthly food costs (adult living alone): $297
> Est. monthly transportation costs (adult living alone): $996
> Est. total monthly expenses (adult living alone): $4,743
> Monthly per capita income: $2,677
[in-text-ad-2]

11. Oxnard-Thousand Oaks-Ventura, CA
> Cost of living: 11.4% more than national avg.
> Est. monthly housing costs (adult living alone): $1,269
> Est. monthly food costs (adult living alone): $300
> Est. monthly transportation costs (adult living alone): $1,003
> Est. total monthly expenses (adult living alone): $4,314
> Monthly per capita income: $3,284

10. Napa, CA
> Cost of living: 11.4% more than national avg.
> Est. monthly housing costs (adult living alone): $1,331
> Est. monthly food costs (adult living alone): $379
> Est. monthly transportation costs (adult living alone): $1,015
> Est. total monthly expenses (adult living alone): $4,624
> Monthly per capita income: $3,909
[in-text-ad]

9. Washington-Arlington-Alexandria, DC-VA-MD-WV
> Cost of living: 11.5% more than national avg.
> Est. monthly housing costs (adult living alone): $1,513
> Est. monthly food costs (adult living alone): $322
> Est. monthly transportation costs (adult living alone): $736
> Est. total monthly expenses (adult living alone): $4,379
> Monthly per capita income: $4,293

8. Poughkeepsie-Newburgh-Middletown, NY
> Cost of living: 11.9% more than national avg.
> Est. monthly housing costs (adult living alone): $1,088
> Est. monthly food costs (adult living alone): $303
> Est. monthly transportation costs (adult living alone): $896
> Est. total monthly expenses (adult living alone): $3,988
> Monthly per capita income: $3,210

7. Los Angeles-Long Beach-Anaheim, CA
> Cost of living: 11.9% more than national avg.
> Est. monthly housing costs (adult living alone): $1,369
> Est. monthly food costs (adult living alone): $299
> Est. monthly transportation costs (adult living alone): $822
> Est. total monthly expenses (adult living alone): $4,074
> Monthly per capita income: $3,121
[in-text-ad-2]

6. Seattle-Tacoma-Bellevue, WA
> Cost of living: 12.0% more than national avg.
> Est. monthly housing costs (adult living alone): $1,523
> Est. monthly food costs (adult living alone): $326
> Est. monthly transportation costs (adult living alone): $854
> Est. total monthly expenses (adult living alone): $4,347
> Monthly per capita income: $4,013

5. San Jose-Sunnyvale-Santa Clara, CA
> Cost of living: 12.1% more than national avg.
> Est. monthly housing costs (adult living alone): $2,228
> Est. monthly food costs (adult living alone): $332
> Est. monthly transportation costs (adult living alone): $895
> Est. total monthly expenses (adult living alone): $5,964
> Monthly per capita income: $4,876
[in-text-ad]

4. San Diego-Chula Vista-Carlsbad, CA
> Cost of living: 13.4% more than national avg.
> Est. monthly housing costs (adult living alone): $1,478
> Est. monthly food costs (adult living alone): $304
> Est. monthly transportation costs (adult living alone): $892
> Est. total monthly expenses (adult living alone): $4,479
> Monthly per capita income: $3,311

3. Urban Honolulu, HI
> Cost of living: 13.8% more than national avg.
> Est. monthly housing costs (adult living alone): $1,433
> Est. monthly food costs (adult living alone): $412
> Est. monthly transportation costs (adult living alone): $814
> Est. total monthly expenses (adult living alone): $4,611
> Monthly per capita income: $3,191

2. New York-Newark-Jersey City, NY-NJ-PA
> Cost of living: 15.5% more than national avg.
> Est. monthly housing costs (adult living alone): $1,760
> Est. monthly food costs (adult living alone): $358
> Est. monthly transportation costs (adult living alone): $433
> Est. total monthly expenses (adult living alone): $4,727
> Monthly per capita income: $3,754
[in-text-ad-2]

1. San Francisco-Oakland-Berkeley, CA
> Cost of living: 17.4% more than national avg.
> Est. monthly housing costs (adult living alone): $2,350
> Est. monthly food costs (adult living alone): $384
> Est. monthly transportation costs (adult living alone): $813
> Est. total monthly expenses (adult living alone): $6,347
> Monthly per capita income: $4,815
Methodology
To determine what it actually costs to live in America’s most expensive cities, 24/7 Wall St. reviewed data on estimated monthly expenses from the Economic Policy Institute’s Family Budget Calculator and the Bureau of Economic Analysis. Metropolitan statistical areas were ordered based on data on regional price parity, or cost of living, for all goods and services in 2020 from the BEA.
Data on estimated monthly housing costs, food costs, transportation costs, and total monthly expenses for a single individual came from the EPI are for 2020. Data on monthly income per capita are calculated from five-year data on annual income per capita from the U.S. Census Bureau’s 2020 American Community Survey.
It’s Your Money, Your Future—Own It (sponsor)
Are you ahead, or behind on retirement? For families with more than $500,000 saved for retirement, finding a financial advisor who puts your interest first can be the difference, and today it’s easier than ever. SmartAsset’s free tool matches you with up to three fiduciary financial advisors who serve your area in minutes. Each advisor has been carefully vetted and must act in your best interests. Start your search now.
If you’ve saved and built a substantial nest egg for you and your family, don’t delay; get started right here and help your retirement dreams become a retirement reality.
Thank you for reading! Have some feedback for us?
Contact the 24/7 Wall St. editorial team.
 24/7 Wall St.
 24/7 Wall St.