During the COVID-19 pandemic, many parents with children under the age of 18 – both mothers and fathers – left the workforce. With schools across the country shifting to remote learning, it made more financial sense for many parents to give up their job and stay home with their children rather than pay for child care – especially as child care costs skyrocketed during the pandemic.
According to the Economic Policy Institute, a nonprofit think tank, a family with two children, age four and eight, is projected to pay an average of $16,659 on child care in 2022. This amount varies across the country, however. In some states child care costs are far lower than the national average, while in others, families are paying thousands more. Here is a look at the countries with the most and least affordable groceries.
Using data from the EPI’s Family Budget Calculator, 24/7 Wall St. identified the states where families pay the most for child care. States are ranked on estimated child care expenditure in 2022, accounting for likely variations in types of available care between urban and rural areas for two children, age four and eight.
States with the highest child care costs are mostly spread across the Western and Northeastern U.S., while the lowest-cost states are overwhelmingly concentrated in the South. Here is a look at the best and worst states to raise a family.
As is often the case with factors that affect cost of living, child care costs appear to be driven in part by what parents can afford. In nearly every state with lower than average child care costs, median family income is below $80,069, the amount the typical American family earns. Similarly, in the vast majority of states with higher than average child care costs, the median family income is also higher than average. Here is a look at the income needed to be middle class in each state.
Click here to see the states where families pay the most for child care
Click here to read our detailed methodology

50. Mississippi
> Est. annual child care costs (2 children): $6,215
> Median family income: $58,923 (the lowest)
> Share of population under age 15: 19.6% (12th highest)
> Share of households occupied by families: 66.3% (9th highest)
[in-text-ad]

49. Louisiana
> Est. annual child care costs (2 children): $9,718
> Median family income: $65,427 (5th lowest)
> Share of population under age 15: 19.6% (11th highest)
> Share of households occupied by families: 63.7% (20th lowest)

48. South Carolina
> Est. annual child care costs (2 children): $9,741
> Median family income: $68,813 (10th lowest)
> Share of population under age 15: 18.0% (16th lowest)
> Share of households occupied by families: 65.3% (17th highest)

47. Georgia
> Est. annual child care costs (2 children): $11,399
> Median family income: $74,127 (19th lowest)
> Share of population under age 15: 19.7% (10th highest)
> Share of households occupied by families: 67.0% (7th highest)
[in-text-ad-2]

46. Tennessee
> Est. annual child care costs (2 children): $11,647
> Median family income: $68,793 (9th lowest)
> Share of population under age 15: 18.5% (25th lowest)
> Share of households occupied by families: 65.4% (14th highest)

45. Arkansas
> Est. annual child care costs (2 children): $11,931
> Median family income: $62,067 (3rd lowest)
> Share of population under age 15: 19.4% (15th highest)
> Share of households occupied by families: 65.8% (11th highest)
[in-text-ad]

44. Texas
> Est. annual child care costs (2 children): $12,449
> Median family income: $76,073 (22nd lowest)
> Share of population under age 15: 21.5% (2nd highest)
> Share of households occupied by families: 69.0% (3rd highest)

43. Iowa
> Est. annual child care costs (2 children): $12,837
> Median family income: $79,186 (25th highest)
> Share of population under age 15: 19.2% (17th highest)
> Share of households occupied by families: 62.9% (9th lowest)

42. Maine
> Est. annual child care costs (2 children): $12,929
> Median family income: $76,192 (23rd lowest)
> Share of population under age 15: 15.3% (2nd lowest)
> Share of households occupied by families: 61.4% (4th lowest)
[in-text-ad-2]

41. Missouri
> Est. annual child care costs (2 children): $12,936
> Median family income: $72,834 (15th lowest)
> Share of population under age 15: 18.7% (23rd highest)
> Share of households occupied by families: 63.6% (15th lowest)

40. Florida
> Est. annual child care costs (2 children): $12,948
> Median family income: $69,670 (11th lowest)
> Share of population under age 15: 16.4% (6th lowest)
> Share of households occupied by families: 64.5% (24th highest)
[in-text-ad]

39. South Dakota
> Est. annual child care costs (2 children): $13,056
> Median family income: $77,042 (24th lowest)
> Share of population under age 15: 20.6% (5th highest)
> Share of households occupied by families: 62.9% (10th lowest)

38. Alabama
> Est. annual child care costs (2 children): $13,811
> Median family income: $66,772 (7th lowest)
> Share of population under age 15: 18.5% (25th highest)
> Share of households occupied by families: 65.4% (15th highest)

37. Kentucky
> Est. annual child care costs (2 children): $13,879
> Median family income: $65,893 (6th lowest)
> Share of population under age 15: 18.7% (22nd highest)
> Share of households occupied by families: 65.2% (20th highest)
[in-text-ad-2]

36. North Carolina
> Est. annual child care costs (2 children): $13,940
> Median family income: $70,978 (13th lowest)
> Share of population under age 15: 18.3% (20th lowest)
> Share of households occupied by families: 65.1% (21st highest)

35. Kansas
> Est. annual child care costs (2 children): $13,976
> Median family income: $77,620 (25th lowest)
> Share of population under age 15: 20.2% (8th highest)
> Share of households occupied by families: 64.6% (23rd highest)
[in-text-ad]

34. Idaho
> Est. annual child care costs (2 children): $14,012
> Median family income: $70,885 (12th lowest)
> Share of population under age 15: 21.0% (4th highest)
> Share of households occupied by families: 68.0% (6th highest)

33. Ohio
> Est. annual child care costs (2 children): $14,489
> Median family income: $74,391 (20th lowest)
> Share of population under age 15: 18.3% (21st lowest)
> Share of households occupied by families: 62.6% (7th lowest)

32. West Virginia
> Est. annual child care costs (2 children): $14,553
> Median family income: $61,707 (2nd lowest)
> Share of population under age 15: 16.7% (7th lowest)
> Share of households occupied by families: 64.1% (24th lowest)
[in-text-ad-2]

31. New Mexico
> Est. annual child care costs (2 children): $14,800
> Median family income: $62,611 (4th lowest)
> Share of population under age 15: 19.1% (18th highest)
> Share of households occupied by families: 62.7% (8th lowest)

30. Oklahoma
> Est. annual child care costs (2 children): $14,910
> Median family income: $67,511 (8th lowest)
> Share of population under age 15: 20.2% (7th highest)
> Share of households occupied by families: 65.3% (16th highest)
[in-text-ad]

29. Delaware
> Est. annual child care costs (2 children): $14,930
> Median family income: $84,825 (17th highest)
> Share of population under age 15: 17.5% (12th lowest)
> Share of households occupied by families: 65.5% (13th highest)

28. New Hampshire
> Est. annual child care costs (2 children): $15,612
> Median family income: $97,001 (6th highest)
> Share of population under age 15: 15.5% (3rd lowest)
> Share of households occupied by families: 65.2% (18th highest)

27. California
> Est. annual child care costs (2 children): $15,816
> Median family income: $89,798 (12th highest)
> Share of population under age 15: 18.9% (20th highest)
> Share of households occupied by families: 68.6% (5th highest)
[in-text-ad-2]
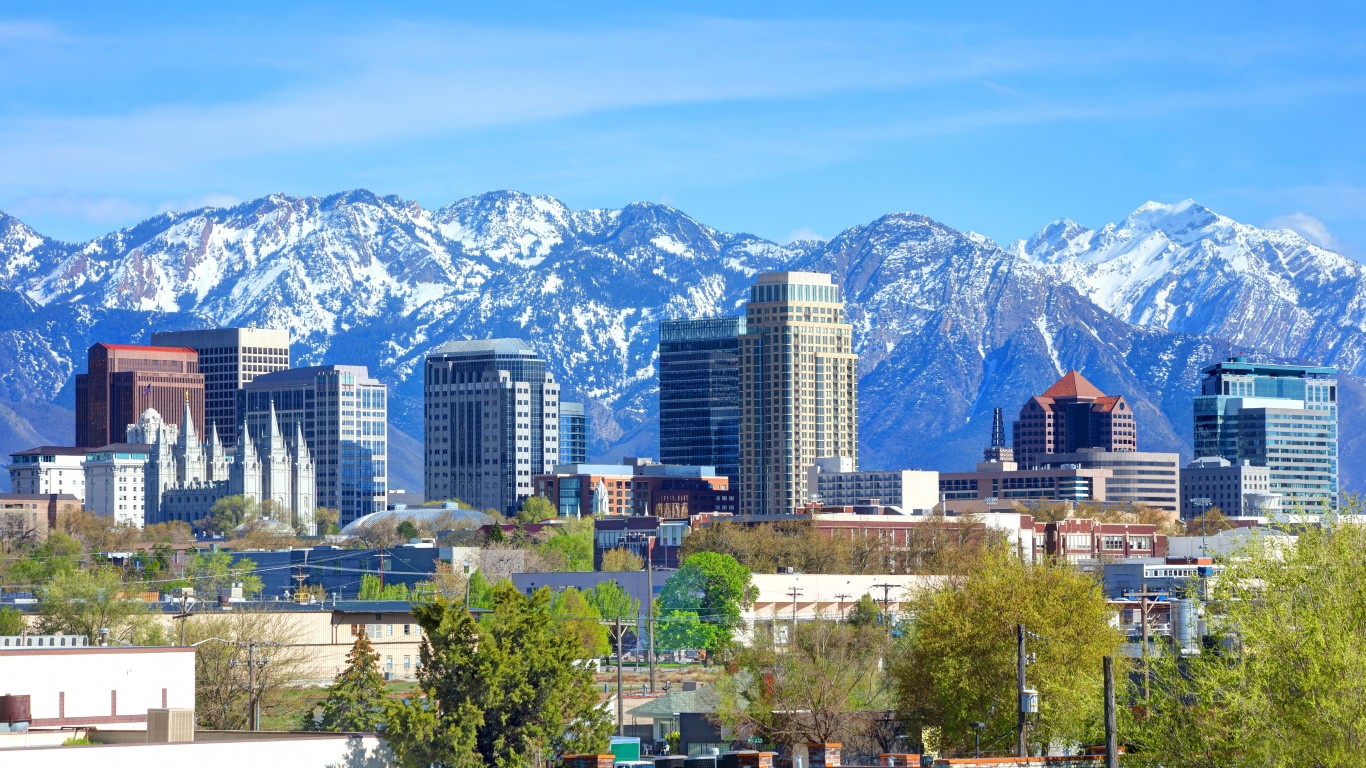
26. Utah
> Est. annual child care costs (2 children): $16,111
> Median family income: $84,590 (18th highest)
> Share of population under age 15: 24.6% (the highest)
> Share of households occupied by families: 74.4% (the highest)

25. Vermont
> Est. annual child care costs (2 children): $16,503
> Median family income: $83,023 (19th highest)
> Share of population under age 15: 15.1% (the lowest)
> Share of households occupied by families: 59.8% (2nd lowest)
[in-text-ad]
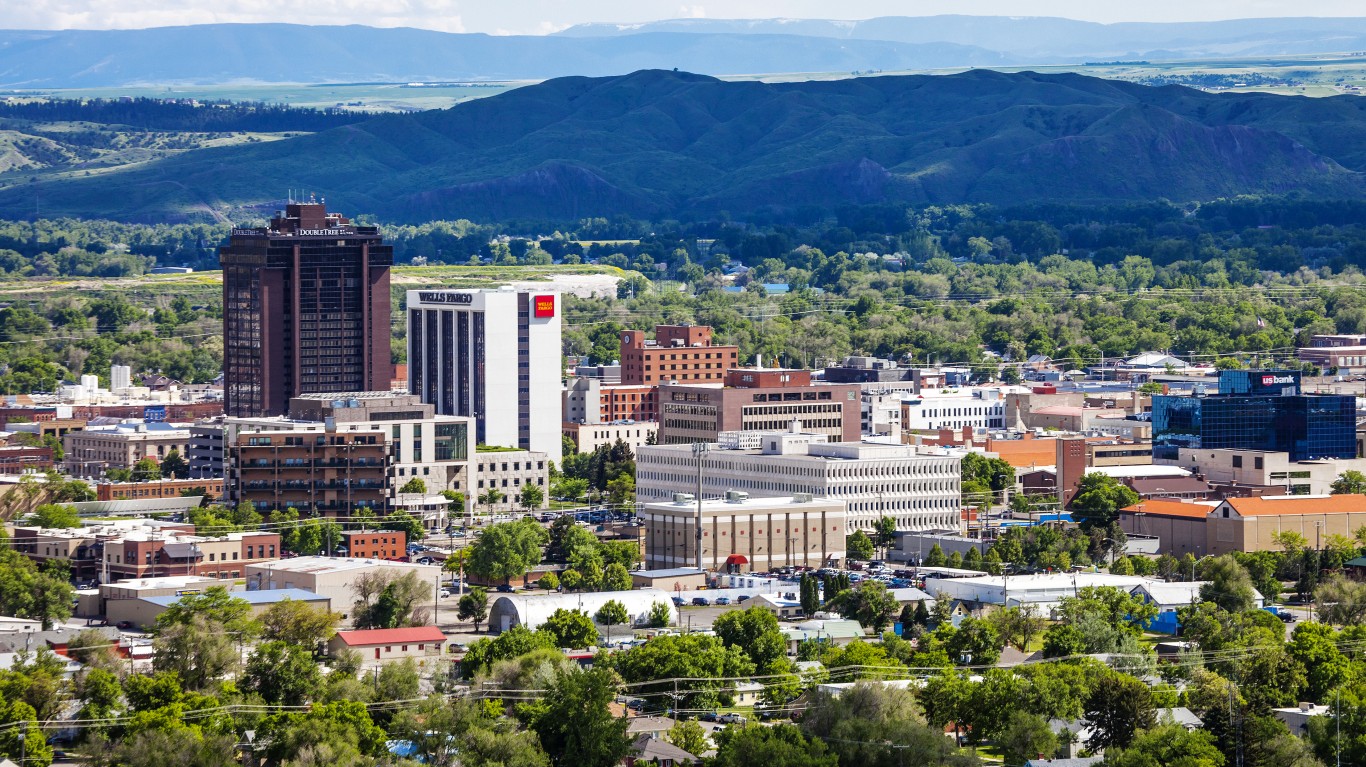
24. Montana
> Est. annual child care costs (2 children): $17,025
> Median family income: $72,773 (14th lowest)
> Share of population under age 15: 17.9% (14th lowest)
> Share of households occupied by families: 61.3% (3rd lowest)

23. Nevada
> Est. annual child care costs (2 children): $17,051
> Median family income: $74,077 (18th lowest)
> Share of population under age 15: 18.9% (21st highest)
> Share of households occupied by families: 63.7% (19th lowest)
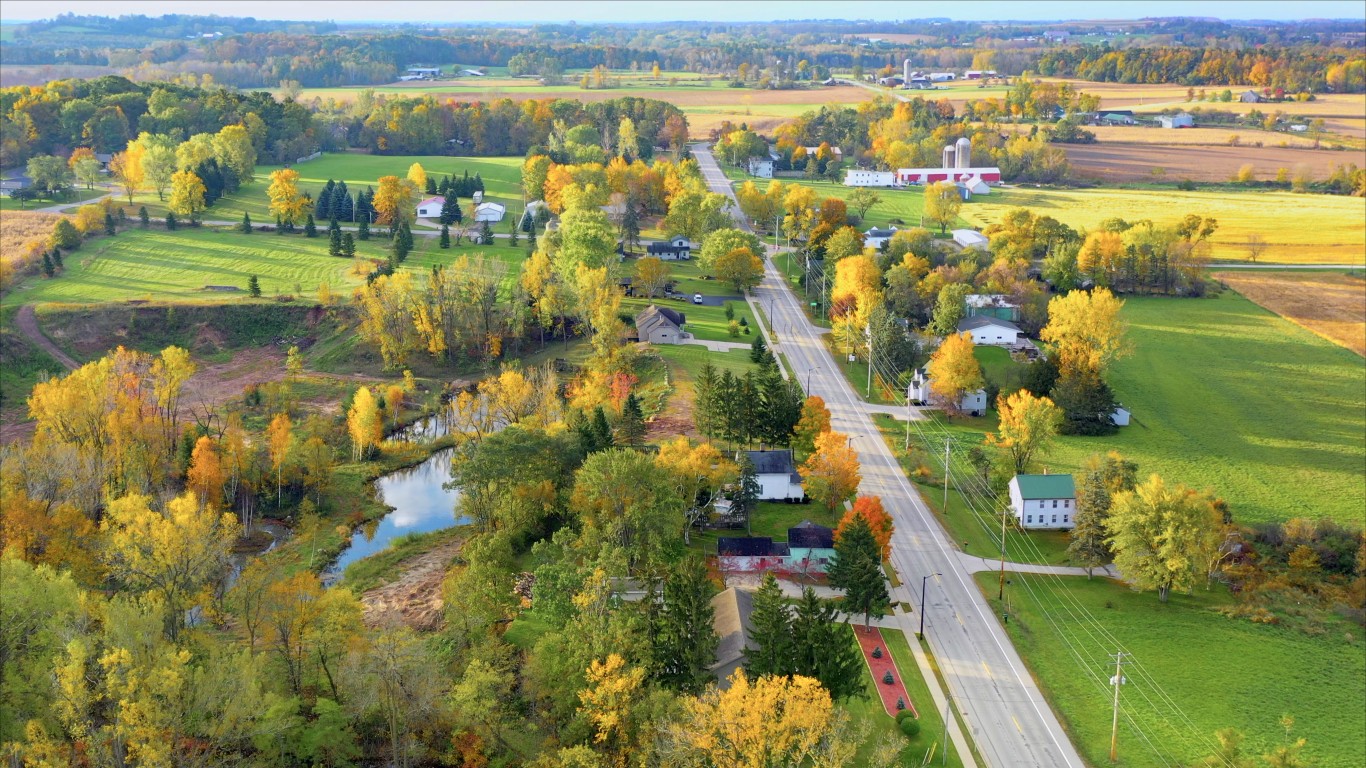
22. Wisconsin
> Est. annual child care costs (2 children): $17,092
> Median family income: $80,844 (22nd highest)
> Share of population under age 15: 18.1% (17th lowest)
> Share of households occupied by families: 62.2% (6th lowest)
[in-text-ad-2]

21. Maryland
> Est. annual child care costs (2 children): $17,251
> Median family income: $105,790 (2nd highest)
> Share of population under age 15: 18.4% (24th lowest)
> Share of households occupied by families: 66.3% (8th highest)

20. Michigan
> Est. annual child care costs (2 children): $17,276
> Median family income: $75,470 (21st lowest)
> Share of population under age 15: 17.8% (13th lowest)
> Share of households occupied by families: 63.5% (14th lowest)
[in-text-ad]

19. Virginia
> Est. annual child care costs (2 children): $17,347
> Median family income: $93,284 (7th highest)
> Share of population under age 15: 18.2% (19th lowest)
> Share of households occupied by families: 66.0% (10th highest)

18. Arizona
> Est. annual child care costs (2 children): $17,391
> Median family income: $73,456 (17th lowest)
> Share of population under age 15: 18.9% (19th highest)
> Share of households occupied by families: 65.1% (22nd highest)

17. Indiana
> Est. annual child care costs (2 children): $18,107
> Median family income: $73,265 (16th lowest)
> Share of population under age 15: 19.4% (14th highest)
> Share of households occupied by families: 64.5% (25th highest)
[in-text-ad-2]

16. Connecticut
> Est. annual child care costs (2 children): $18,113
> Median family income: $102,061 (4th highest)
> Share of population under age 15: 16.7% (8th lowest)
> Share of households occupied by families: 65.2% (19th highest)

15. Illinois
> Est. annual child care costs (2 children): $18,131
> Median family income: $86,251 (16th highest)
> Share of population under age 15: 18.5% (24th highest)
> Share of households occupied by families: 63.8% (22nd lowest)
[in-text-ad]

14. Rhode Island
> Est. annual child care costs (2 children): $18,589
> Median family income: $89,330 (13th highest)
> Share of population under age 15: 15.9% (4th lowest)
> Share of households occupied by families: 62.2% (5th lowest)

13. Hawaii
> Est. annual child care costs (2 children): $18,852
> Median family income: $97,813 (5th highest)
> Share of population under age 15: 18.0% (15th lowest)
> Share of households occupied by families: 69.3% (2nd highest)

12. Washington
> Est. annual child care costs (2 children): $18,876
> Median family income: $92,422 (11th highest)
> Share of population under age 15: 18.4% (23rd lowest)
> Share of households occupied by families: 64.5% (25th lowest)
[in-text-ad-2]

11. Nebraska
> Est. annual child care costs (2 children): $18,934
> Median family income: $80,125 (24th highest)
> Share of population under age 15: 20.6% (6th highest)
> Share of households occupied by families: 63.8% (21st lowest)

10. Oregon
> Est. annual child care costs (2 children): $19,026
> Median family income: $80,630 (23rd highest)
> Share of population under age 15: 17.2% (10th lowest)
> Share of households occupied by families: 63.0% (12th lowest)
[in-text-ad]

9. Pennsylvania
> Est. annual child care costs (2 children): $19,039
> Median family income: $80,996 (21st highest)
> Share of population under age 15: 17.1% (9th lowest)
> Share of households occupied by families: 63.7% (18th lowest)

8. Colorado
> Est. annual child care costs (2 children): $19,418
> Median family income: $92,752 (8th highest)
> Share of population under age 15: 18.4% (22nd lowest)
> Share of households occupied by families: 63.6% (16th lowest)

7. New Jersey
> Est. annual child care costs (2 children): $20,144
> Median family income: $104,804 (3rd highest)
> Share of population under age 15: 18.1% (18th lowest)
> Share of households occupied by families: 68.7% (4th highest)
[in-text-ad-2]

6. North Dakota
> Est. annual child care costs (2 children): $20,541
> Median family income: $86,798 (15th highest)
> Share of population under age 15: 19.9% (9th highest)
> Share of households occupied by families: 59.0% (the lowest)

5. Minnesota
> Est. annual child care costs (2 children): $20,635
> Median family income: $92,692 (9th highest)
> Share of population under age 15: 19.3% (16th highest)
> Share of households occupied by families: 63.6% (17th lowest)
[in-text-ad]
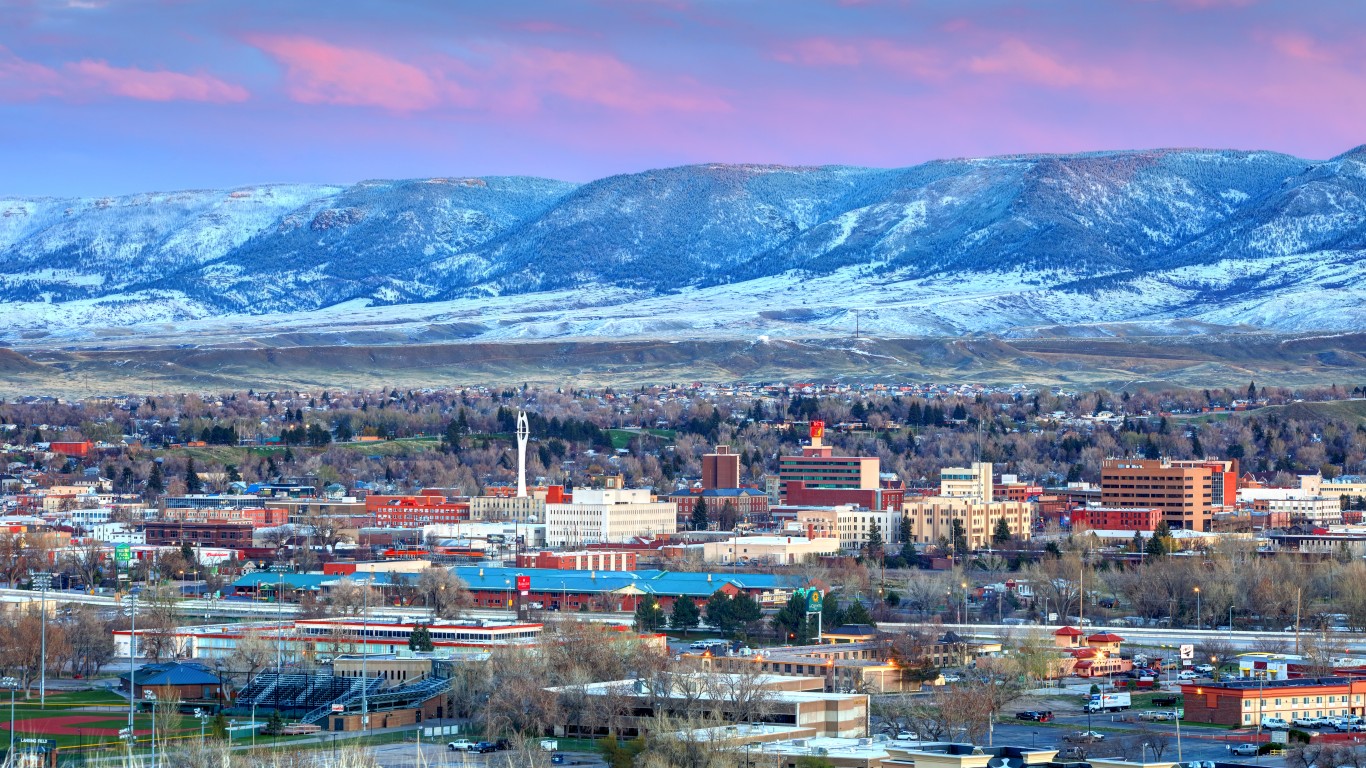
4. Wyoming
> Est. annual child care costs (2 children): $20,746
> Median family income: $81,290 (20th highest)
> Share of population under age 15: 19.4% (13th highest)
> Share of households occupied by families: 64.0% (23rd lowest)

3. Alaska
> Est. annual child care costs (2 children): $22,447
> Median family income: $92,648 (10th highest)
> Share of population under age 15: 21.0% (3rd highest)
> Share of households occupied by families: 65.8% (12th highest)

2. Massachusetts
> Est. annual child care costs (2 children): $26,377
> Median family income: $106,526 (the highest)
> Share of population under age 15: 16.2% (5th lowest)
> Share of households occupied by families: 63.2% (13th lowest)
[in-text-ad-2]

1. New York
> Est. annual child care costs (2 children): $31,874
> Median family income: $87,270 (14th highest)
> Share of population under age 15: 17.3% (11th lowest)
> Share of households occupied by families: 63.0% (11th lowest)
Methodology
To determine the states with the highest child care costs for a family of four, 24/7 Wall St. reviewed data from the Economic Policy Institute’s 2022 Family Budget Calculator.
In the Family Budget Calculator, the EPI estimates the annual child care budget necessary for families to maintain a modest yet adequate standard of living. The budgets are created for 10 family types for U.S. counties and metro areas. To estimate child care costs for a family of four, the EPI assumes families consist of a married couple with one 4-year-old child and one 8-year-old child.
State-level child care cost estimates are aggregated from the county level using five-year estimates of total households from the U.S. Census Bureau’s 2020 American Community Survey.
States are ranked based on the EPI’s annual child care cost estimates. Additional information on median family income, the share of the population that is under the age of 15, and the share of households that are occupied by families are from the U.S. Census Bureau’s 2020 American Community Survey. Because the Census Bureau did not release one-year estimates for 2020 due to data collection issues caused by the COVID-19 pandemic, all ACS data are five-year estimates.
The Average American Is Losing Momentum On Their Savings Every Day (Sponsor)
If you’re like many Americans and keep your money ‘safe’ in a checking or savings account, think again. The average yield on a savings account is a paltry .4%1 today. Checking accounts are even worse.
But there is good news. To win qualified customers, some accounts are paying more than 7x the national average. That’s an incredible way to keep your money safe and earn more at the same time. Our top pick for high yield savings accounts includes other benefits as well. You can earn a $200 bonus and up to 7X the national average with qualifying deposits. Terms apply. Member, FDIC.
Click here to see how much more you could be earning on your savings today. It takes just a few minutes to open an account to make your money work for you.
Thank you for reading! Have some feedback for us?
Contact the 24/7 Wall St. editorial team.
 24/7 Wall St.
 24/7 Wall St.