Motor vehicle theft, one of the most serious offenses tracked by the FBI, is on the rise in the United States. There were a total of 810,400 motor vehicle thefts nationwide in 2020, up 12% from the previous year and the most in over a decade.
Motor vehicle theft can be either the theft or attempted theft of a vehicle, such as a car or ATV. Some experts attribute the rising rates of vehicle theft to the COVID-19 pandemic, which led to vehicles sitting unattended and unused for longer stretches than usual. Here is a look at the 10 most stolen cars in America.
While cases of motor vehicle theft are surging across the country, some U.S. cities are bucking the national trend, reporting substantial year-over-year declines in vehicle theft cases per capita.
Using data from the FBI’s 2020 Uniform Crime Report, 24/7 Wall St. identified the 50 cities where vehicle theft is falling fastest. Cities – defined as places with more than 25,000 people – are ranked by the year-over-year change in the number of reported vehicle thefts per 100,000 people. Among the cities on this list, the vehicle theft rate fell anywhere from 82 incidents per 100,000 people to 274 per 100,000 people. Meanwhile, the national motor vehicle theft rate climbed by 25 incidents per 100,000 people in 2020.
Vehicle theft – along with larceny and burglary – is one component of the overall property crime category. Partially due to falling rates of vehicle theft, every city on this list with available data also reported a decline in the overall property crime rate in 2020. Here is a look at the cities where property crime is falling fastest.
Most of the cities that reported the largest declines in vehicle thefts per capita are in the West, including 15 in California alone. Despite the decline in cases of vehicle theft, in over half of the cities on this list, the vehicle theft rate remains higher than the national rate of 246 per 100,000 people.
Click here to see the cities where the motor vehicle theft rate is falling
Click here to read our detailed methodology

50. Visalia, California
> Change in reported vehicle theft rate, 2019-2020: -81.8
> Vehicle-thefts reported in 2020: 418 — 195th highest of 1,124 cities (tied)
> Vehicle-thefts per 100K people in 2020: 308.0 — 355th highest of 1,124 cities
> 1-yr. change in all property crime: -622.8 — 107th lowest of 1,037 cities
> Property crimes per 100K people in 2020: 2,267.0 — 439th highest of 1,043 cities
> Population: 132,104
[in-text-ad]

49. Albuquerque, New Mexico
> Change in reported vehicle theft rate, 2019-2020: -82.1
> Vehicle-thefts reported in 2020: 4,965 — 14th highest of 1,124 cities
> Vehicle-thefts per 100K people in 2020: 883.3 — 29th highest of 1,124 cities
> 1-yr. change in all property crime: N/A
> Property crimes per 100K people in 2020: 5,012.1 — 32nd highest of 1,043 cities
> Population: 559,374

48. Turlock, California
> Change in reported vehicle theft rate, 2019-2020: -82.7
> Vehicle-thefts reported in 2020: 377 — 212th highest of 1,124 cities
> Vehicle-thefts per 100K people in 2020: 508.2 — 146th highest of 1,124 cities
> 1-yr. change in all property crime: -354.5 — 276th lowest of 1,037 cities
> Property crimes per 100K people in 2020: 2,779.6 — 291st highest of 1,043 cities
> Population: 72,904

47. Middletown, Ohio
> Change in reported vehicle theft rate, 2019-2020: -83.6
> Vehicle-thefts reported in 2020: 99 — 520th lowest of 1,124 cities (tied)
> Vehicle-thefts per 100K people in 2020: 202.8 — 554th highest of 1,124 cities
> 1-yr. change in all property crime: -588.1 — 122nd lowest of 1,037 cities
> Property crimes per 100K people in 2020: 2,396.9 — 394th highest of 1,043 cities
> Population: 48,621
[in-text-ad-2]
46. Williston, North Dakota
> Change in reported vehicle theft rate, 2019-2020: -83.6
> Vehicle-thefts reported in 2020: 63 — 371st lowest of 1,124 cities (tied)
> Vehicle-thefts per 100K people in 2020: 202.9 — 551st highest of 1,124 cities
> 1-yr. change in all property crime: -409.4 — 237th lowest of 1,037 cities
> Property crimes per 100K people in 2020: 2,335.2 — 412th highest of 1,043 cities
> Population: 27,250

45. North Miami, Florida
> Change in reported vehicle theft rate, 2019-2020: -84.3
> Vehicle-thefts reported in 2020: 205 — 367th highest of 1,124 cities
> Vehicle-thefts per 100K people in 2020: 324.8 — 331st highest of 1,124 cities
> 1-yr. change in all property crime: -634.3 — 101st lowest of 1,037 cities
> Property crimes per 100K people in 2020: 3,181.8 — 199th highest of 1,043 cities
> Population: 62,489
[in-text-ad]

44. Jersey City, New Jersey
> Change in reported vehicle theft rate, 2019-2020: -85.8
> Vehicle-thefts reported in 2020: 436 — 181st highest of 1,124 cities
> Vehicle-thefts per 100K people in 2020: 165.6 — 462nd lowest of 1,124 cities
> 1-yr. change in all property crime: -407.3 — 240th lowest of 1,037 cities
> Property crimes per 100K people in 2020: 1,496.5 — 301st lowest of 1,043 cities
> Population: 261,940

43. Adelanto, California
> Change in reported vehicle theft rate, 2019-2020: -85.8
> Vehicle-thefts reported in 2020: 84 — 461st lowest of 1,124 cities (tied)
> Vehicle-thefts per 100K people in 2020: 244.7 — 473rd highest of 1,124 cities
> 1-yr. change in all property crime: -445.3 — 213th lowest of 1,037 cities
> Property crimes per 100K people in 2020: 885.5 — 94th lowest of 1,043 cities
> Population: 33,660

42. North Little Rock, Arkansas
> Change in reported vehicle theft rate, 2019-2020: -86.4
> Vehicle-thefts reported in 2020: 317 — 245th highest of 1,124 cities (tied)
> Vehicle-thefts per 100K people in 2020: 478.1 — 166th highest of 1,124 cities
> 1-yr. change in all property crime: -52.5 — 408th highest of 1,037 cities
> Property crimes per 100K people in 2020: 3,669.5 — 122nd highest of 1,043 cities
> Population: 66,075
[in-text-ad-2]

41. Spokane, Washington
> Change in reported vehicle theft rate, 2019-2020: -86.8
> Vehicle-thefts reported in 2020: 1,103 — 64th highest of 1,124 cities
> Vehicle-thefts per 100K people in 2020: 493.5 — 155th highest of 1,124 cities
> 1-yr. change in all property crime: -768.2 — 66th lowest of 1,037 cities
> Property crimes per 100K people in 2020: 5,151.1 — 24th highest of 1,043 cities
> Population: 217,353

40. Ocala, Florida
> Change in reported vehicle theft rate, 2019-2020: -88.0
> Vehicle-thefts reported in 2020: 112 — 556th highest of 1,124 cities (tied)
> Vehicle-thefts per 100K people in 2020: 182.8 — 510th lowest of 1,124 cities
> 1-yr. change in all property crime: -1,022.2 — 32nd lowest of 1,037 cities
> Property crimes per 100K people in 2020: 3,159.5 — 208th highest of 1,043 cities
> Population: 59,267
[in-text-ad]
39. Suisun City, California
> Change in reported vehicle theft rate, 2019-2020: -89.4
> Vehicle-thefts reported in 2020: 89 — 480th lowest of 1,124 cities (tied)
> Vehicle-thefts per 100K people in 2020: 298.2 — 371st highest of 1,124 cities
> 1-yr. change in all property crime: -258.8 — 364th lowest of 1,037 cities
> Property crimes per 100K people in 2020: 1,960.3 — 498th lowest of 1,043 cities
> Population: 29,488
38. Fountain, Colorado
> Change in reported vehicle theft rate, 2019-2020: -91.8
> Vehicle-thefts reported in 2020: 60 — 356th lowest of 1,124 cities (tied)
> Vehicle-thefts per 100K people in 2020: 191.7 — 536th lowest of 1,124 cities
> 1-yr. change in all property crime: -170.9 — 485th lowest of 1,037 cities
> Property crimes per 100K people in 2020: 1,971.4 — 502nd lowest of 1,043 cities
> Population: 29,784

37. Bullhead City, Arizona
> Change in reported vehicle theft rate, 2019-2020: -96.7
> Vehicle-thefts reported in 2020: 98 — 516th lowest of 1,124 cities (tied)
> Vehicle-thefts per 100K people in 2020: 238.8 — 482nd highest of 1,124 cities
> 1-yr. change in all property crime: -630.6 — 103rd lowest of 1,037 cities
> Property crimes per 100K people in 2020: 2,705.0 — 312th highest of 1,043 cities
> Population: 40,252
[in-text-ad-2]

36. Apopka, Florida
> Change in reported vehicle theft rate, 2019-2020: -97.3
> Vehicle-thefts reported in 2020: 96 — 506th lowest of 1,124 cities (tied)
> Vehicle-thefts per 100K people in 2020: 175.0 — 486th lowest of 1,124 cities
> 1-yr. change in all property crime: -962.6 — 37th lowest of 1,037 cities
> Property crimes per 100K people in 2020: 2,543.7 — 352nd highest of 1,043 cities
> Population: 51,800

35. Merced, California
> Change in reported vehicle theft rate, 2019-2020: -97.5
> Vehicle-thefts reported in 2020: 427 — 187th highest of 1,124 cities
> Vehicle-thefts per 100K people in 2020: 507.1 — 147th highest of 1,124 cities
> 1-yr. change in all property crime: -478.1 — 186th lowest of 1,037 cities
> Property crimes per 100K people in 2020: 2,314.8 — 419th highest of 1,043 cities
> Population: 82,662
[in-text-ad]

34. Chico, California
> Change in reported vehicle theft rate, 2019-2020: -97.7
> Vehicle-thefts reported in 2020: 316 — 247th highest of 1,124 cities (tied)
> Vehicle-thefts per 100K people in 2020: 299.9 — 368th highest of 1,124 cities
> 1-yr. change in all property crime: -505.2 — 165th lowest of 1,037 cities
> Property crimes per 100K people in 2020: 2,005.6 — 510th lowest of 1,043 cities
> Population: 94,529

33. St. Joseph, Missouri
> Change in reported vehicle theft rate, 2019-2020: -97.7
> Vehicle-thefts reported in 2020: 556 — 140th highest of 1,124 cities
> Vehicle-thefts per 100K people in 2020: 744.5 — 51st highest of 1,124 cities
> 1-yr. change in all property crime: -594.0 — 119th lowest of 1,037 cities
> Property crimes per 100K people in 2020: 5,146.0 — 25th highest of 1,043 cities
> Population: 75,913

32. Sumter, South Carolina
> Change in reported vehicle theft rate, 2019-2020: -98.6
> Vehicle-thefts reported in 2020: 69 — 401st lowest of 1,124 cities (tied)
> Vehicle-thefts per 100K people in 2020: 174.5 — 484th lowest of 1,124 cities
> 1-yr. change in all property crime: -851.8 — 52nd lowest of 1,037 cities
> Property crimes per 100K people in 2020: 3,689.7 — 117th highest of 1,043 cities
> Population: 39,800
[in-text-ad-2]
31. Mint Hill, North Carolina
> Change in reported vehicle theft rate, 2019-2020: -101.9
> Vehicle-thefts reported in 2020: 20 — 97th lowest of 1,124 cities (tied)
> Vehicle-thefts per 100K people in 2020: 70.9 — 160th lowest of 1,124 cities
> 1-yr. change in all property crime: -99.2 — 467th highest of 1,037 cities
> Property crimes per 100K people in 2020: 1,279.7 — 213th lowest of 1,043 cities
> Population: 26,697

30. Muskegon, Michigan
> Change in reported vehicle theft rate, 2019-2020: -102.4
> Vehicle-thefts reported in 2020: 90 — 486th lowest of 1,124 cities (tied)
> Vehicle-thefts per 100K people in 2020: 247.3 — 469th highest of 1,124 cities
> 1-yr. change in all property crime: -718.9 — 78th lowest of 1,037 cities
> Property crimes per 100K people in 2020: 2,758.9 — 296th highest of 1,043 cities
> Population: 37,633
[in-text-ad]
29. Salinas, California
> Change in reported vehicle theft rate, 2019-2020: -104.1
> Vehicle-thefts reported in 2020: 912 — 83rd highest of 1,124 cities
> Vehicle-thefts per 100K people in 2020: 584.7 — 109th highest of 1,124 cities
> 1-yr. change in all property crime: -18.9 — 362nd highest of 1,037 cities
> Property crimes per 100K people in 2020: 2,231.6 — 461st highest of 1,043 cities
> Population: 156,143
28. Petersburg, Virginia
> Change in reported vehicle theft rate, 2019-2020: -104.6
> Vehicle-thefts reported in 2020: 110 — 558th lowest of 1,124 cities (tied)
> Vehicle-thefts per 100K people in 2020: 352.6 — 282nd highest of 1,124 cities
> 1-yr. change in all property crime: -719.4 — 77th lowest of 1,037 cities
> Property crimes per 100K people in 2020: 2,587.0 — 342nd highest of 1,043 cities
> Population: 31,362
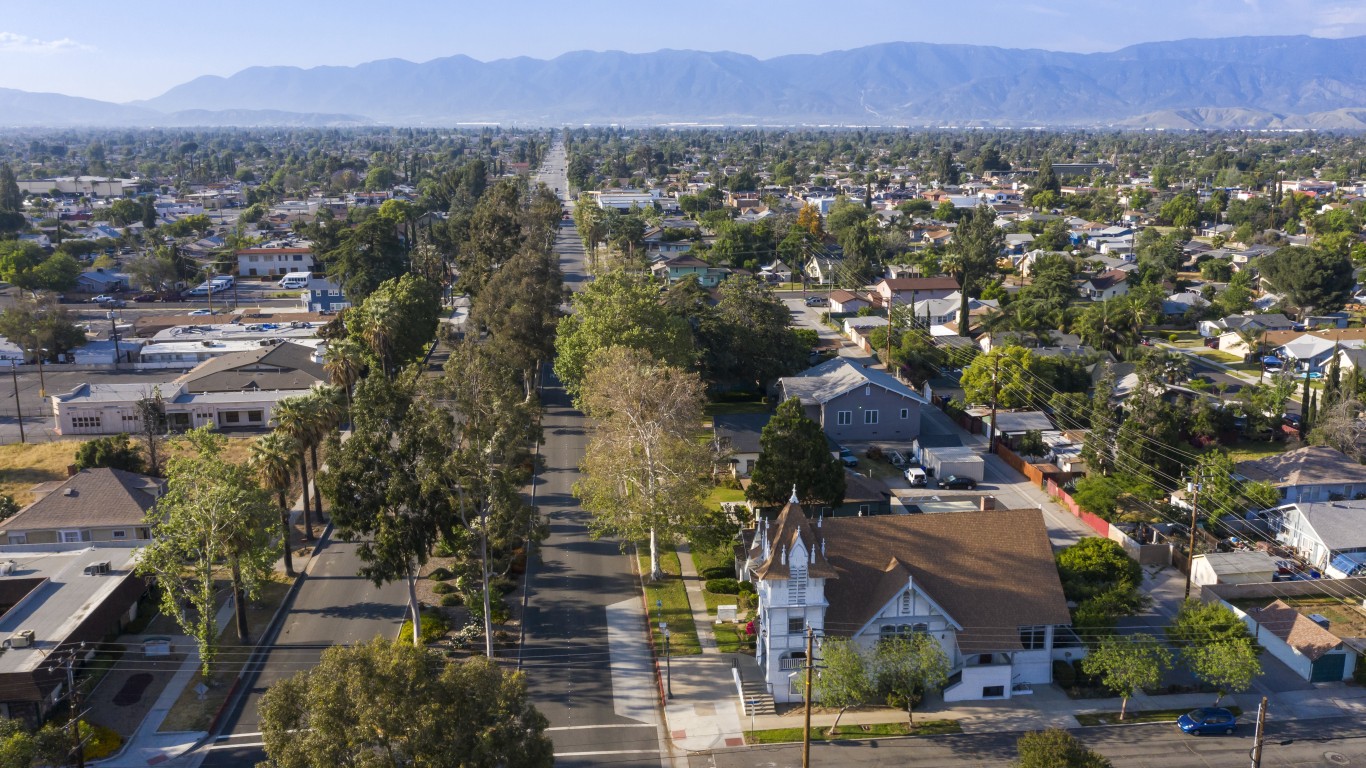
27. Rialto, California
> Change in reported vehicle theft rate, 2019-2020: -105.0
> Vehicle-thefts reported in 2020: 458 — 170th highest of 1,124 cities
> Vehicle-thefts per 100K people in 2020: 440.4 — 194th highest of 1,124 cities
> 1-yr. change in all property crime: -601.1 — 117th lowest of 1,037 cities
> Property crimes per 100K people in 2020: 2,427.8 — 379th highest of 1,043 cities
> Population: 103,045
[in-text-ad-2]

26. Burton, Michigan
> Change in reported vehicle theft rate, 2019-2020: -108.3
> Vehicle-thefts reported in 2020: 57 — 331st lowest of 1,124 cities (tied)
> Vehicle-thefts per 100K people in 2020: 200.5 — 561st highest of 1,124 cities
> 1-yr. change in all property crime: N/A
> Property crimes per 100K people in 2020: 2,279.5 — 433rd highest of 1,043 cities
> Population: 28,654

25. Richmond, Virginia
> Change in reported vehicle theft rate, 2019-2020: -108.3
> Vehicle-thefts reported in 2020: 611 — 126th highest of 1,124 cities (tied)
> Vehicle-thefts per 100K people in 2020: 261.8 — 435th highest of 1,124 cities
> 1-yr. change in all property crime: -578.5 — 127th lowest of 1,037 cities
> Property crimes per 100K people in 2020: 2,920.9 — 253rd highest of 1,043 cities
> Population: 226,622
[in-text-ad]

24. Everett, Washington
> Change in reported vehicle theft rate, 2019-2020: -108.5
> Vehicle-thefts reported in 2020: 703 — 105th highest of 1,124 cities
> Vehicle-thefts per 100K people in 2020: 625.2 — 91st highest of 1,124 cities
> 1-yr. change in all property crime: -304.0 — 317th lowest of 1,037 cities
> Property crimes per 100K people in 2020: 3,249.8 — 188th highest of 1,043 cities
> Population: 109,766
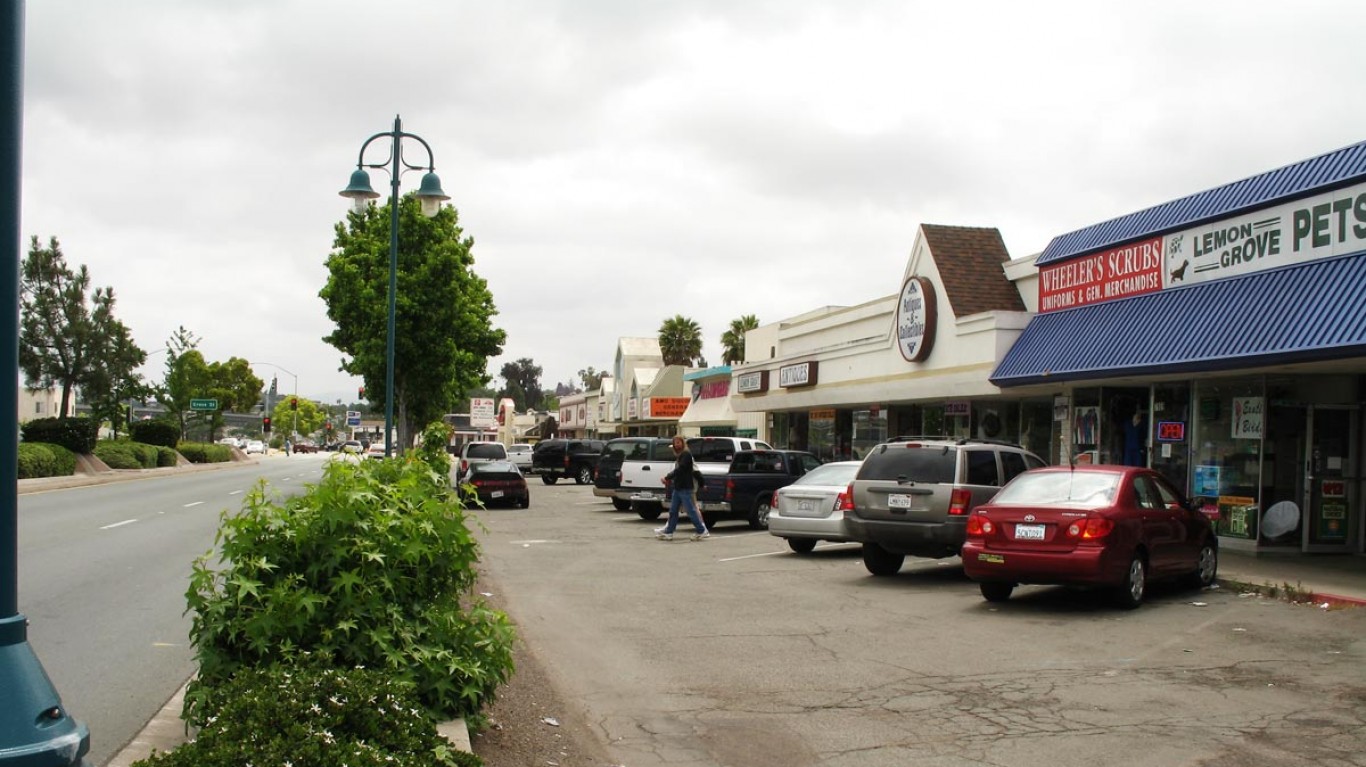
23. Lemon Grove, California
> Change in reported vehicle theft rate, 2019-2020: -111.6
> Vehicle-thefts reported in 2020: 89 — 480th lowest of 1,124 cities (tied)
> Vehicle-thefts per 100K people in 2020: 329.9 — 321st highest of 1,124 cities
> 1-yr. change in all property crime: -474.3 — 189th lowest of 1,037 cities
> Property crimes per 100K people in 2020: 1,557.0 — 330th lowest of 1,043 cities
> Population: 26,802
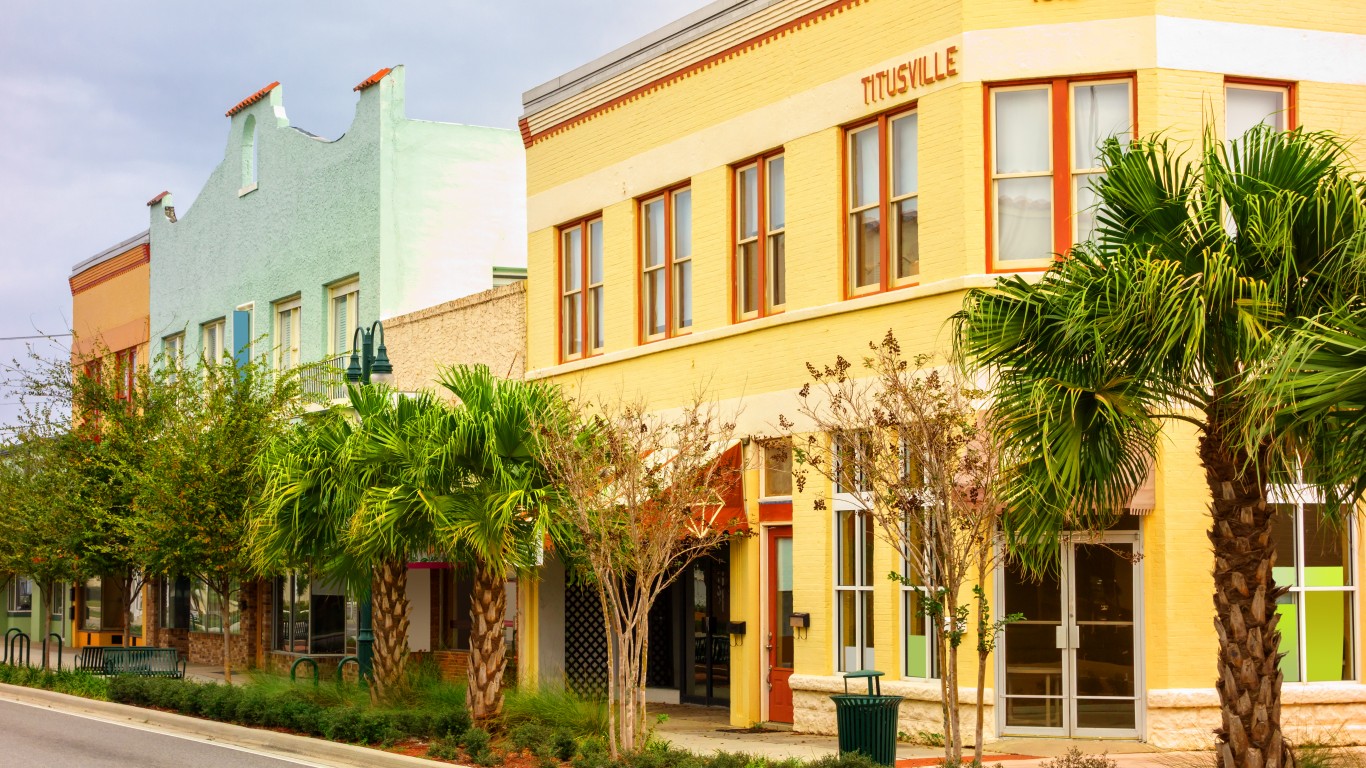
22. Titusville, Florida
> Change in reported vehicle theft rate, 2019-2020: -115.5
> Vehicle-thefts reported in 2020: 118 — 540th highest of 1,124 cities (tied)
> Vehicle-thefts per 100K people in 2020: 251.5 — 457th highest of 1,124 cities
> 1-yr. change in all property crime: -879.6 — 46th lowest of 1,037 cities
> Property crimes per 100K people in 2020: 2,304.0 — 427th highest of 1,043 cities
> Population: 45,932
[in-text-ad-2]

21. Gresham, Oregon
> Change in reported vehicle theft rate, 2019-2020: -116.9
> Vehicle-thefts reported in 2020: 906 — 85th highest of 1,124 cities
> Vehicle-thefts per 100K people in 2020: 825.4 — 38th highest of 1,124 cities
> 1-yr. change in all property crime: -305.4 — 316th lowest of 1,037 cities
> Property crimes per 100K people in 2020: 2,804.1 — 282nd highest of 1,043 cities
> Population: 110,494
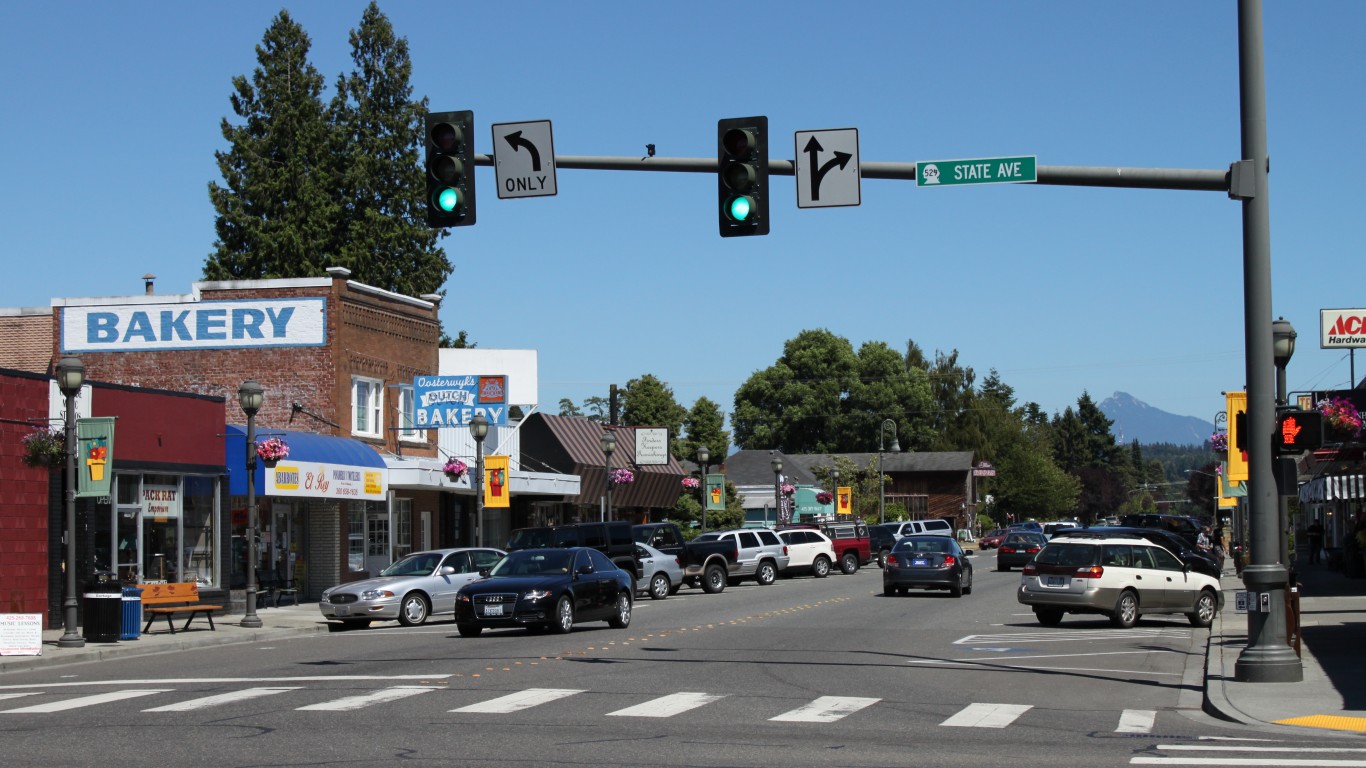
20. Marysville, Washington
> Change in reported vehicle theft rate, 2019-2020: -118.0
> Vehicle-thefts reported in 2020: 142 — 473rd highest of 1,124 cities (tied)
> Vehicle-thefts per 100K people in 2020: 198.5 — 559th lowest of 1,124 cities
> 1-yr. change in all property crime: -568.7 — 133rd lowest of 1,037 cities
> Property crimes per 100K people in 2020: 1,406.6 — 259th lowest of 1,043 cities
> Population: 68,633
[in-text-ad]
19. Delano, California
> Change in reported vehicle theft rate, 2019-2020: -118.7
> Vehicle-thefts reported in 2020: 252 — 306th highest of 1,124 cities (tied)
> Vehicle-thefts per 100K people in 2020: 469.9 — 172nd highest of 1,124 cities
> 1-yr. change in all property crime: -513.1 — 161st lowest of 1,037 cities
> Property crimes per 100K people in 2020: 1,596.3 — 346th lowest of 1,043 cities
> Population: 52,886
18. Elizabethtown, Kentucky
> Change in reported vehicle theft rate, 2019-2020: -122.3
> Vehicle-thefts reported in 2020: 36 — 194th lowest of 1,124 cities (tied)
> Vehicle-thefts per 100K people in 2020: 118.0 — 319th lowest of 1,124 cities
> 1-yr. change in all property crime: -550.1 — 146th lowest of 1,037 cities
> Property crimes per 100K people in 2020: 937.6 — 109th lowest of 1,043 cities
> Population: 29,620

17. Porterville, California
> Change in reported vehicle theft rate, 2019-2020: -124.1
> Vehicle-thefts reported in 2020: 173 — 415th highest of 1,124 cities (tied)
> Vehicle-thefts per 100K people in 2020: 289.5 — 393rd highest of 1,124 cities
> 1-yr. change in all property crime: -453.9 — 205th lowest of 1,037 cities
> Property crimes per 100K people in 2020: 1,700.2 — 389th lowest of 1,043 cities
> Population: 59,697
[in-text-ad-2]
16. Warren, Ohio
> Change in reported vehicle theft rate, 2019-2020: -125.5
> Vehicle-thefts reported in 2020: 59 — 346th lowest of 1,124 cities (tied)
> Vehicle-thefts per 100K people in 2020: 153.4 — 424th lowest of 1,124 cities
> 1-yr. change in all property crime: -1,098.5 — 21st lowest of 1,037 cities
> Property crimes per 100K people in 2020: 2,789.8 — 287th highest of 1,043 cities
> Population: 39,307
15. Big Spring, Texas
> Change in reported vehicle theft rate, 2019-2020: -127.5
> Vehicle-thefts reported in 2020: 109 — 556th lowest of 1,124 cities (tied)
> Vehicle-thefts per 100K people in 2020: 385.2 — 239th highest of 1,124 cities
> 1-yr. change in all property crime: -864.5 — 49th lowest of 1,037 cities
> Property crimes per 100K people in 2020: 2,845.1 — 274th highest of 1,043 cities
> Population: 28,041
[in-text-ad]

14. Anchorage, Alaska
> Change in reported vehicle theft rate, 2019-2020: -130.9
> Vehicle-thefts reported in 2020: 1,149 — 59th highest of 1,124 cities
> Vehicle-thefts per 100K people in 2020: 401.2 — 226th highest of 1,124 cities
> 1-yr. change in all property crime: -814.2 — 58th lowest of 1,037 cities
> Property crimes per 100K people in 2020: 3,447.1 — 150th highest of 1,043 cities
> Population: 293,531

13. Paterson, New Jersey
> Change in reported vehicle theft rate, 2019-2020: -140.9
> Vehicle-thefts reported in 2020: 252 — 306th highest of 1,124 cities (tied)
> Vehicle-thefts per 100K people in 2020: 173.9 — 483rd lowest of 1,124 cities
> 1-yr. change in all property crime: -671.8 — 90th lowest of 1,037 cities
> Property crimes per 100K people in 2020: 1,490.2 — 299th lowest of 1,043 cities
> Population: 145,710

12. Colorado Springs, Colorado
> Change in reported vehicle theft rate, 2019-2020: -143.3
> Vehicle-thefts reported in 2020: 2,432 — 38th highest of 1,124 cities
> Vehicle-thefts per 100K people in 2020: 501.4 — 149th highest of 1,124 cities
> 1-yr. change in all property crime: -287.0 — 333rd lowest of 1,037 cities
> Property crimes per 100K people in 2020: 3,379.6 — 166th highest of 1,043 cities
> Population: 464,871
[in-text-ad-2]

11. Juneau, Alaska
> Change in reported vehicle theft rate, 2019-2020: -148.3
> Vehicle-thefts reported in 2020: 46 — 269th lowest of 1,124 cities (tied)
> Vehicle-thefts per 100K people in 2020: 144.1 — 391st lowest of 1,124 cities
> 1-yr. change in all property crime: -1,098.4 — 22nd lowest of 1,037 cities
> Property crimes per 100K people in 2020: 2,963.2 — 248th highest of 1,043 cities
> Population: 32,227

10. Great Falls, Montana
> Change in reported vehicle theft rate, 2019-2020: -152.0
> Vehicle-thefts reported in 2020: 171 — 421st highest of 1,124 cities (tied)
> Vehicle-thefts per 100K people in 2020: 293.1 — 383rd highest of 1,124 cities
> 1-yr. change in all property crime: -666.8 — 94th lowest of 1,037 cities
> Property crimes per 100K people in 2020: 5,140.1 — 26th highest of 1,043 cities
> Population: 58,835
[in-text-ad]
9. Ceres, California
> Change in reported vehicle theft rate, 2019-2020: -155.8
> Vehicle-thefts reported in 2020: 214 — 354th highest of 1,124 cities
> Vehicle-thefts per 100K people in 2020: 436.5 — 195th highest of 1,124 cities
> 1-yr. change in all property crime: -525.2 — 157th lowest of 1,037 cities
> Property crimes per 100K people in 2020: 1,831.6 — 449th lowest of 1,043 cities
> Population: 48,214

8. San Bernardino, California
> Change in reported vehicle theft rate, 2019-2020: -169.0
> Vehicle-thefts reported in 2020: 1,709 — 47th highest of 1,124 cities
> Vehicle-thefts per 100K people in 2020: 789.9 — 44th highest of 1,124 cities
> 1-yr. change in all property crime: -1,389.9 — 10th lowest of 1,037 cities
> Property crimes per 100K people in 2020: 2,800.4 — 283rd highest of 1,043 cities
> Population: 216,089
7. Wildomar, California
> Change in reported vehicle theft rate, 2019-2020: -186.3
> Vehicle-thefts reported in 2020: 90 — 486th lowest of 1,124 cities (tied)
> Vehicle-thefts per 100K people in 2020: 238.0 — 485th highest of 1,124 cities
> 1-yr. change in all property crime: -578.7 — 126th lowest of 1,037 cities
> Property crimes per 100K people in 2020: 1,100.3 — 164th lowest of 1,043 cities
> Population: 36,445
[in-text-ad-2]
6. Panama City, Florida
> Change in reported vehicle theft rate, 2019-2020: -187.2
> Vehicle-thefts reported in 2020: 142 — 473rd highest of 1,124 cities (tied)
> Vehicle-thefts per 100K people in 2020: 409.6 — 216th highest of 1,124 cities
> 1-yr. change in all property crime: -954.6 — 39th lowest of 1,037 cities
> Property crimes per 100K people in 2020: 4,190.7 — 75th highest of 1,043 cities
> Population: 36,640

5. Columbia, South Carolina
> Change in reported vehicle theft rate, 2019-2020: -187.8
> Vehicle-thefts reported in 2020: 634 — 122nd highest of 1,124 cities
> Vehicle-thefts per 100K people in 2020: 481.1 — 164th highest of 1,124 cities
> 1-yr. change in all property crime: -776.5 — 63rd lowest of 1,037 cities
> Property crimes per 100K people in 2020: 4,475.7 — 60th highest of 1,043 cities
> Population: 133,273
[in-text-ad]

4. Detroit, Michigan
> Change in reported vehicle theft rate, 2019-2020: -192.2
> Vehicle-thefts reported in 2020: 5,578 — 13th highest of 1,124 cities
> Vehicle-thefts per 100K people in 2020: 845.6 — 35th highest of 1,124 cities
> 1-yr. change in all property crime: -1,092.3 — 23rd lowest of 1,037 cities
> Property crimes per 100K people in 2020: 3,210.7 — 192nd highest of 1,043 cities
> Population: 674,841
3. Calexico, California
> Change in reported vehicle theft rate, 2019-2020: -193.6
> Vehicle-thefts reported in 2020: 101 — 532nd lowest of 1,124 cities (tied)
> Vehicle-thefts per 100K people in 2020: 252.8 — 454th highest of 1,124 cities
> 1-yr. change in all property crime: -202.2 — 437th lowest of 1,037 cities
> Property crimes per 100K people in 2020: 2,014.7 — 513th lowest of 1,043 cities
> Population: 39,946

2. North Charleston, South Carolina
> Change in reported vehicle theft rate, 2019-2020: -258.2
> Vehicle-thefts reported in 2020: 680 — 112th highest of 1,124 cities
> Vehicle-thefts per 100K people in 2020: 578.7 — 113th highest of 1,124 cities
> 1-yr. change in all property crime: -914.8 — 42nd lowest of 1,037 cities
> Property crimes per 100K people in 2020: 5,104.6 — 29th highest of 1,043 cities
> Population: 111,501
[in-text-ad-2]
1. Federal Way, Washington
> Change in reported vehicle theft rate, 2019-2020: -274.2
> Vehicle-thefts reported in 2020: 332 — 237th highest of 1,124 cities
> Vehicle-thefts per 100K people in 2020: 342.0 — 300th highest of 1,124 cities
> 1-yr. change in all property crime: -1,629.2 — 7th lowest of 1,037 cities
> Property crimes per 100K people in 2020: 2,618.7 — 329th highest of 1,043 cities
> Population: 96,526
Methodology
To determine the cities where the motor vehicle theft rate is falling fastest, 24/7 Wall St. reviewed the change in motor vehicle theft rate per 100,000 people from the FBI’s 2019 and 2020 Uniform Crime Reports. Crime rates were calculated using population figures provided by the FBI in the 2020 and 2019 UCR.
Limited data was available in the 2020 UCR for areas in Alabama, Maryland, Pennsylvania, and Illinois, though cities in these states were not excluded from analysis. Because some state and local agencies changed reporting practices between 2019 and 2020, the figures are not comparable, and the areas were excluded.
To concentrate on urban areas, we excluded places with fewer than 25,000 people based on five-year estimates from the U.S. Census Bureau’s 2019 American Community Survey.
Thank you for reading! Have some feedback for us?
Contact the 24/7 Wall St. editorial team.
 24/7 Wall St.

 24/7 Wall St.


 24/7 Wall St.
