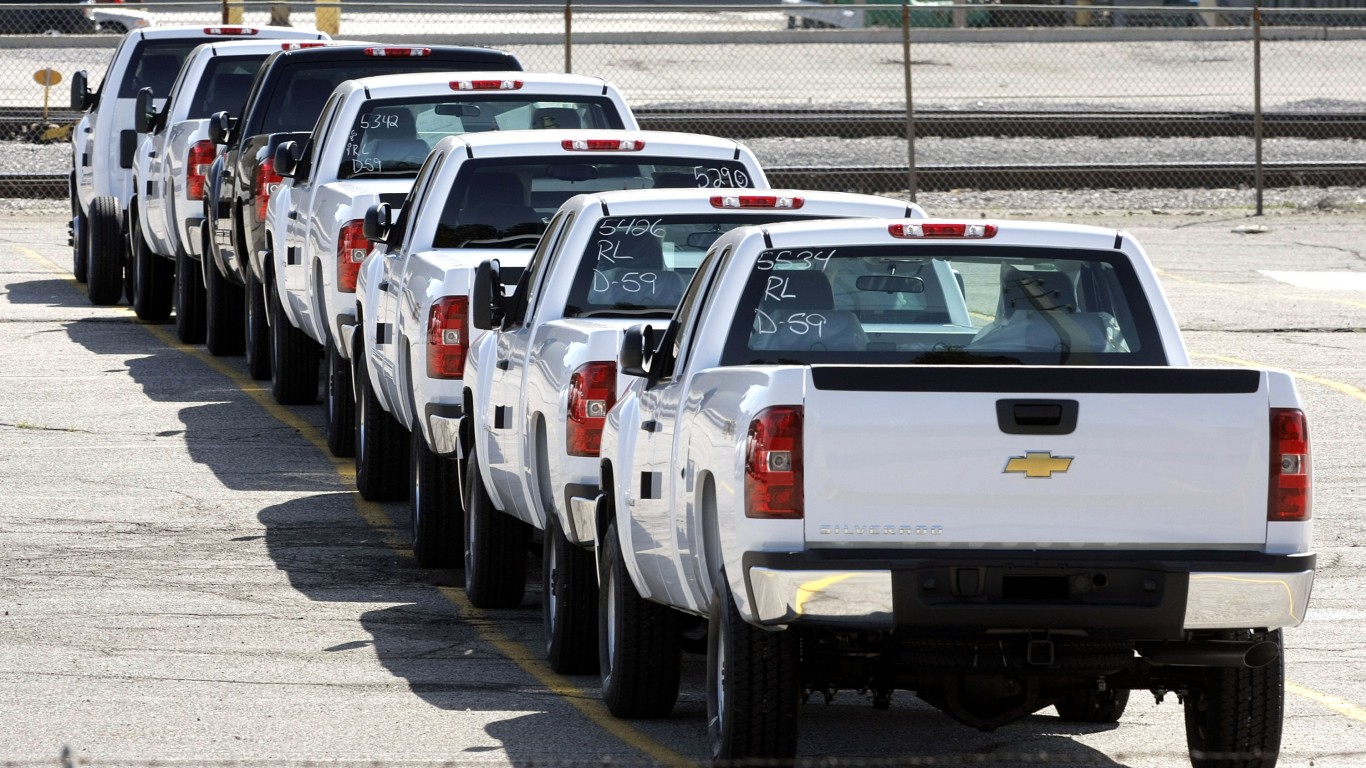
From the mid-20th century into the early 21st, America’s love affair with the automobile kept a car manufacturer (General Motors) and an oil company (Exxon) in the top five spots among the biggest U.S. companies. Americans drive both for work and pleasure, and they need gas to fuel their cars, so their success is hardly surprising.
Between 1955 and 1974, GM reigned as the country’s biggest corporation. After ‘74, GM and Exxon traded the No. 1 position back and forth for some years, with Ford and Mobil occasionally slipping in. (Exxon and Mobil merged in 1999 to become ExxonMobil.) It wasn’t until 2002 that retailing giant Walmart first overtook both as the nation’s largest corporation. Another interesting change occurred in 2019. Although Walmart held onto the top position, mega online retailer Amazon eased into second place.
E-commerce has clearly become the category to beat in recent years. According to Jungle Scout, a platform for e-commerce sellers, Walmart attributed $47.8 billion in net sales to e-commerce in fiscal year 2022. During the fiscal 2022 second quarter earnings call in August, Walmart president and CEO Doug McMillon estimated the global company’s online sales would hit $75 billion by the end of the year. (Online or otherwise, here are 29 things you should never buy at Walmart.)
Yet Amazon remains the undisputed king in the online sales arena. In its first quarter earnings report, Amazon reported net sales rose 7% to $116.4 billion in the first quarter, compared with $108.5 billion in the first quarter of 2021. In the coming years, Walmart and Amazon will likely be trading places as the biggest U.S. corporation. (These are the corporations that made skyrocketing profits in 2021.)
Click here to see the biggest US company the year you were born
To determine the biggest company the year you were born, 24/7 Wall St. reviewed annual revenue figures for companies on the Fortune 500 each year from 1955 through 2021, as well as data from company press releases and SEC financial filings. Some corporate names have changed over the years, but we’ve used the abbreviated popular name of each for clarity.

1955
1. General Motors: $9.82 billion
2. Exxon: $5.66 billion
3. U.S. Steel: $3.25 billion
4. General Electric: $2.96 billion
5. Esmark: $2.51 billion
[in-text-ad]

1956
1. General Motors: $12.44 billion
2. Exxon: $6.27 billion
3. Ford: $5.59 billion
4. U.S. Steel: $4.10 billion
5. Chrysler: $3.47 billion

1957
1. General Motors: $10.80 billion
2. Exxon: $7.13 billion
3. Ford: $4.65 billion
4. U.S. Steel: $4.23 billion
5. General Electric: $4.09 billion

1958
1. General Motors: $10.99 billion
2. Exxon: $7.83 billion
3. Ford: $5.77 billion
4. U.S. Steel: $4.41 billion
5. General Electric: $4.34 billion

1959
1. General Motors: $9.52 billion
2. Exxon: $7.54 billion
3. Ford: $4.13 billion
4. General Electric: $4.12 billion
5. U.S. Steel: $3.47 billion

1960
1. General Motors: $11.23 billion
2. Exxon: $7.91 billion
3. Ford: $5.36 billion
4. General Electric: $4.35 billion
5. U.S. Steel: $3.64 billion

1961
1. General Motors: $12.74 billion
2. Exxon: $8.04 billion
3. Ford: $5.24 billion
4. General Electric: $4.20 billion
5. U.S. Steel: $3.70 billion
[in-text-ad-2]

1962
1. General Motors: $11.40 billion
2. Exxon: $8.44 billion
3. Ford: $6.71 billion
4. General Electric: $4.46 billion
5. Mobil: $3.32 billion

1963
1. General Motors: $14.64 billion
2. Exxon: $9.54 billion
3. Ford: $8.09 billion
4. General Electric: $4.79 billion
5. Mobil: $3.93 billion

1964
1. General Motors: $16.50 billion
2. Exxon: $10.26 billion
3. Ford: $8.74 billion
4. General Electric: $4.92 billion
5. Mobil: $4.35 billion

1965
1. General Motors: $17.00 billion
2. Exxon: $10.82 billion
3. Ford: $9.67 billion
4. General Electric: $4.94 billion
5. Mobil: $4.50 billion
[in-text-ad]

1966
1. General Motors: $20.73 billion
2. Ford: $11.54 billion
3. Exxon: $11.47 billion
4. General Electric: $6.21 billion
5. Chrysler: $5.30 billion

1967
1. General Motors: $20.21 billion
2. Ford: $12.24 billion
3. Exxon: $12.19 billion
4. General Electric: $7.18 billion
5. Chrysler: $5.65 billion
1968
1. General Motors: $20.03 billion
2. Exxon: $13.27 billion
3. Ford: $10.52 billion
4. General Electric: $7.74 billion
5. Chrysler: $6.21 billion
1969
1. General Motors: $22.76 billion
2. Exxon: $14.09 billion
3. Ford: $14.08 billion
4. General Electric: $8.38 billion
5. Chrysler: $7.45 billion
1970
1. General Motors: $24.30 billion
2. Exxon: $14.93 billion
3. Ford: $14.76 billion
4. General Electric: $8.45 billion
5. IBM: $7.20 billion
1971
1. General Motors: $18.75 billion
2. Exxon: $16.55 billion
3. Ford: $14.98 billion
4. General Electric: $8.73 billion
5. IBM: $7.50 billion
[in-text-ad-2]

1972
1. General Motors: $28.26 billion
2. Exxon: $18.70 billion
3. Ford: $16.43 billion
4. General Electric: $9.43 billion
5. IBM: $8.27 billion

1973
1. General Motors: $30.44 billion
2. Exxon: $20.31 billion
3. Ford: $20.19 billion
4. General Electric: $10.24 billion
5. Chrysler: $9.76 billion

1974
1. General Motors: $35.80 billion
2. Exxon: $25.72 billion
3. Ford: $23.02 billion
4. Chrysler: $11.77 billion
5. General Electric: $11.58 billion

1975
1. Exxon: $42.06 billion
2. General Motors: $31.55 billion
3. Ford: $23.62 billion
4. Texaco: $23.26 billion
5. Mobil: $18.93 billion
[in-text-ad]

1976
1. Exxon: $44.87 billion
2. General Motors: $35.73 billion
3. Texaco: $24.51 billion
4. Ford: $24.01 billion
5. Mobil: $20.62 billion
1977
1. Exxon: $48.63 billion
2. General Motors: $47.18 billion
3. Ford: $28.84 billion
4. Texaco: $26.45 billion
5. Mobil: $26.06 billion

1978
1. General Motors: $54.96 billion
2. Exxon: $54.13 billion
3. Ford: $37.84 billion
4. Mobil: $32.13 billion
5. Texaco: $27.92 billion

1979
1. General Motors: $63.22 billion
2. Exxon: $60.34 billion
3. Ford: $42.78 billion
4. Mobil: $34.74 billion
5. Texaco: $28.61 billion

1980
1. Exxon: $79.11 billion
2. General Motors: $66.31 billion
3. Mobil: $44.72 billion
4. Ford: $43.51 billion
5. Texaco: $38.35 billion
1981
1. Exxon: $103.14 billion
2. Mobil: $59.51 billion
3. General Motors: $57.73 billion
4. Texaco: $51.20 billion
5. Chevron: $40.48 billion
[in-text-ad-2]
1982
1. Exxon: $108.11 billion
2. Mobil: $64.49 billion
3. General Motors: $62.70 billion
4. Texaco: $57.63 billion
5. Chevron: $44.22 billion
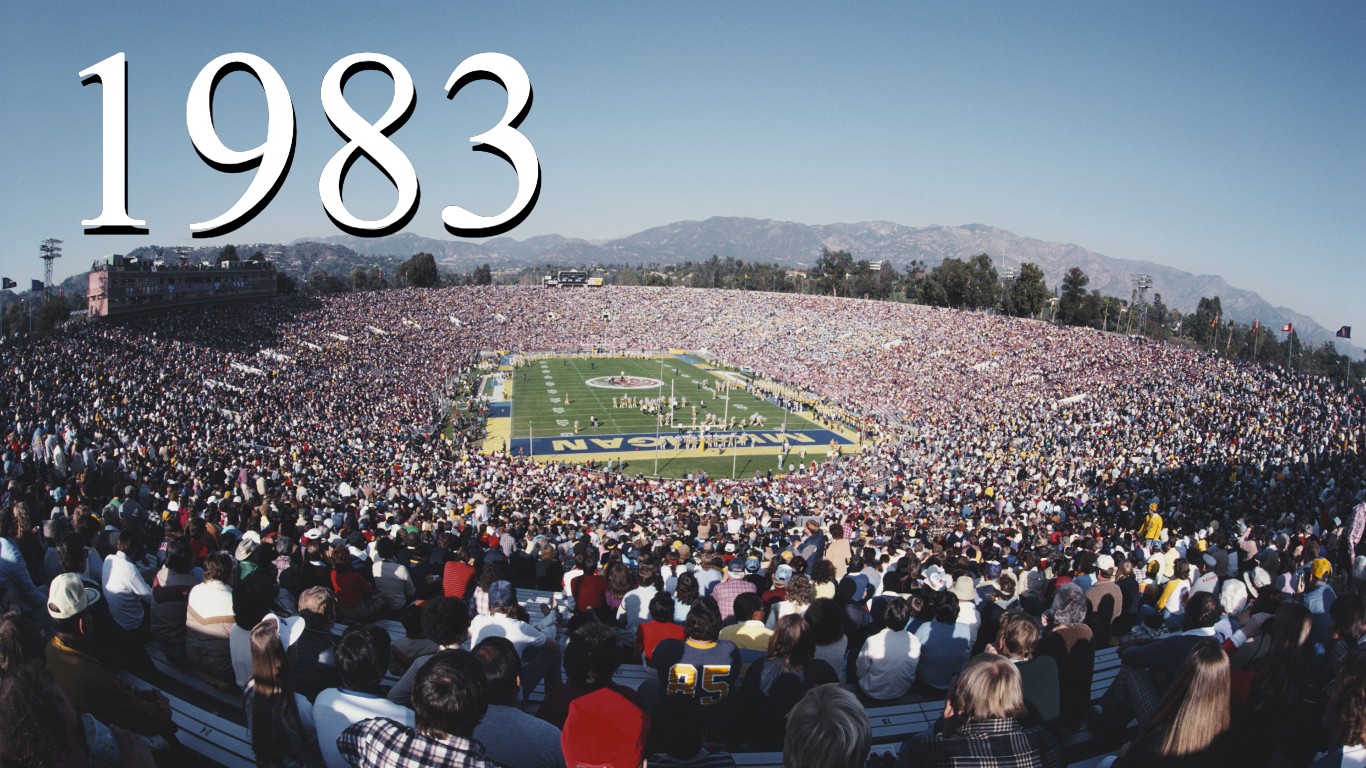
1983
1. Exxon: $97.17 billion
2. General Motors: $60.03 billion
3. Mobil: $59.95 billion
4. Texaco: $46.99 billion
5. Ford: $37.07 billion

1984
1. Exxon: $88.56 billion
2. General Motors: $74.58 billion
3. Mobil: $54.61 billion
4. Ford: $44.46 billion
5. IBM: $40.18 billion

1985
1. Exxon: $90.85 billion
2. General Motors: $83.89 billion
3. Mobil: $56.05 billion
4. Ford: $52.37 billion
5. Texaco: $47.33 billion
[in-text-ad]

1986
1. General Motors: $96.37 billion
2. Exxon: $86.67 billion
3. Mobil: $55.96 billion
4. Ford: $52.77 billion
5. IBM: $50.06 billion

1987
1. General Motors: $102.81 billion
2. Exxon: $69.89 billion
3. Ford: $62.72 billion
4. IBM: $51.25 billion
5. Mobil: $44.87 billion

1988
1. General Motors: $101.78 billion
2. Exxon: $76.42 billion
3. Ford: $71.64 billion
4. IBM: $54.22 billion
5. Mobil: $51.22 billion

1989
1. General Motors: $121.09 billion
2. Ford: $92.45 billion
3. Exxon: $79.56 billion
4. IBM: $59.68 billion
5. General Electric: $49.41 billion
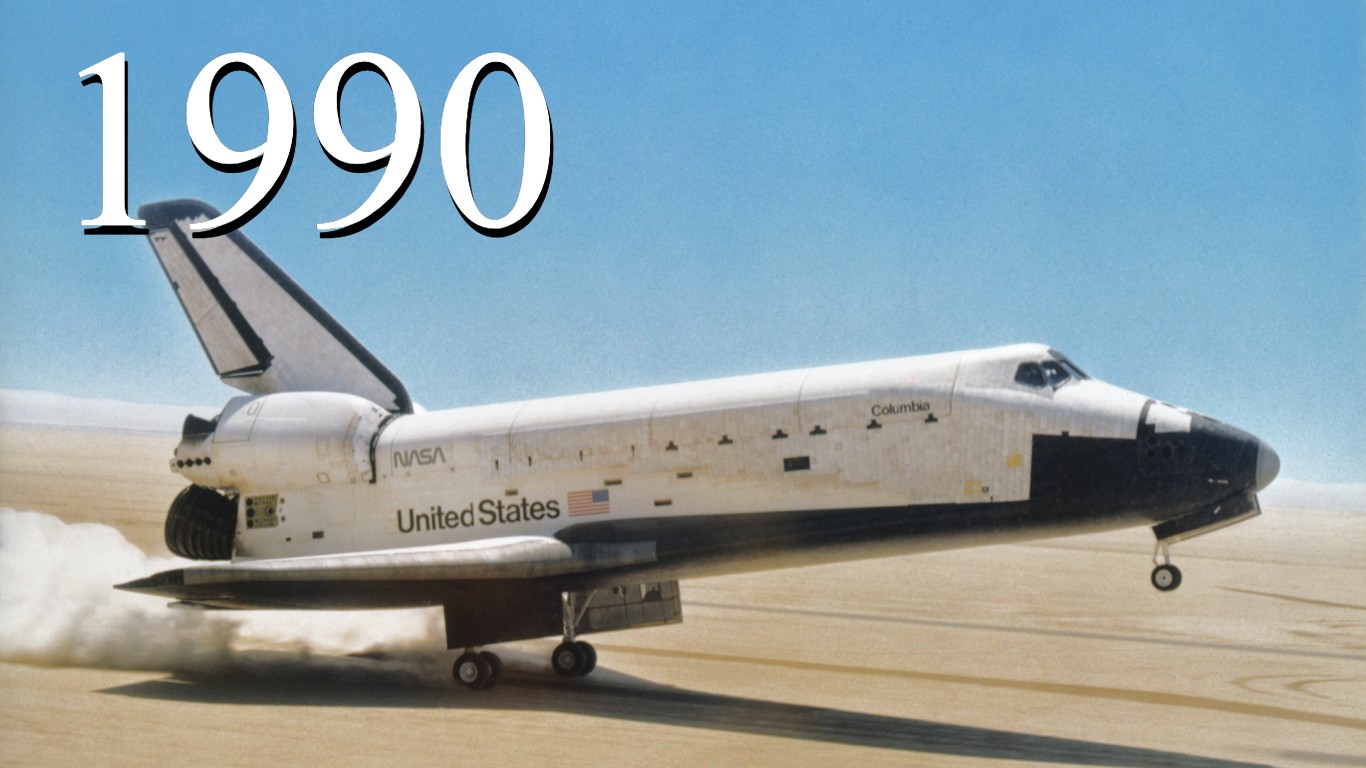
1990
1. General Motors: $126.97 billion
2. Ford: $96.93 billion
3. Exxon: $86.66 billion
4. IBM: $63.44 billion
5. General Electric: $55.26 billion
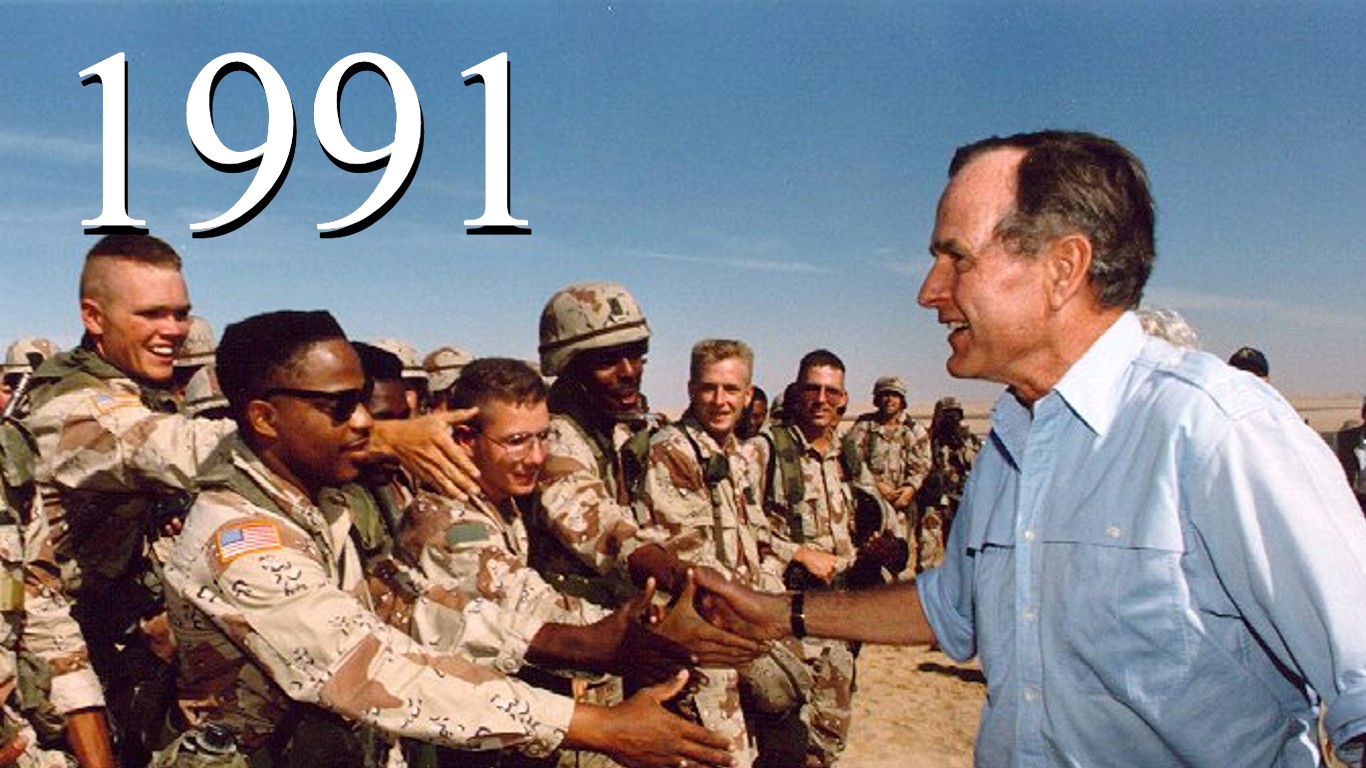
1991
1. General Motors: $125.13 billion
2. Exxon: $105.89 billion
3. Ford: $98.28 billion
4. IBM: $69.02 billion
5. Mobil: $58.77 billion
[in-text-ad-2]

1992
1. General Motors: $123.78 billion
2. Exxon: $103.24 billion
3. Ford: $88.96 billion
4. IBM: $65.39 billion
5. General Electric: $60.24 billion

1993
1. General Motors: $132.78 billion
2. Exxon: $103.55 billion
3. Ford: $100.79 billion
4. IBM: $65.10 billion
5. General Electric: $62.20 billion

1994
1. General Motors: $133.62 billion
2. Ford: $108.52 billion
3. Exxon: $97.83 billion
4. IBM: $62.72 billion
5. General Electric: $60.82 billion

1995
1. General Motors: $154.95 billion
2. Ford: $128.44 billion
3. Exxon: $101.46 billion
4. Walmart: $83.41 billion
5. AT&T: $75.09 billion
[in-text-ad]

1996
1. General Motors: $168.83 billion
2. Ford: $137.14 billion
3. Exxon: $110.01 billion
4. Walmart: $93.63 billion
5. AT&T: $79.61 billion

1997
1. General Motors: $168.37 billion
2. Ford: $146.99 billion
3. Exxon: $119.43 billion
4. Walmart: $106.15 billion
5. General Electric: $79.18 billion

1998
1. General Motors: $178.17 billion
2. Ford: $153.63 billion
3. Exxon: $122.38 billion
4. Walmart: $119.30 billion
5. General Electric: $90.84 billion

1999
1. General Motors: $161.32 billion
2. Ford: $144.42 billion
3. Walmart: $139.21 billion
4. ExxonMobil: $100.70 billion
5. General Electric: $100.47 billion

2000
1. General Motors: $189.06 billion
2. Walmart: $166.81 billion
3. ExxonMobil: $163.88 billion
4. Ford: $162.56 billion
5. General Electric: $111.63 billion

2001
1. ExxonMobil: $210.39 billion
2. Walmart: $193.30 billion
3. General Motors: $184.63 billion
4. Ford: $180.60 billion
5. General Electric: $129.85 billion
[in-text-ad-2]
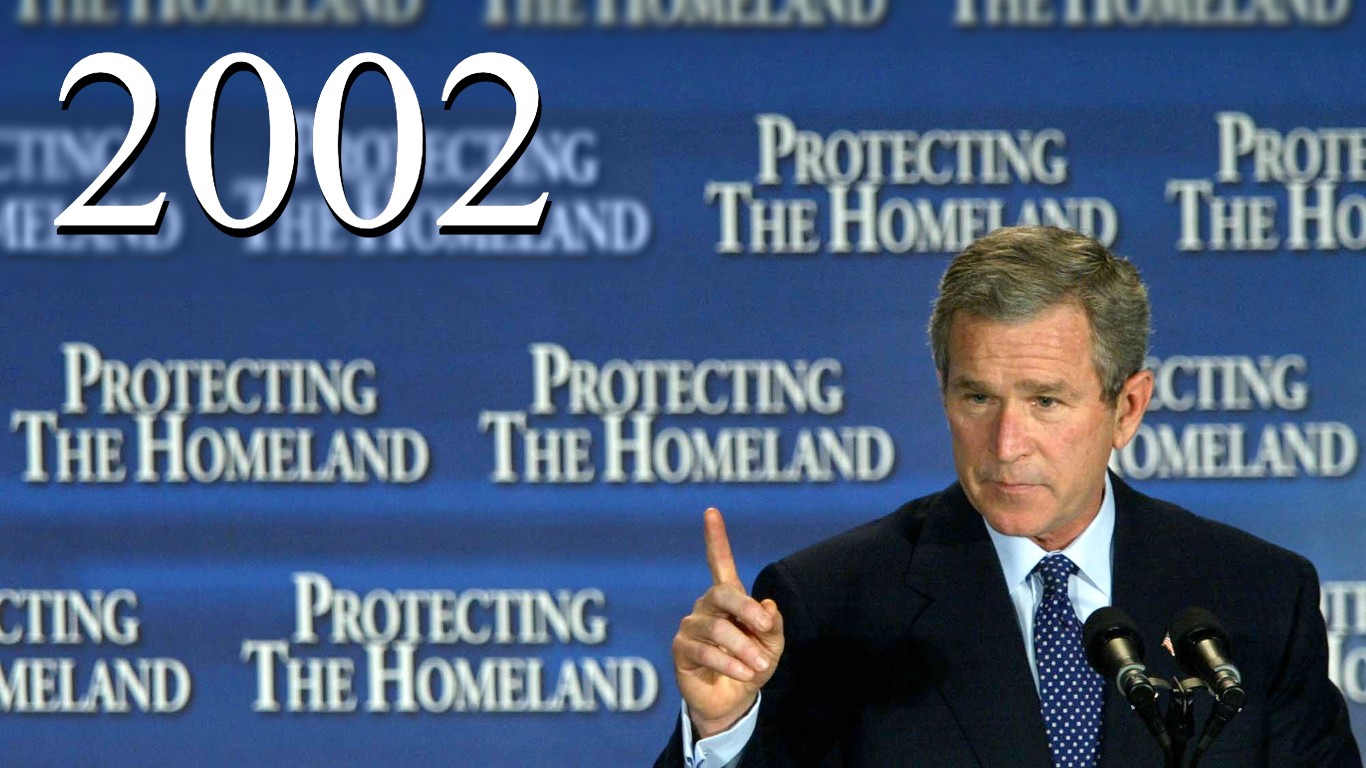
2002
1. Walmart: $219.81 billion
2. ExxonMobil: $191.58 billion
3. General Motors: $177.26 billion
4. Ford: $162.41 billion
5. Enron: $138.72 billion

2003
1. Walmart: $246.53 billion
2. General Motors: $186.76 billion
3. ExxonMobil: $182.47 billion
4. Ford: $163.63 billion
5. General Electric: $131.70 billion

2004
1. Walmart: $258.68 billion
2. ExxonMobil: $213.20 billion
3. General Motors: $195.65 billion
4. Ford: $164.50 billion
5. General Electric: $134.19 billion
2005
1. Walmart: $288.19 billion
2. ExxonMobil: $270.77 billion
3. General Motors: $193.52 billion
4. Ford: $172.23 billion
5. General Electric: $152.36 billion
[in-text-ad]

2006
1. ExxonMobil: $339.94 billion
2. Walmart: $315.65 billion
3. General Motors: $192.60 billion
4. Chevron: $189.48 billion
5. Ford: $177.21 billion
2007
1. Walmart: $351.14 billion
2. ExxonMobil: $347.25 billion
3. General Motors: $207.35 billion
4. Chevron: $200.57 billion
5. ConocoPhillips: $172.45 billion
2008
1. Walmart: $378.80 billion
2. ExxonMobil: $372.82 billion
3. Chevron: $210.78 billion
4. General Motors: $182.35 billion
5. ConocoPhillips: $178.56 billion
2009
1. ExxonMobil: $442.85 billion
2. Walmart: $405.61 billion
3. Chevron: $263.16 billion
4. ConocoPhillips: $230.76 billion
5. General Electric: $183.21 billion

2010
1. Walmart: $408.21 billion
2. ExxonMobil: $284.65 billion
3. Chevron: $163.53 billion
4. General Electric: $156.78 billion
5. Bank of America: $150.45 billion

2011
1. Walmart: $421.85 billion
2. ExxonMobil: $354.67 billion
3. Chevron: $196.34 billion
4. ConocoPhillips: $184.97 billion
5. Fannie Mae: $153.83 billion
[in-text-ad-2]

2012
1. ExxonMobil: $452.93 billion
2. Walmart: $446.95 billion
3. Chevron: $245.62 billion
4. ConocoPhillips: $237.27 billion
5. General Motors: $150.28 billion

2013
1. Walmart: $469.16 billion
2. ExxonMobil: $449.89 billion
3. Chevron: $233.90 billion
4. Phillips 66: $169.55 billion
5. Berkshire Hathaway Inc.: $162.46 billion

2014
1. Walmart: $476.29 billion
2. ExxonMobil: $407.67 billion
3. Chevron: $220.36 billion
4. Berkshire Hathaway Inc.: $182.15 billion
5. Apple, Inc.: $170.91 billion

2015
1. Walmart: $485.65 billion
2. ExxonMobil: $382.60 billion
3. Chevron: $203.78 billion
4. Berkshire Hathaway Inc.: $194.67 billion
5. Apple, Inc.: $182.80 billion
[in-text-ad]

2016
1. Walmart: $482.13 billion
2. ExxonMobil: $246.20 billion
3. Apple: $233.72 billion
4. Berkshire Hathaway: $210.82 billion
5. McKesson: $181.24 billion

2017
1. Walmart: $485.87 billion
2. Berkshire Hathaway: $223.60 billion
3. Apple: $215.64 billion
4. ExxonMobil: $205.00 billion
5. McKesson: $192.49 billion

2018
1. Walmart: $500.34 billion
2. ExxonMobil: $244.36 billion
3. Berkshire Hathaway: $242.14 billion
4. Apple: $229.24 billion
5. UnitedHealth Group: $201.16 billion

2019
1. Walmart: $500.41 billion
2. Amazon: $280.52 billion
3. ExxonMobil: $264.94 billion
4. Apple: $260.17 billion
5. Berkshire Hathaway: $254.62 billion
[in-text-ad-2]

2020
1. Walmart: $523.96 billion
2. Amazon: $386.06 billion
3. Apple: $274.52 billion
4. CVS Health: $268.71 billion
5. ExxonMobil: $178.57 billion

2021
1. Walmart: $559.15 billion
2. Amazon: $469.82 billion
3. Apple: $365.82 billion
4. CVS Health: $292.11 billion
5. UnitedHealth Group: $287.60 billion
Get Ready To Retire (Sponsored)
Start by taking a quick retirement quiz from SmartAsset that will match you with up to 3 financial advisors that serve your area and beyond in 5 minutes, or less.
Each advisor has been vetted by SmartAsset and is held to a fiduciary standard to act in your best interests.
Here’s how it works:
1. Answer SmartAsset advisor match quiz
2. Review your pre-screened matches at your leisure. Check out the advisors’ profiles.
3. Speak with advisors at no cost to you. Have an introductory call on the phone or introduction in person and choose whom to work with in the future
Thank you for reading! Have some feedback for us?
Contact the 24/7 Wall St. editorial team.
 24/7 Wall St.
 24/7 Wall St.
 24/7 Wall St.


