
While much of our freshwater resources are polluted, Americans are, for the most part, protected from potential health effects through drinking water standards and restrictions on fishing and swimming. It is much harder to avoid exposure to pollutants in the air. Air pollution increases the risk of lung infection, heart disease and cancer, and worsens the effects of respiratory disease.
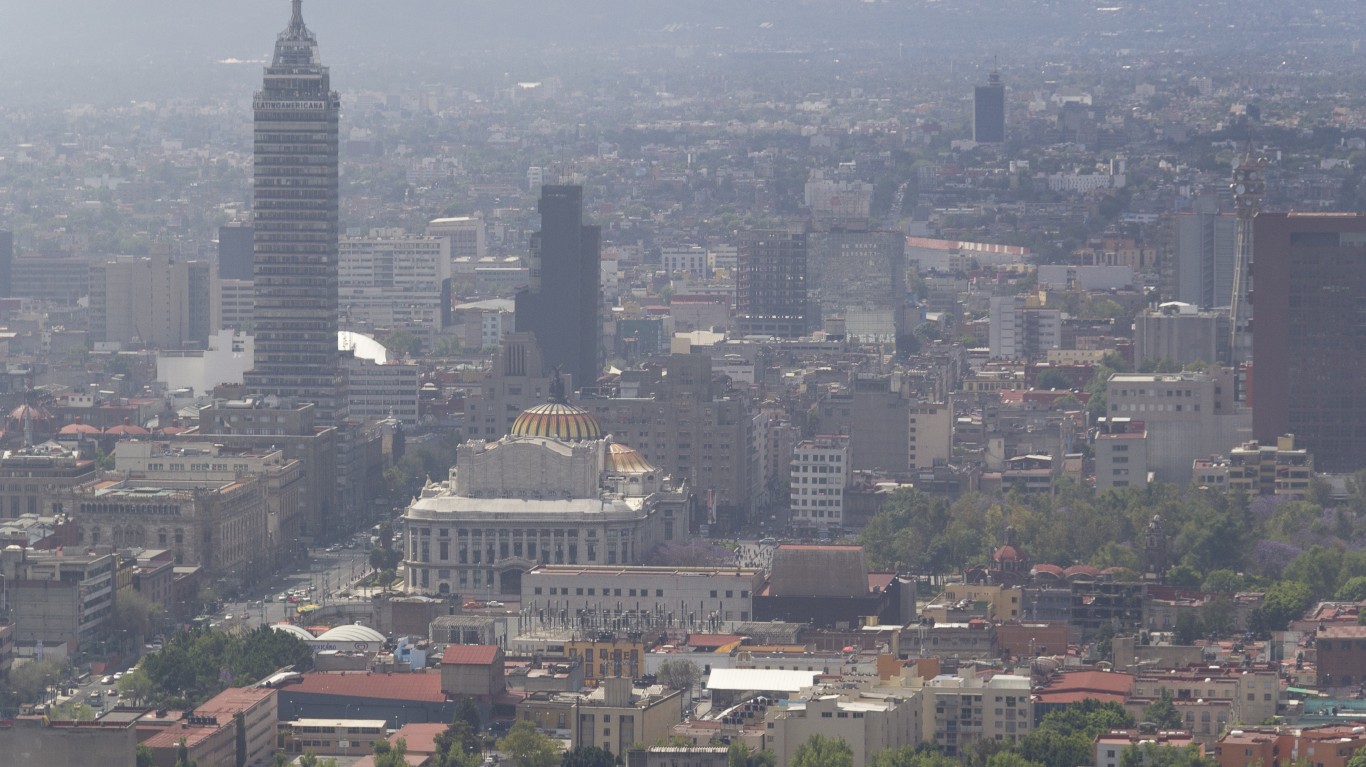
To identify the 25 most polluted cities in America, 24/7 Wall St. reviewed the report Most Polluted Cities from the American Lung Association’s State of the Air 2022. The report ranked metropolitan statistical areas by the number of average high ozone days per year. The average 24-hour unhealthy particle pollution, the number of adults with asthma, and the total population also came from the ALA report. (Globally, these are the most polluted cities in the world.)
Regulations have done much to improve air quality since the Clean Air Act was passed in 1972. And while still problematic, contaminant levels have declined dramatically over the decades through controls on automobile and industrial pollution. So, for example, Los Angeles, the city that suffers most from high ozone levels – a component of smog – experienced 50.7 fewer high ozone days in 2020 than it did in 1996. Bakersfield, which has the highest levels of particulates in the country, had 32.7 fewer high particulate days in 2020 than it did in 2000.
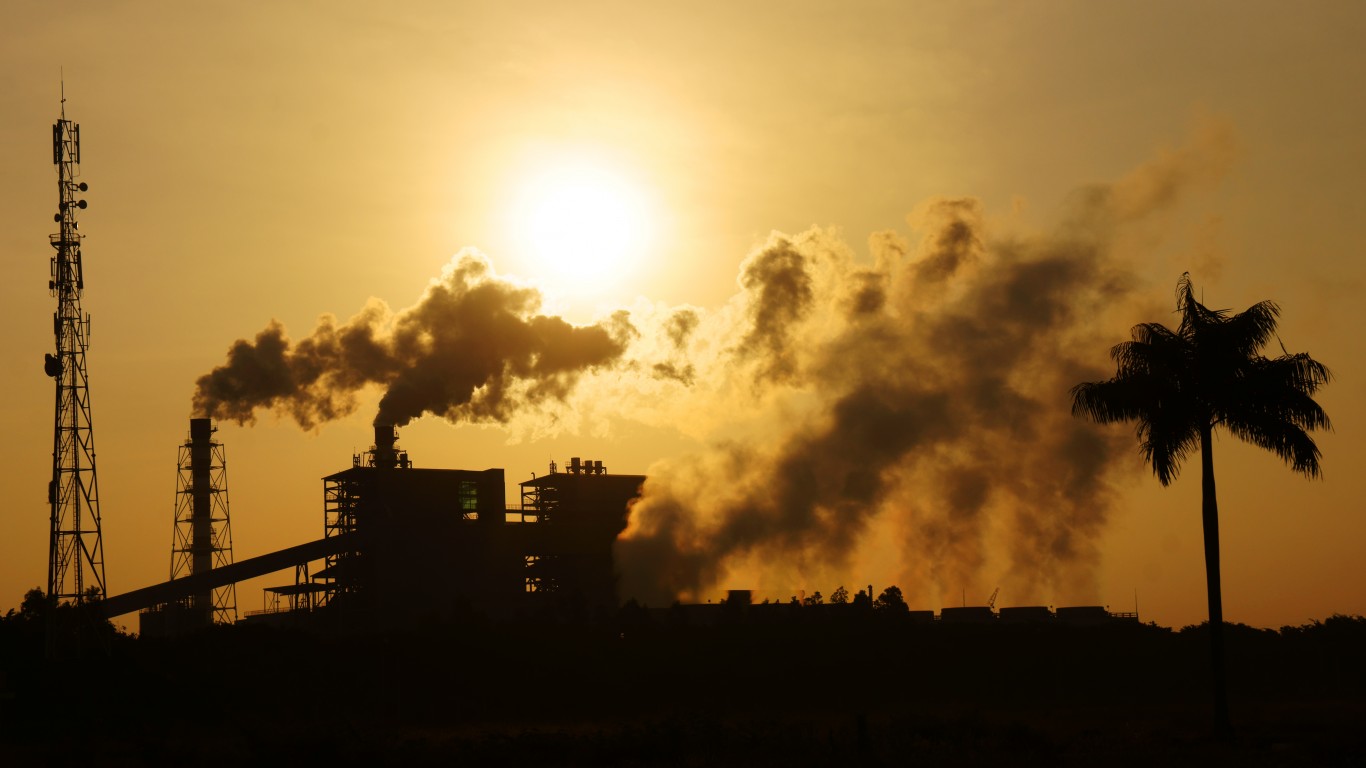
Unfortunately, this trend is beginning to reverse. Attributable largely to climate change and higher temperatures, air quality is getting worse. High heat and stagnant air create conditions that promote the chemical reaction between pollutants and forms ozone. Heat and low rainfall create conditions for drought and wildfires, which both put high levels of particulates into the air. (These are 23 places where industrial air pollution is so bad it causes cancer.)
According to the ALA, 137 million Americans are now breathing air with unhealthy levels of ozone and particulates, 2.1 million more than documented in the previous year’s report. Also, 2.3 million children and nearly 10 million adults living with asthma – a serious chronic respiratory disease – live in counties that received an F for at least one pollutant. Air pollution can worsen asthma symptoms and trigger asthma attacks, according to the Environmental Protection Agency.
The hottest cities in the country have the highest levels of pollution. Thus, 20 of the 25 most polluted cities are concentrated in the West and Southwest. The New York, Chicago, and Detroit metropolitan areas are the only cities east of the Mississippi to make the worst cities list.
These are the smoggiest cities in America
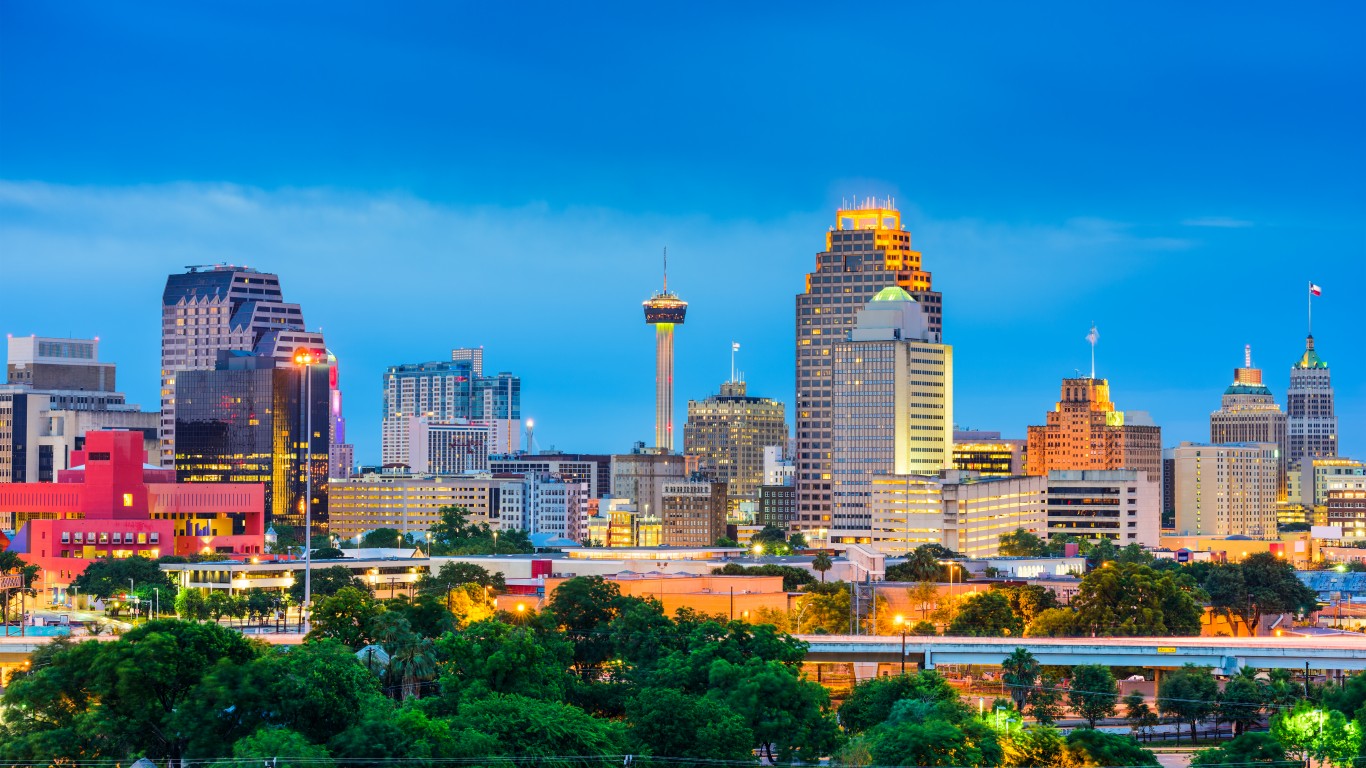
25. San Antonio-New Braunfels-Pearsall, TX
> Average high ozone days per year: 7.3
> Average 24-hour unhealthy particle pollution: 0.8
> Adults with asthma: 146,716
> Population: 2,611,111
[in-text-ad]
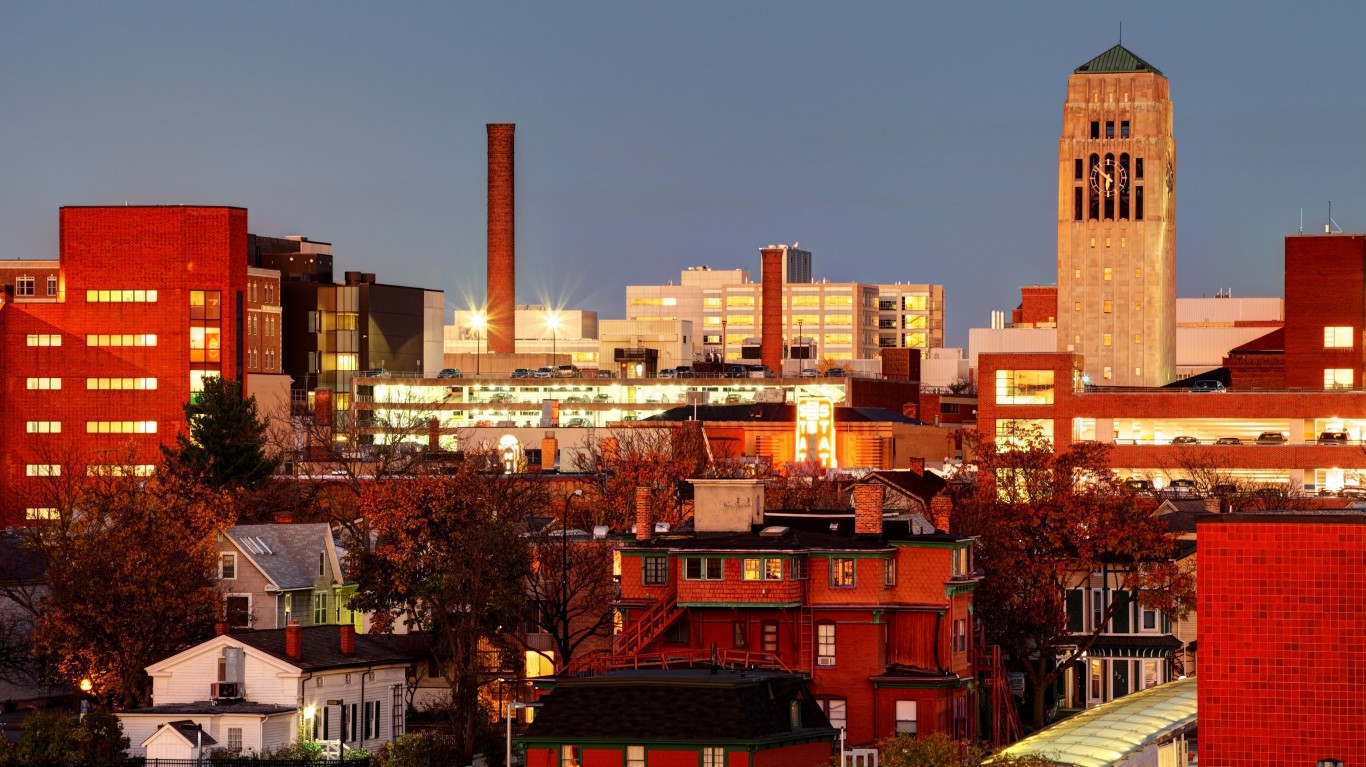
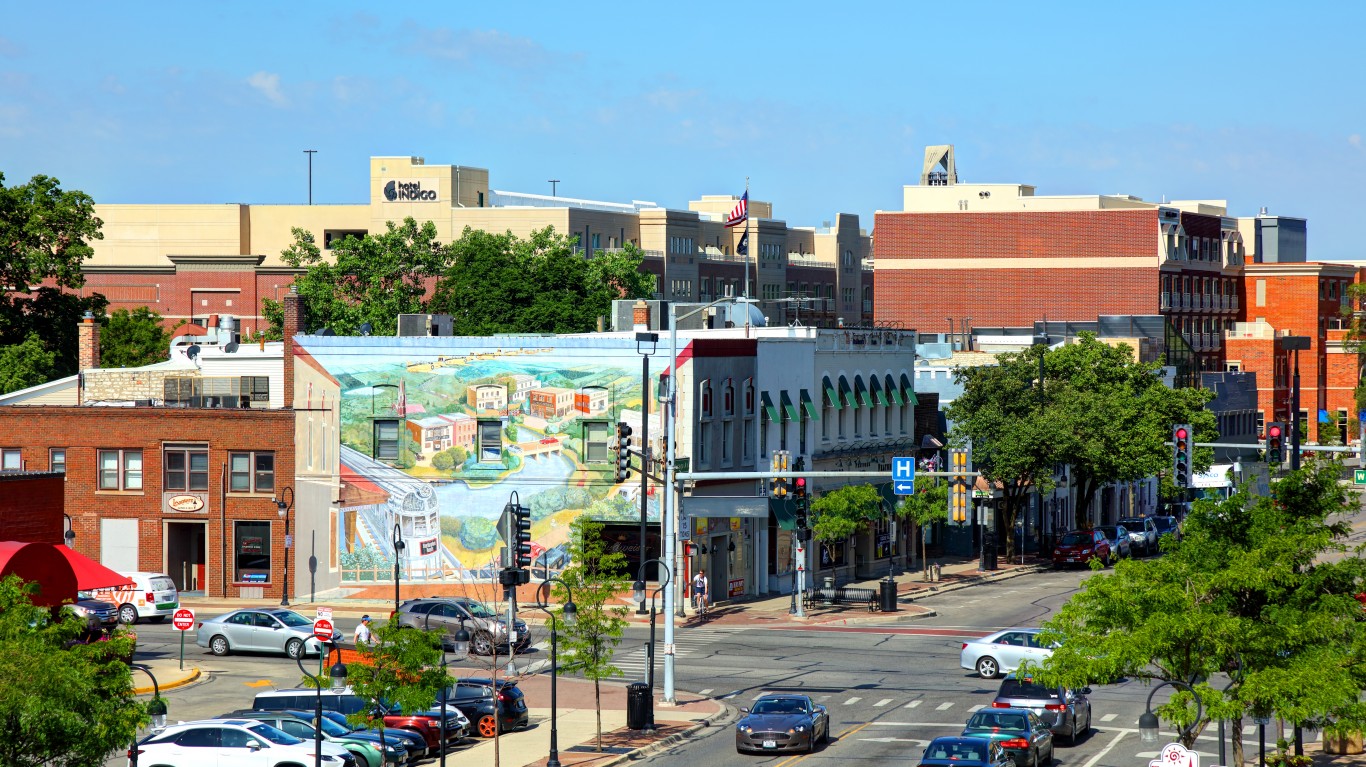
24. Detroit-Warren-Ann Arbor, MI
> Average high ozone days per year: 7.7
> Average 24-hour unhealthy particle pollution: 3.8
> Adults with asthma: 462,752
> Population: 5,323,779

23. Redding-Red Bluff, CA
> Average high ozone days per year: 7.8
> Average 24-hour unhealthy particle pollution: 3.7
> Adults with asthma: 17,848
> Population: 243,521
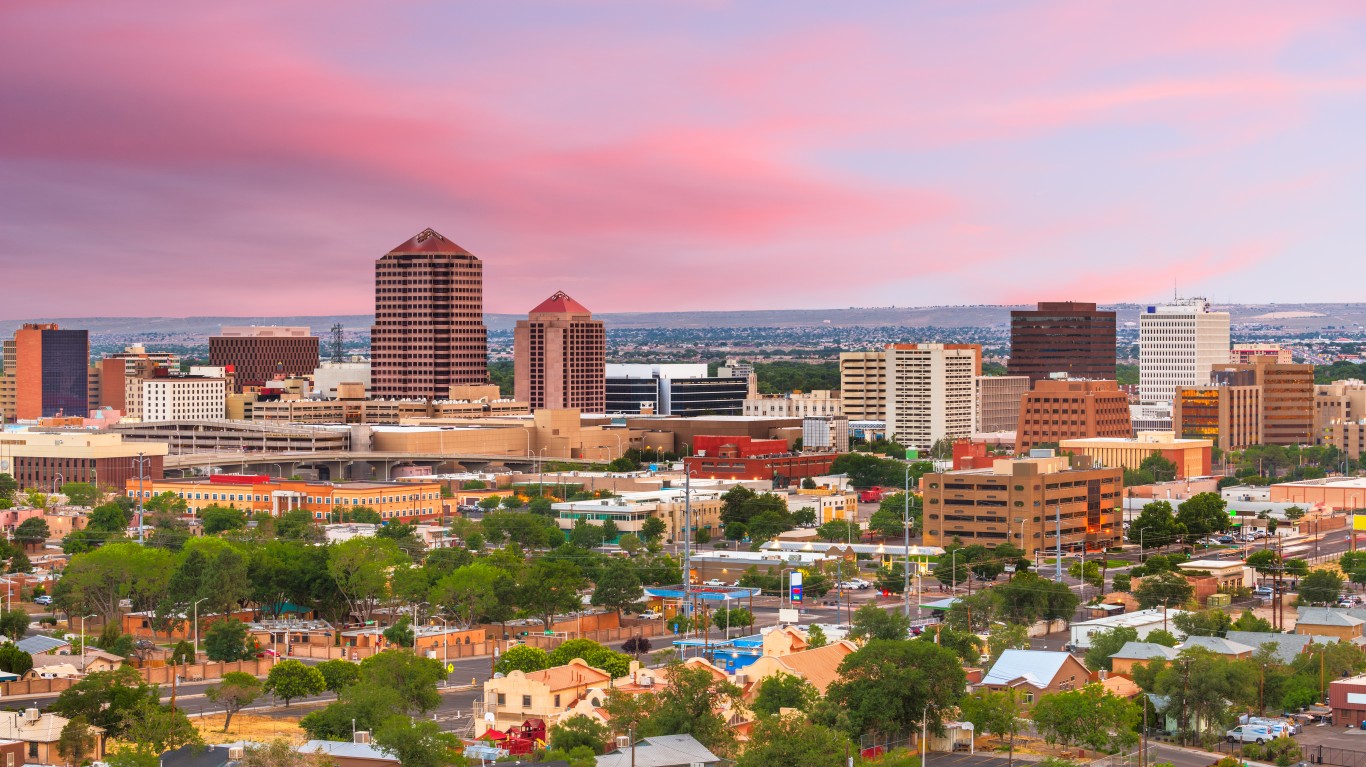
22. Albuquerque-Santa Fe-Las Vegas, NM
> Average high ozone days per year: 8.0
> Average 24-hour unhealthy particle pollution: 0.3
> Adults with asthma: 93,049
> Population: 1,165,181
[in-text-ad-2]
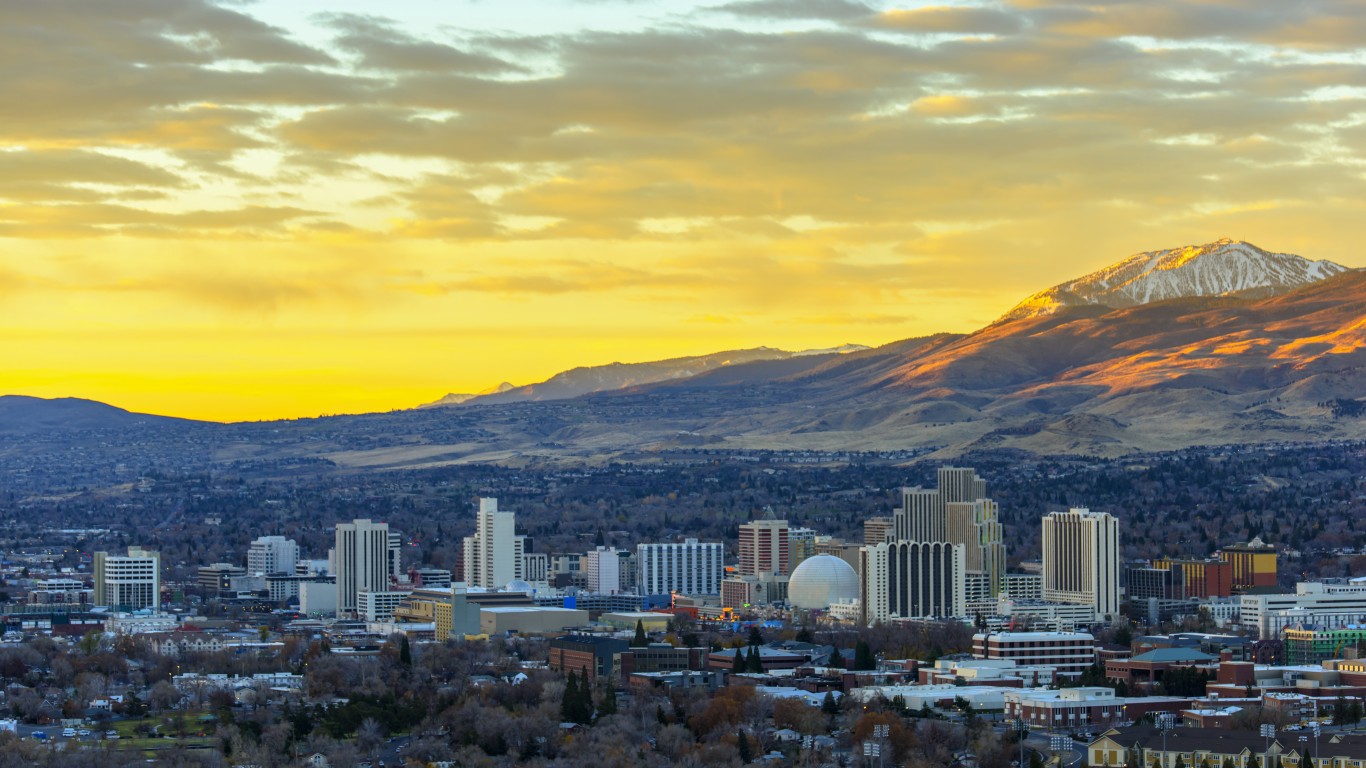
21. Reno-Carson City-Fernley, NV
> Average high ozone days per year: 9.7
> Average 24-hour unhealthy particle pollution: 12.2
> Adults with asthma: 48,994
> Population: 644,730
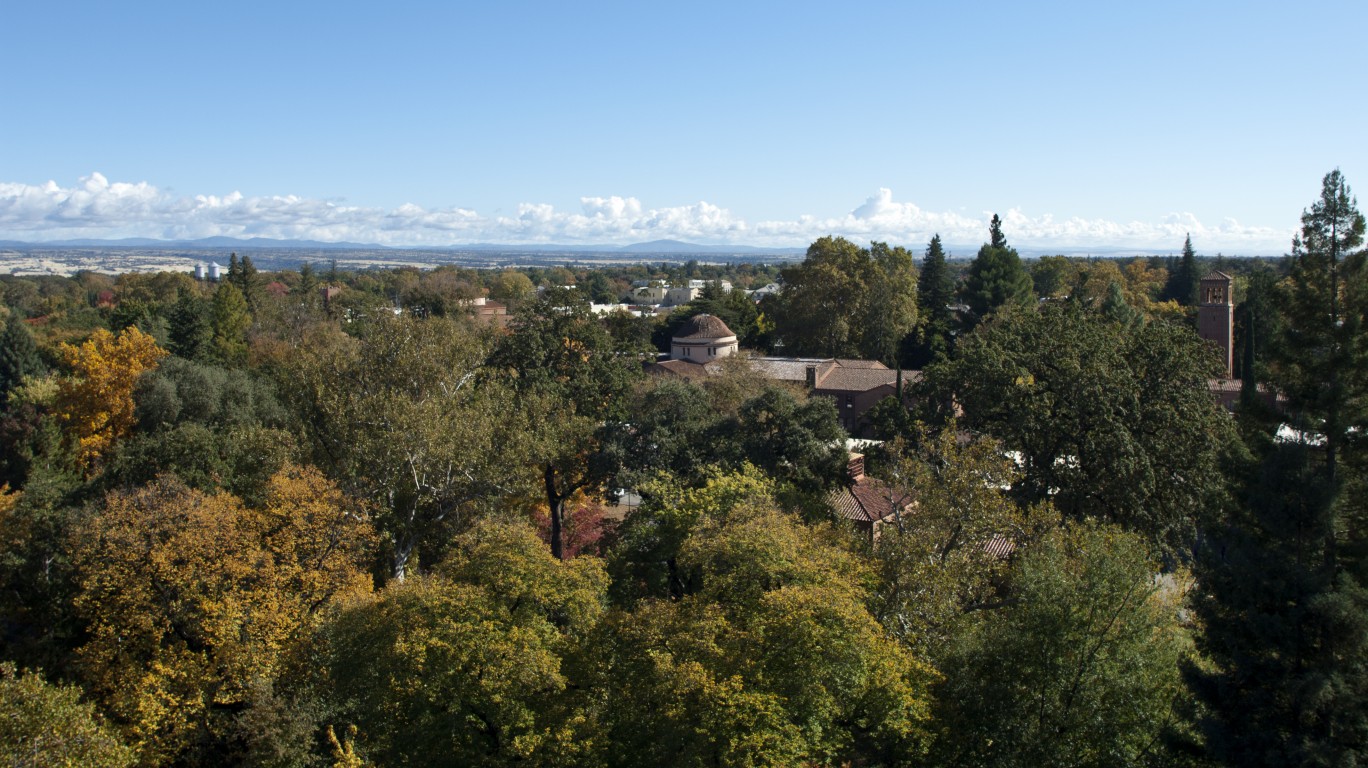
20. Chico, CA
> Average high ozone days per year: 10.8
> Average 24-hour unhealthy particle pollution: 23.0
> Adults with asthma: 15,926
> Population: 212,744
[in-text-ad]

19. San Luis Obispo-Paso Robles, CA
> Average high ozone days per year: 11.0
> Average 24-hour unhealthy particle pollution: 7.7
> Adults with asthma: 21,870
> Population: 282,249
 24/7 Wall St.
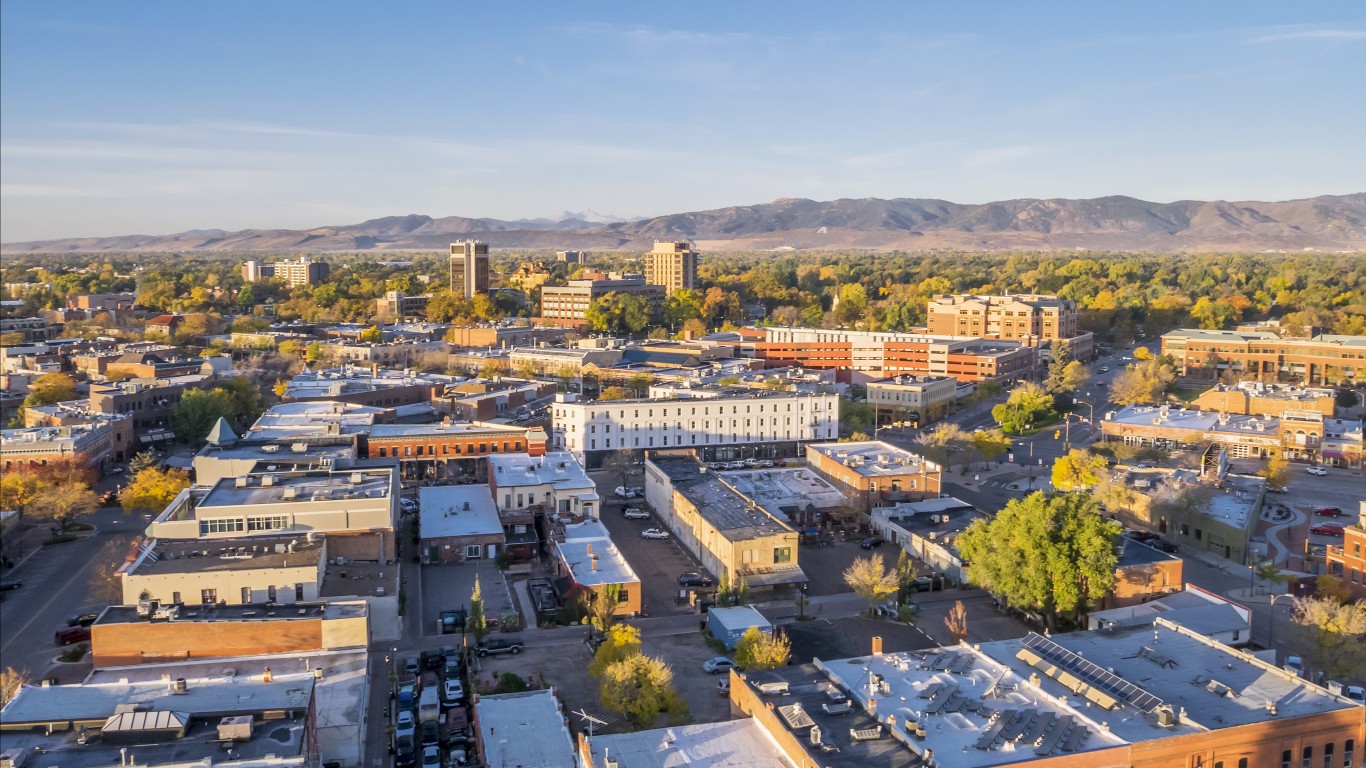
18. Fort Collins, CO
> Average high ozone days per year: 14.5
> Average 24-hour unhealthy particle pollution: 4.8
> Adults with asthma: 27,972
> Population: 360,428
17. Chicago-Naperville, IL-IN-WI
> Average high ozone days per year: 16.0
> Average 24-hour unhealthy particle pollution: 0.8
> Adults with asthma: 663,501
> Population: 9,770,485
[in-text-ad-2]
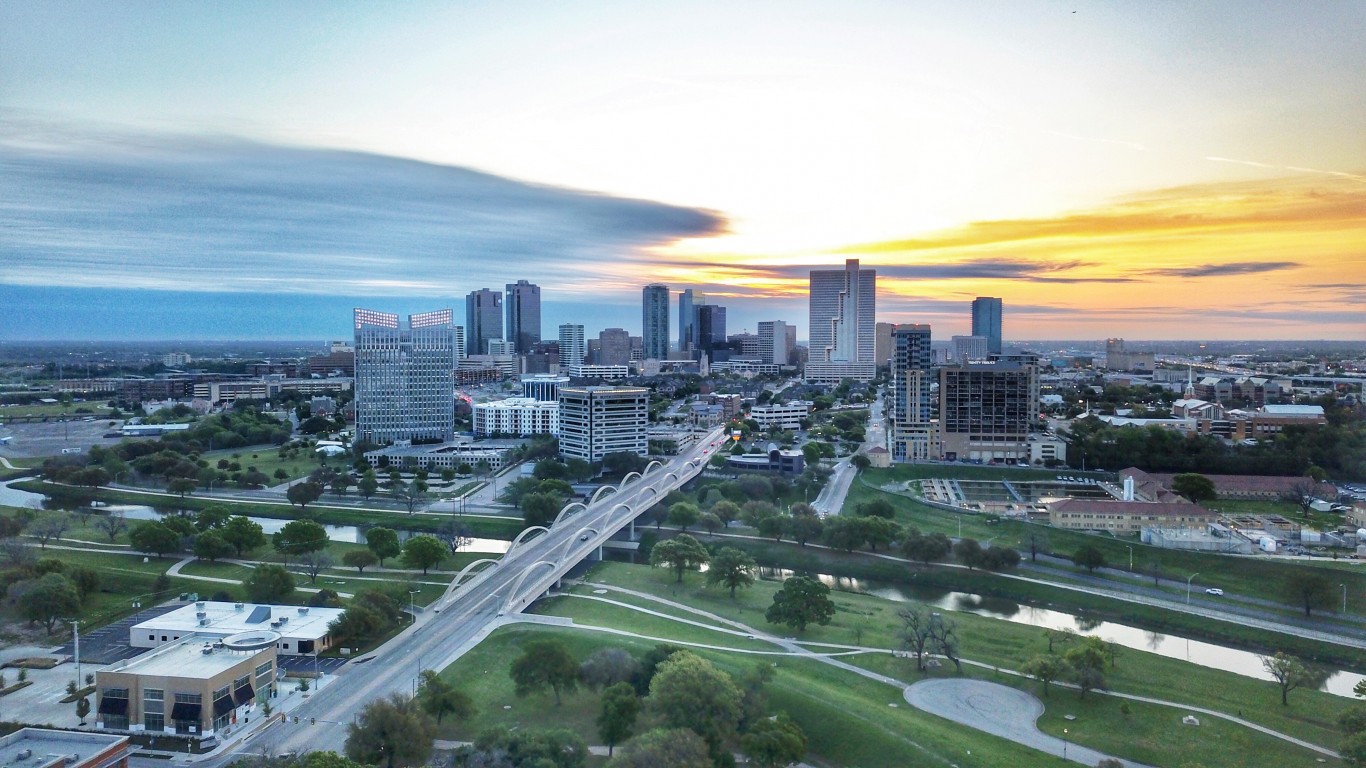
16. Dallas-Fort Worth, TX-OK
> Average high ozone days per year: 16.0
> Average 24-hour unhealthy particle pollution: 2.3
> Adults with asthma: 459,236
> Population: 8,186,093
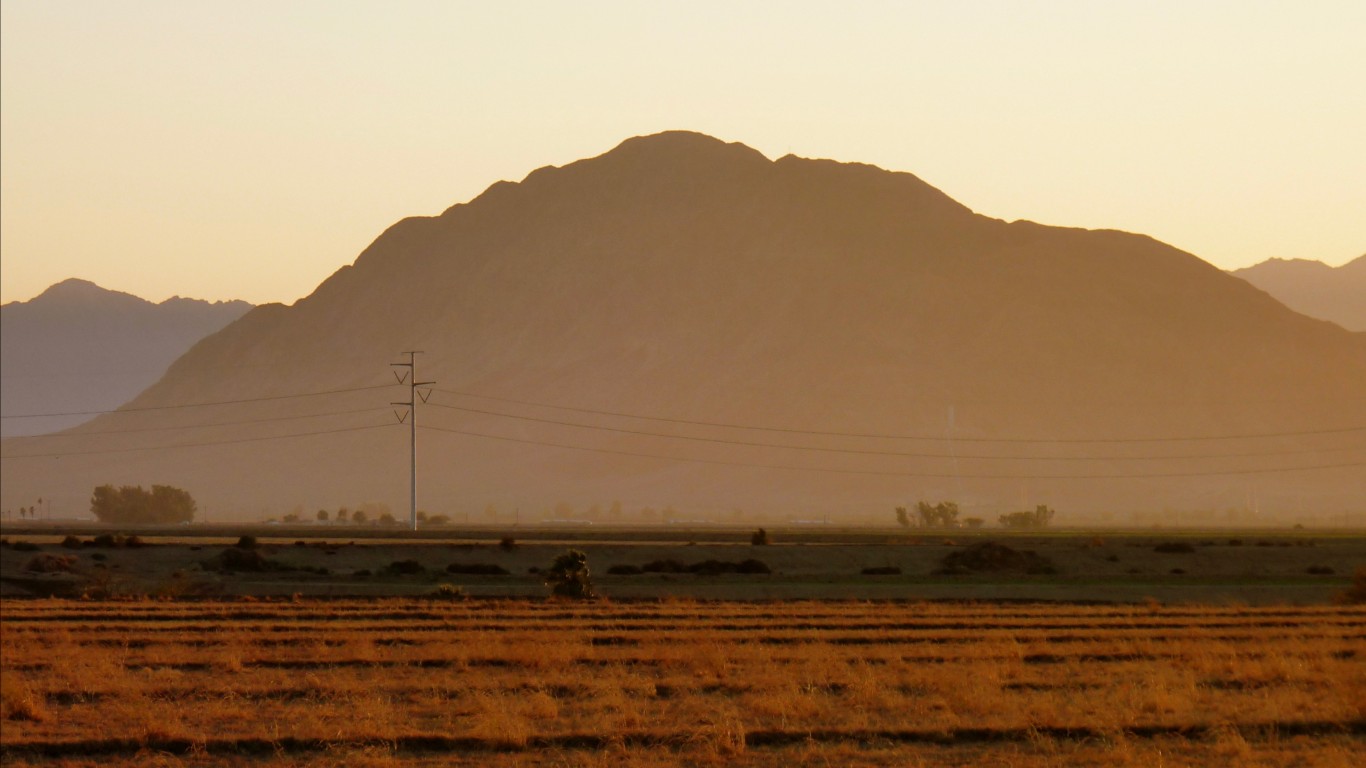
15. El Centro, CA
> Average high ozone days per year: 18.5
> Average 24-hour unhealthy particle pollution: 5.5
> Adults with asthma: 12,094
> Population: 180,267
[in-text-ad]

14. New York-Newark, NY-NJ-CT-PA
> Average high ozone days per year: 18.8
> Average 24-hour unhealthy particle pollution: 1.3
> Adults with asthma: 1,675,005
> Population: 22,491,979
 24/7 Wall St.
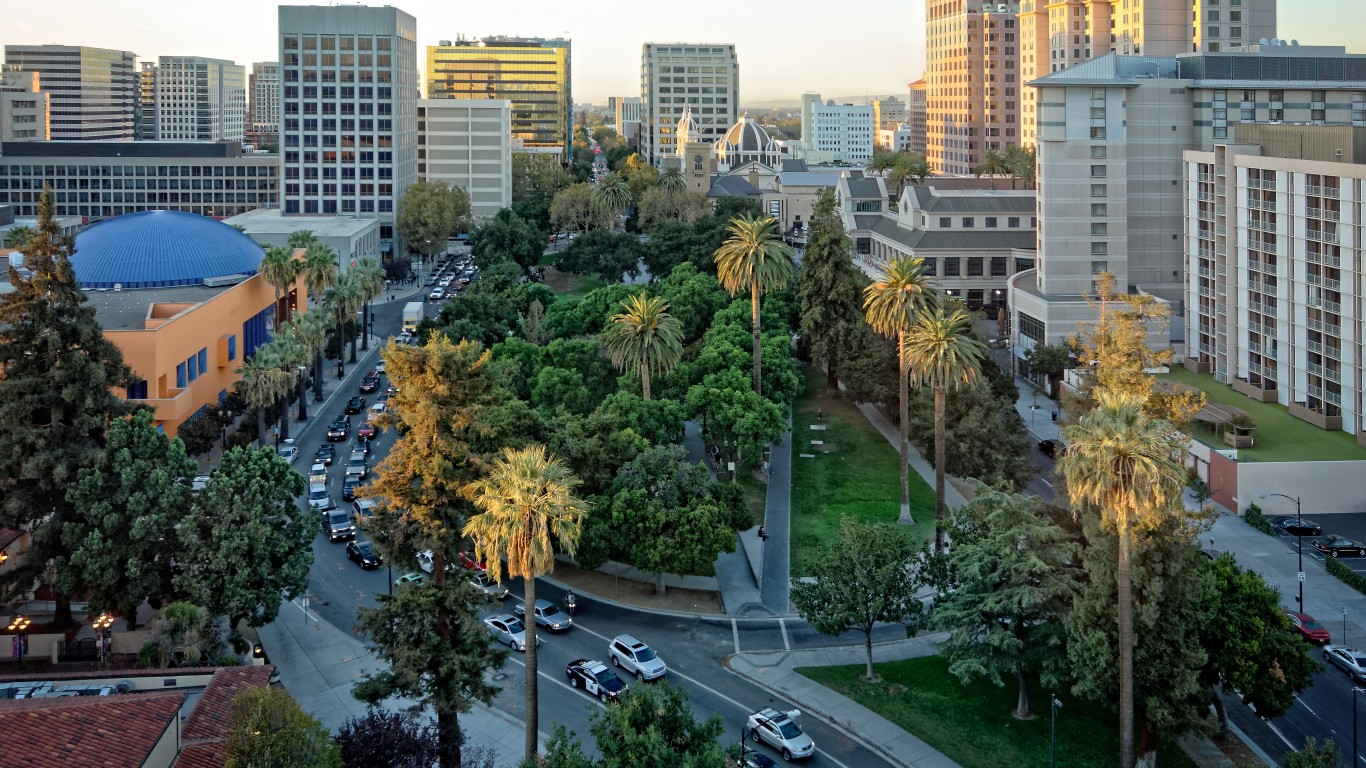
13. San Jose-San Francisco-Oakland, CA
> Average high ozone days per year: 19.0
> Average 24-hour unhealthy particle pollution: 9.8
> Adults with asthma: 712,280
> Population: 9,608,006
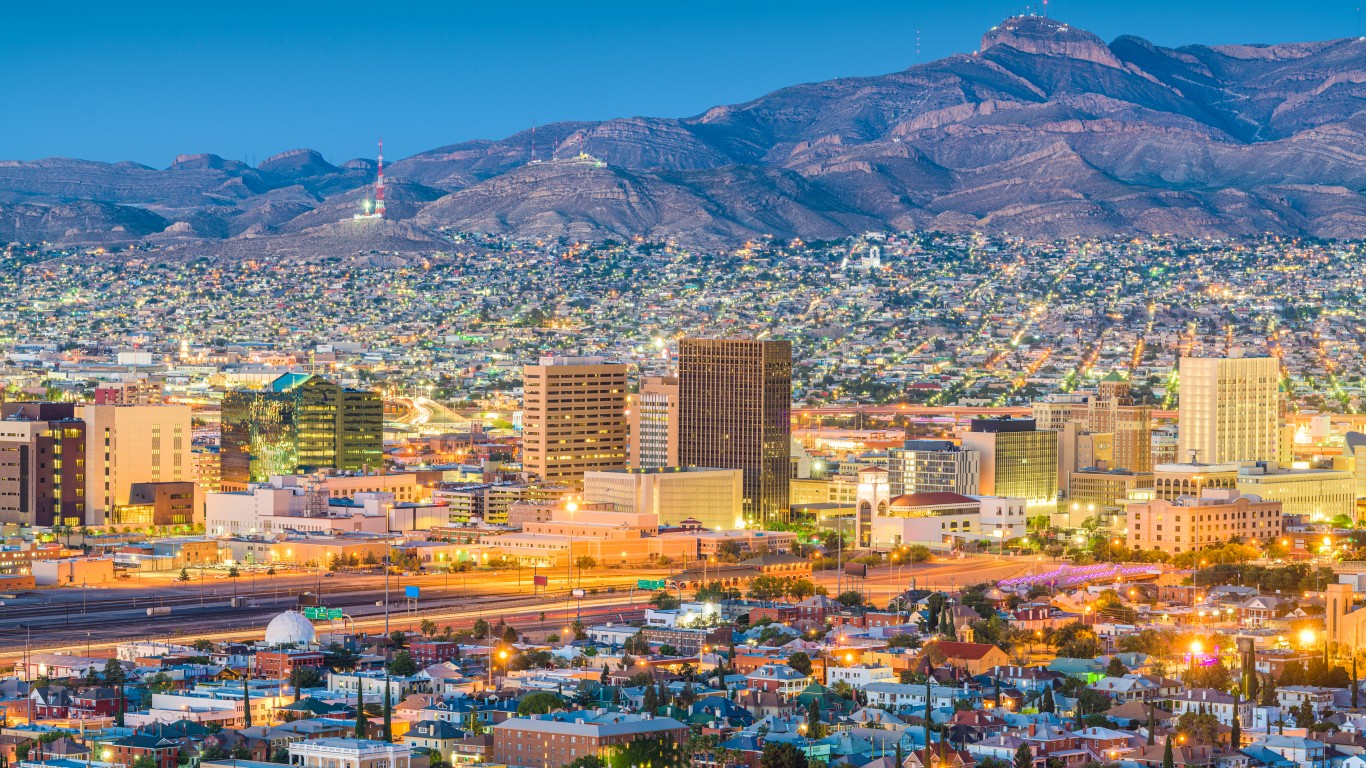
12. El Paso-Las Cruces, TX-NM
> Average high ozone days per year: 19.2
> Average 24-hour unhealthy particle pollution: 2.2
> Adults with asthma: 63,190
> Population: 1,067,454
[in-text-ad-2]
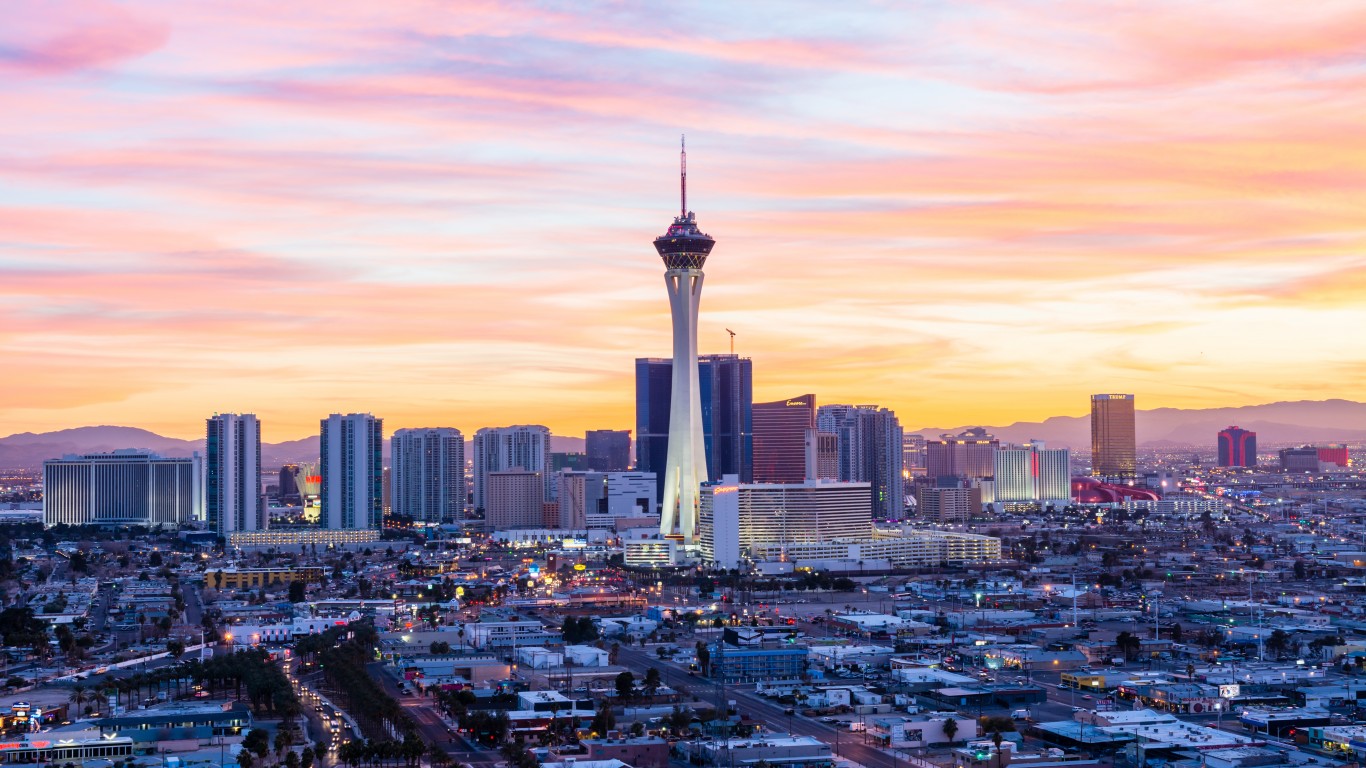
11. Las Vegas-Henderson, NV
> Average high ozone days per year: 21.7
> Average 24-hour unhealthy particle pollution: 4.5
> Adults with asthma: 172,888
> Population: 2,364,017
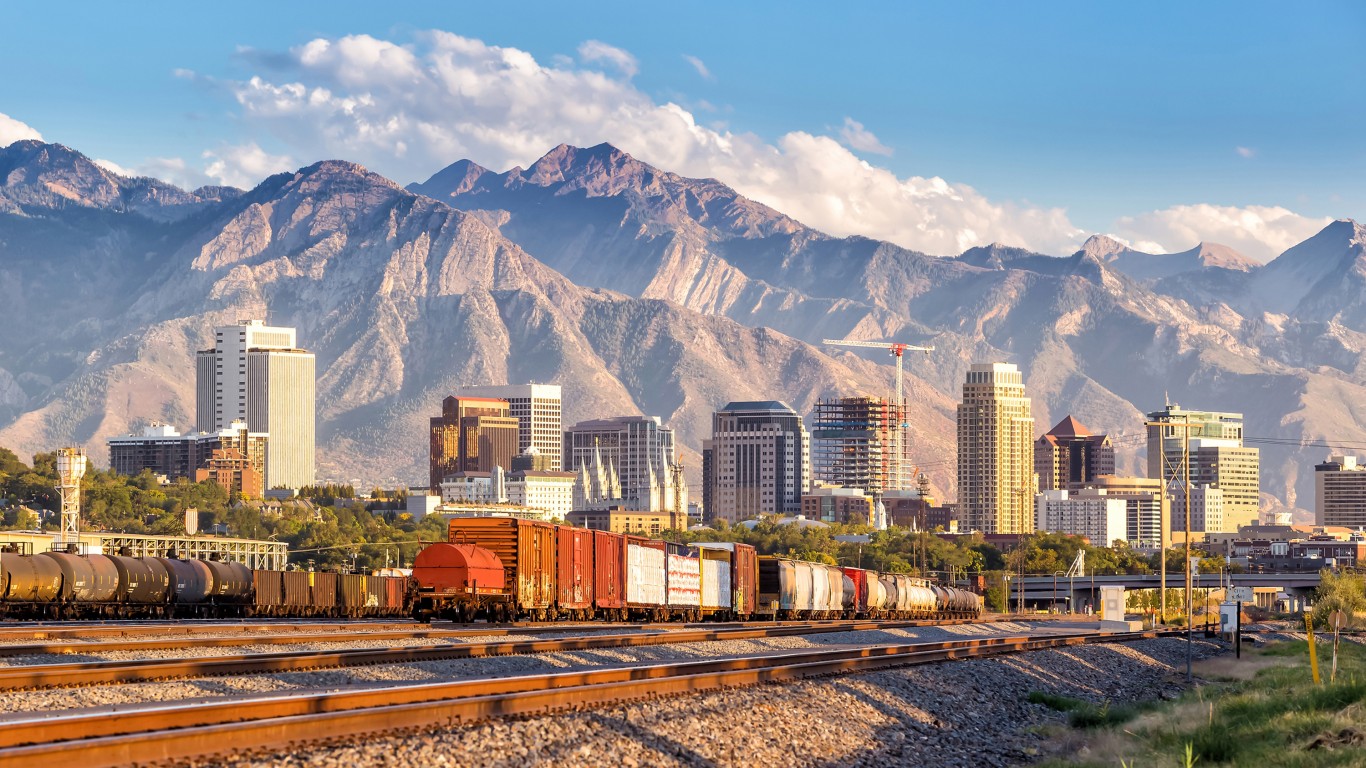
10. Salt Lake City-Provo-Orem, UT
> Average high ozone days per year: 21.8
> Average 24-hour unhealthy particle pollution: 8.0
> Adults with asthma: 206,440
> Population: 2,672,368
[in-text-ad]
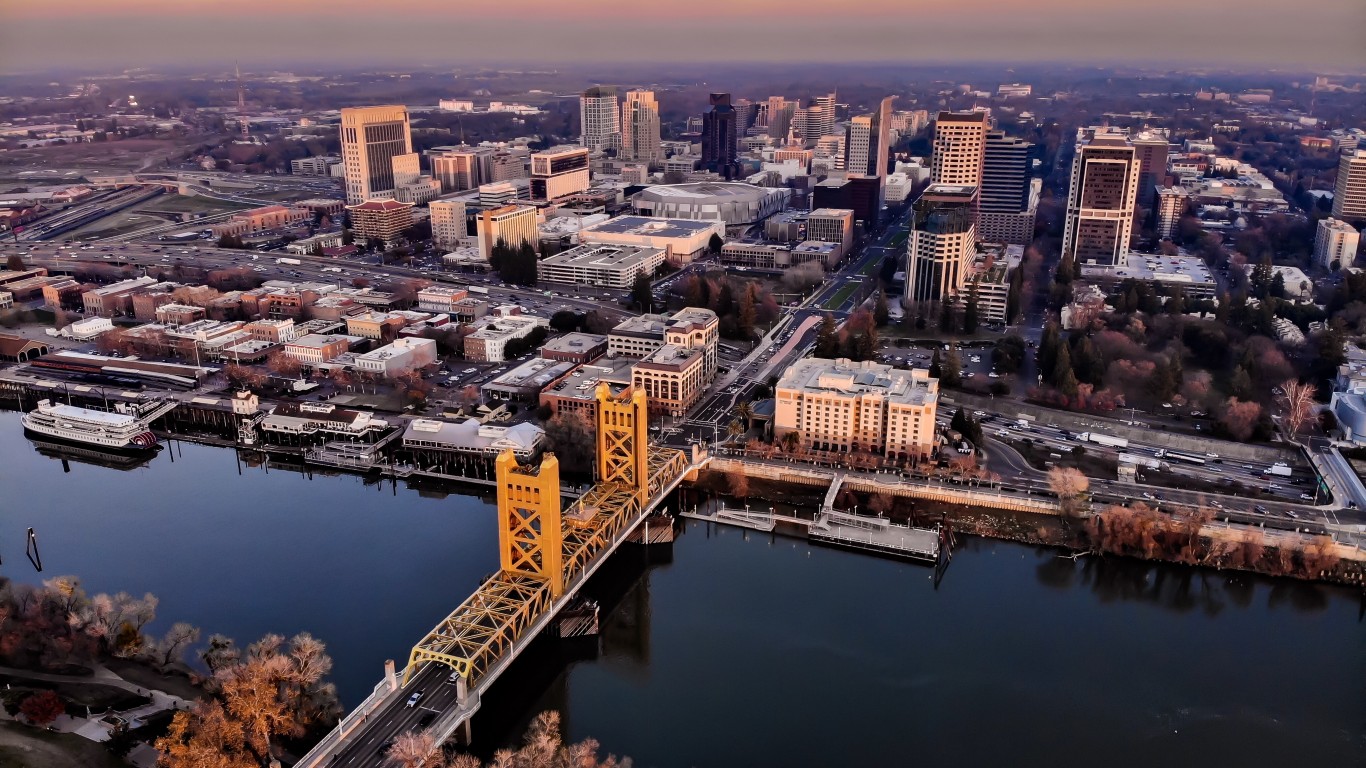
9. Sacramento-Roseville, CA
> Average high ozone days per year: 23.5
> Average 24-hour unhealthy particle pollution: 21.2
> Adults with asthma: 193,091
> Population: 2,650,900
 24/7 Wall St.
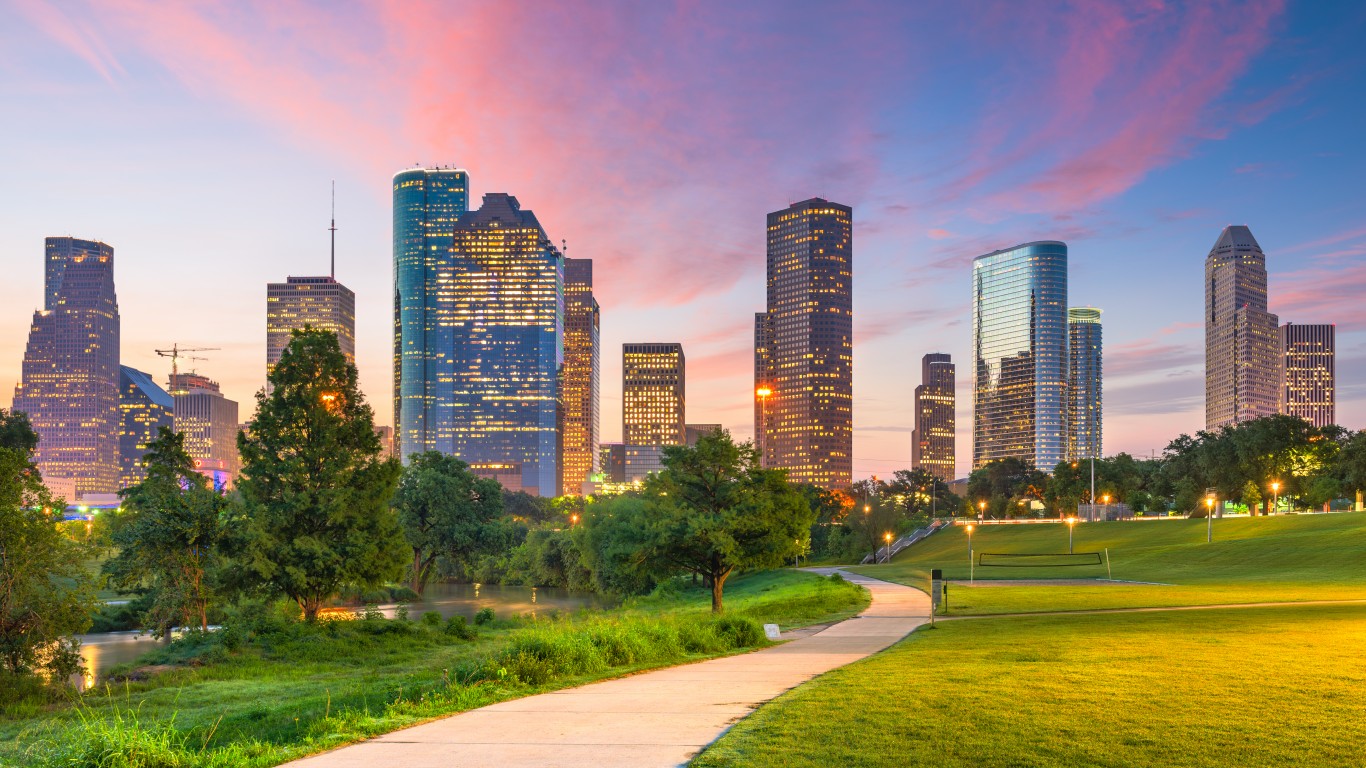
8. Houston-The Woodlands, TX
> Average high ozone days per year: 24.4
> Average 24-hour unhealthy particle pollution: 2.3
> Adults with asthma: 405,973
> Population: 7,340,823
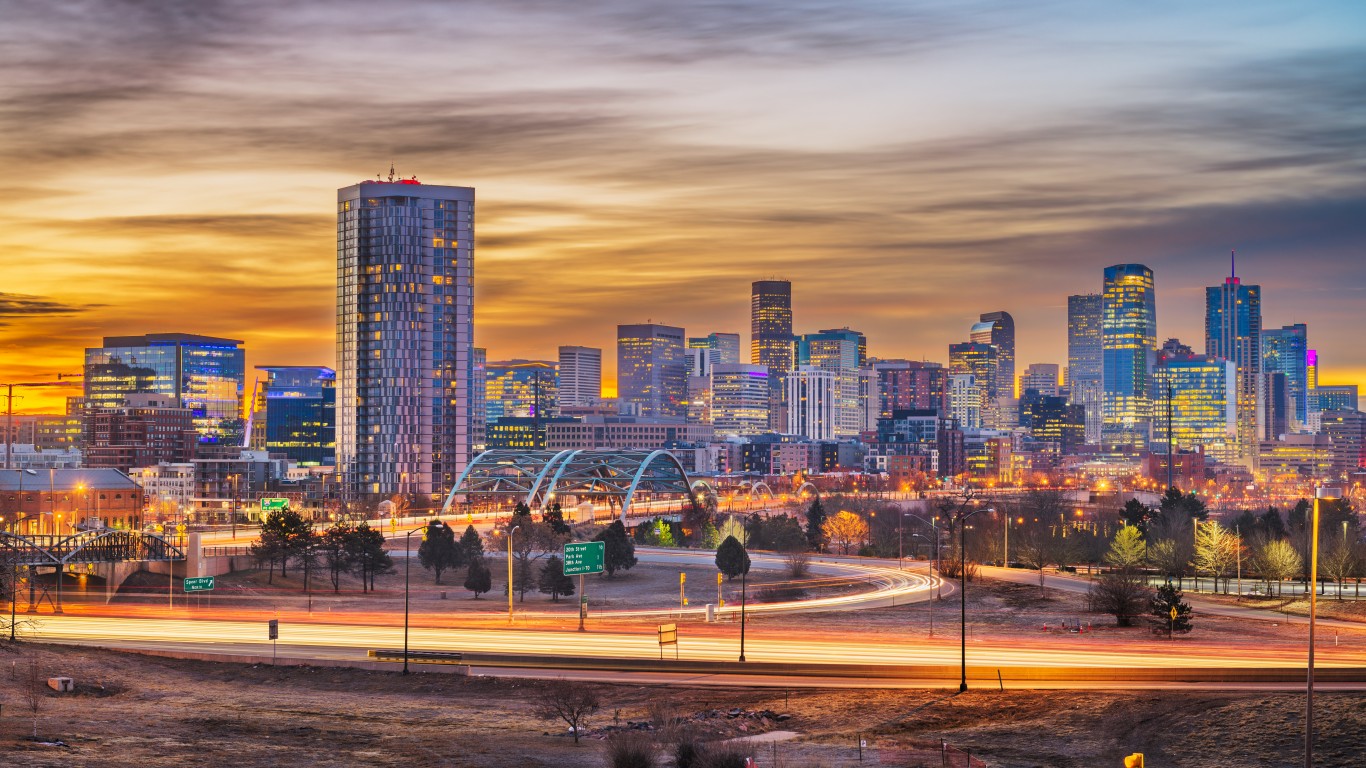
7. Denver-Aurora, CO
> Average high ozone days per year: 27.7
> Average 24-hour unhealthy particle pollution: 6.3
> Adults with asthma: 274,959
> Population: 3,652,385
[in-text-ad-2]

6. San Diego-Chula Vista-Carlsbad, CA
> Average high ozone days per year: 29.3
> Average 24-hour unhealthy particle pollution: 12.0
> Adults with asthma: 246,524
> Population: 3,332,427
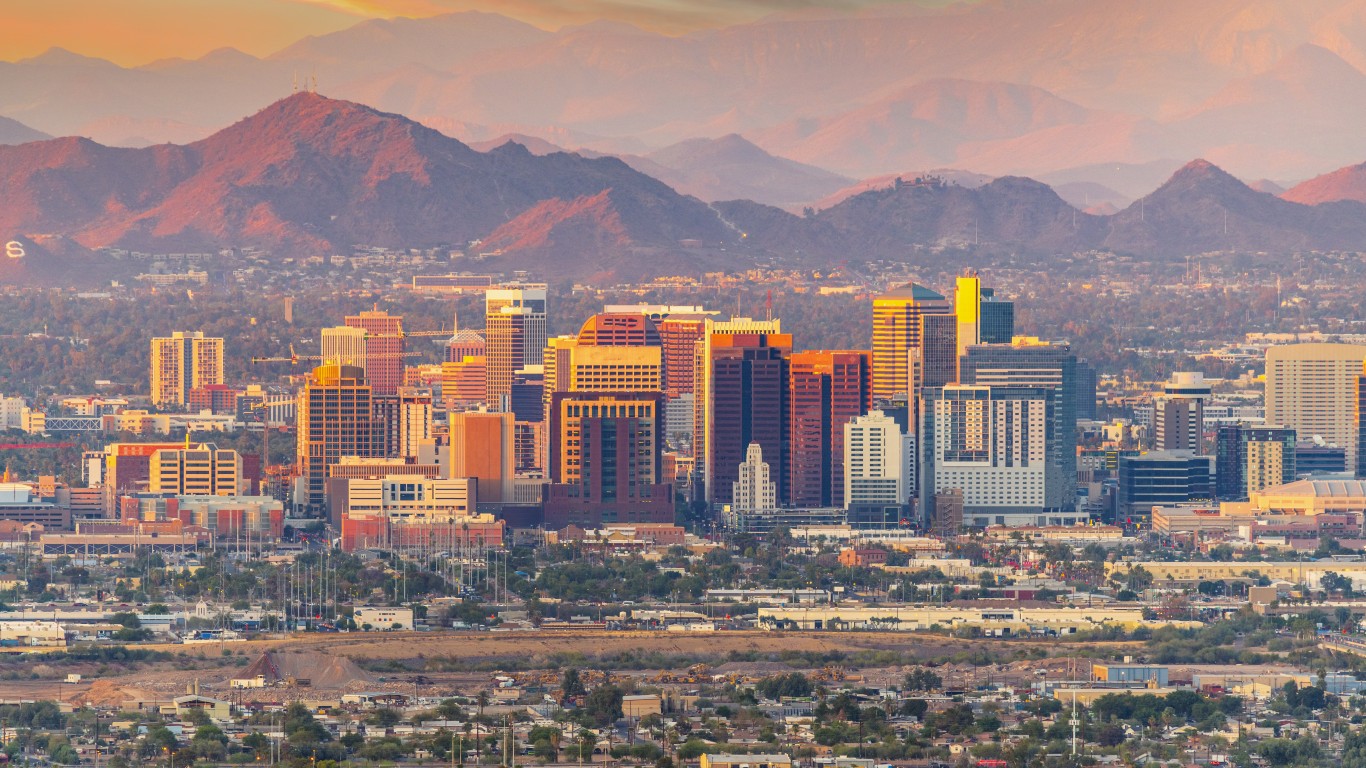
5. Phoenix-Mesa, AZ
> Average high ozone days per year: 39.3
> Average 24-hour unhealthy particle pollution: 7.8
> Adults with asthma: 383,476
> Population: 5,114,212
[in-text-ad]
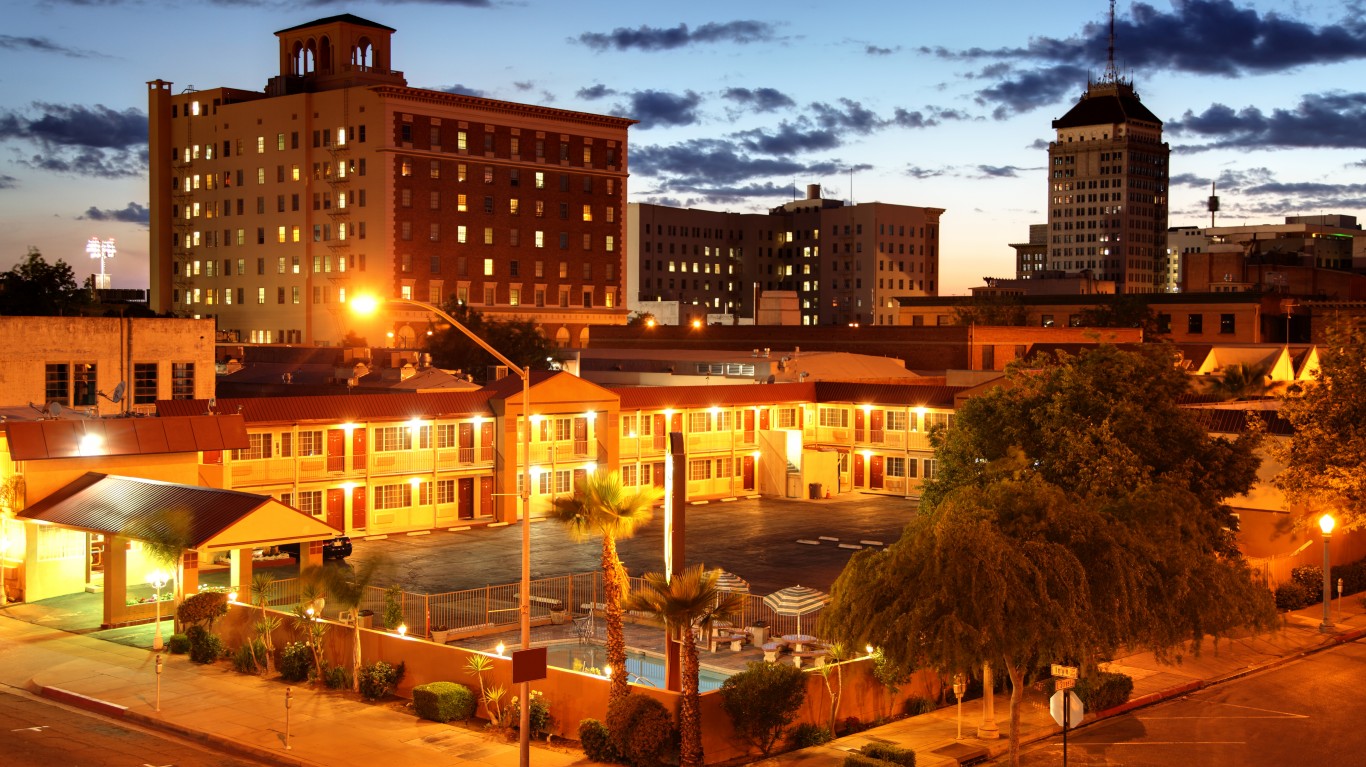
4. Fresno-Madera-Hanford, CA
> Average high ozone days per year: 60.2
> Average 24-hour unhealthy particle pollution: 51.5
> Adults with asthma: 88,818
> Population: 1,311,371

3. Visalia, CA
> Average high ozone days per year: 91.8
> Average 24-hour unhealthy particle pollution: 13.7
> Adults with asthma: 30,688
> Population: 468,680
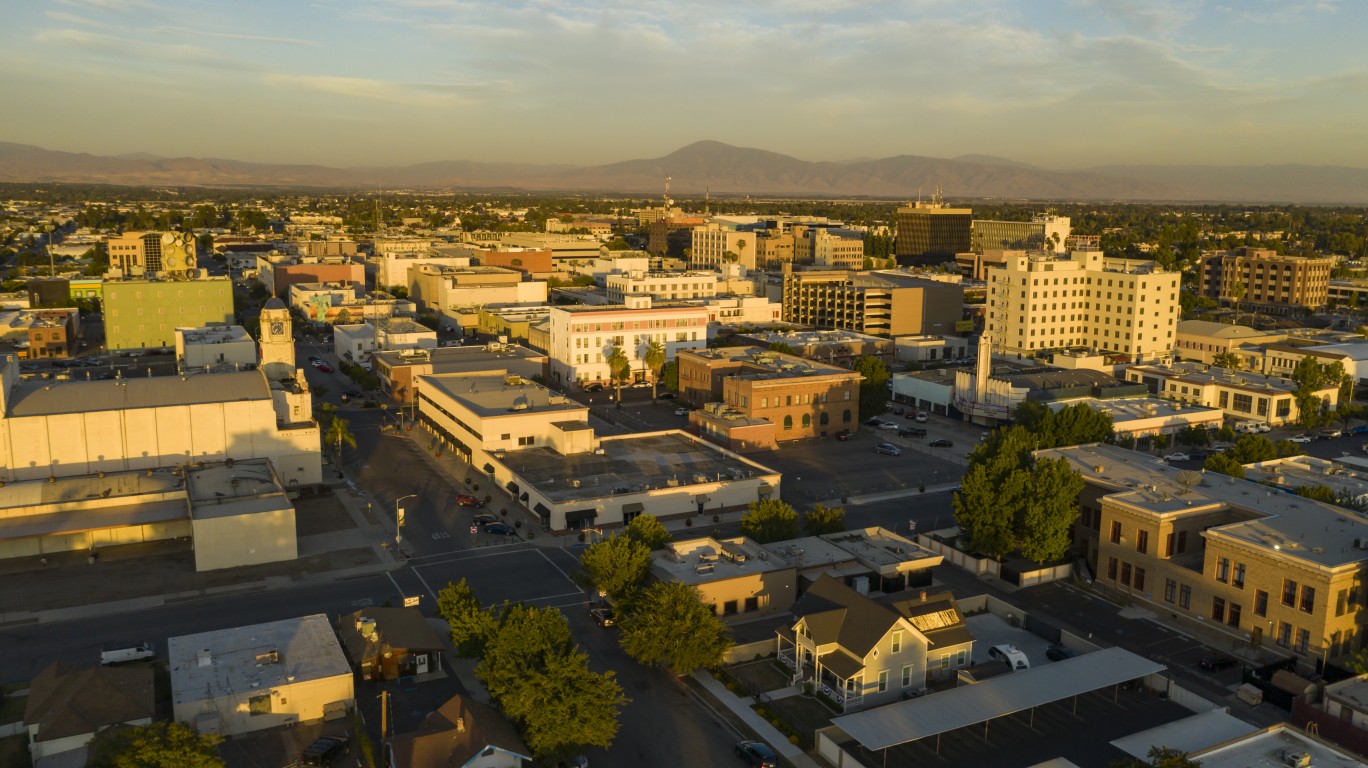
2. Bakersfield, CA
> Average high ozone days per year: 95.2
> Average 24-hour unhealthy particle pollution: 41.0
> Adults with asthma: 60,364
> Population: 901,362
[in-text-ad-2]

1. Los Angeles-Long Beach, CA
> Average high ozone days per year: 179.8
> Average 24-hour unhealthy particle pollution: 8.7
> Adults with asthma: 1,361,923
> Population: 18,629,661
Take Charge of Your Retirement In Just A Few Minutes (Sponsor)
Retirement planning doesn’t have to feel overwhelming. The key is finding expert guidance—and SmartAsset’s simple quiz makes it easier than ever for you to connect with a vetted financial advisor.
Here’s how it works:
- Answer a Few Simple Questions. Tell us a bit about your goals and preferences—it only takes a few minutes!
- Get Matched with Vetted Advisors Our smart tool matches you with up to three pre-screened, vetted advisors who serve your area and are held to a fiduciary standard to act in your best interests. Click here to begin
- Choose Your Fit Review their profiles, schedule an introductory call (or meet in person), and select the advisor who feel is right for you.
Why wait? Start building the retirement you’ve always dreamed of. Click here to get started today!
Thank you for reading! Have some feedback for us?
Contact the 24/7 Wall St. editorial team.
Latest from 24/7


Our expert who first called NVIDIA in 2009 is predicting 2025 will see a historic AI breakthrough.
You can follow him investing $500,000 of his own money on our top AI stocks for free.