
The American housing market has been on fire. Home values in some markets increased by over 30% year over year. As of February, America’s hottest market was Phoenix.
One reason home prices have risen over the past two years is that tens of thousands of people have decided to migrate from America’s large coastal cities to ones inland. San Francisco and New York have home prices that are two or three times the national median price for existing homes, which has risen to a record of over $375,000. (These are 20 most expensive suburbs for home buyers.)
And while new home building has accelerated, supply chain issues have made building materials more expensive, and shortages have delayed completion of many homes that are under construction or in the planning stages.
Another reason for rising prices is the new mobility of many Americans. The COVID-19 pandemic caused companies to shutter offices for safety reasons. Millions of people have worked from home, and some businesses will not make them come back to traditional offices.
One impetus for home buying last year was the near historic low mortgage rates — below 3%. The Federal Reserve’s rate increases mean that those mortgage rates are no longer available, and this may dent demand in 2022. Already, existing home sales dipped in March, the National Association of Realtors reported. (This is the mortgage rate in America every year since 1972.)
The gold standard of home price research is the S&P CoreLogic Case-Shiller Indices, which are issued monthly. The figures for February showed that home prices across the country rose 19.8% from the same month last year. Craig J. Lazzara, managing director at S&P DJI, commented, “The National Composite’s 19.8% year-over-year change for February was the third-highest reading in 35 years of history.”
The research also looks at price changes in 20 of America’s largest metro areas. These increases were uneven in February. To find America’s hottest housing market, 24/7 Wall St. reviewed housing prices changes in metro areas from S&P CoreLogic Case-Shiller’s recent release.
The market with the highest increase was Phoenix, where prices in February climbed 32.9% year over year. It is the 33rd consecutive month in which Phoenix records the highest increase in housing prices. It was followed closely by Tampa, Florida, where prices rose 32.6%, and Miami, which had a 29.7% increase in housing prices year over year.
At the far end of the spectrum, home prices in Washington rose only 11.9% annually.
Click here to see America’s hottest housing market
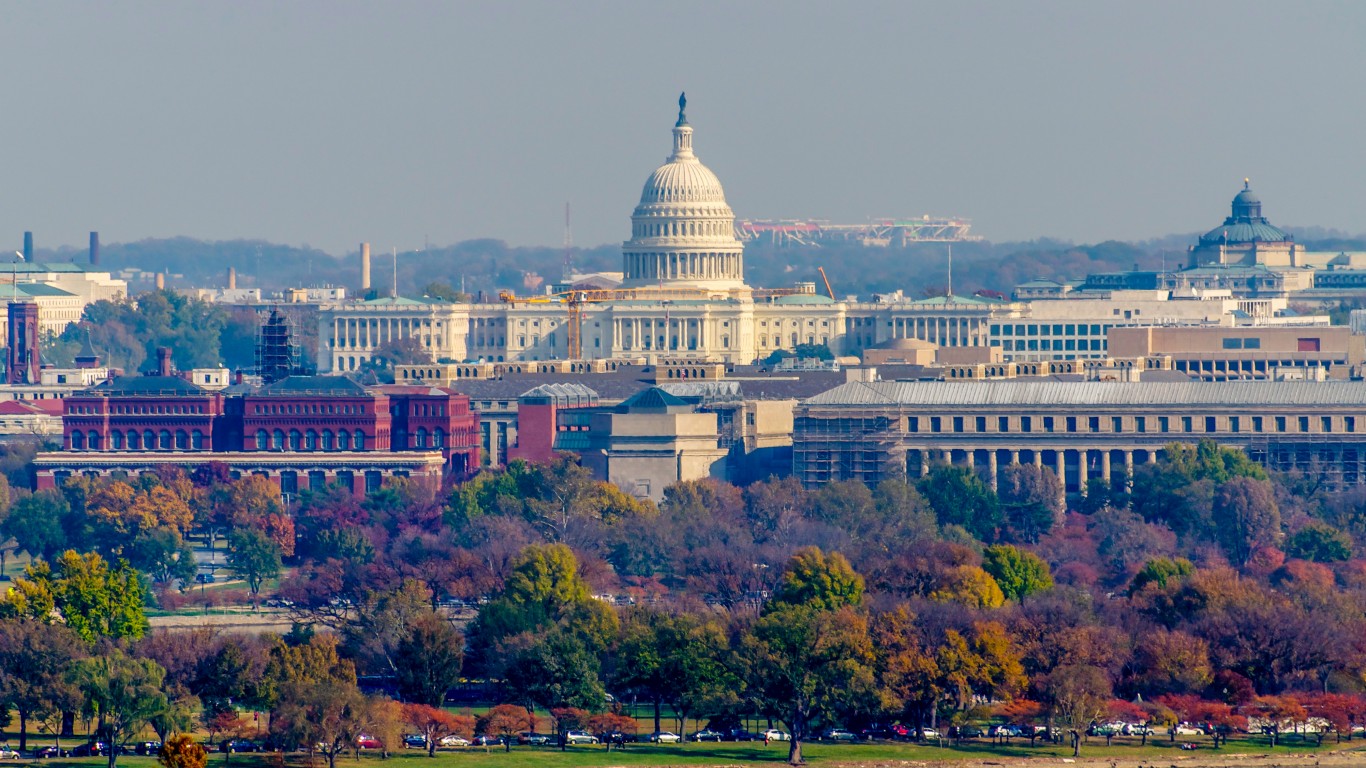
20. Washington, DC
> Pct. increase Feb 2021 to Feb 2022: 11.9%
> Pct. increase Jan 2022 to Feb 2022: 1.7% – #15 highest on list
[in-text-ad]

19. Minneapolis, MN
> Pct. increase Feb 2021 to Feb 2022: 12.0%
> Pct. increase Jan 2022 to Feb 2022: 1.1% – #18 highest on list

18. New York, NY
> Pct. increase Feb 2021 to Feb 2022: 12.9%
> Pct. increase Jan 2022 to Feb 2022: 1.1% – #18 highest on list
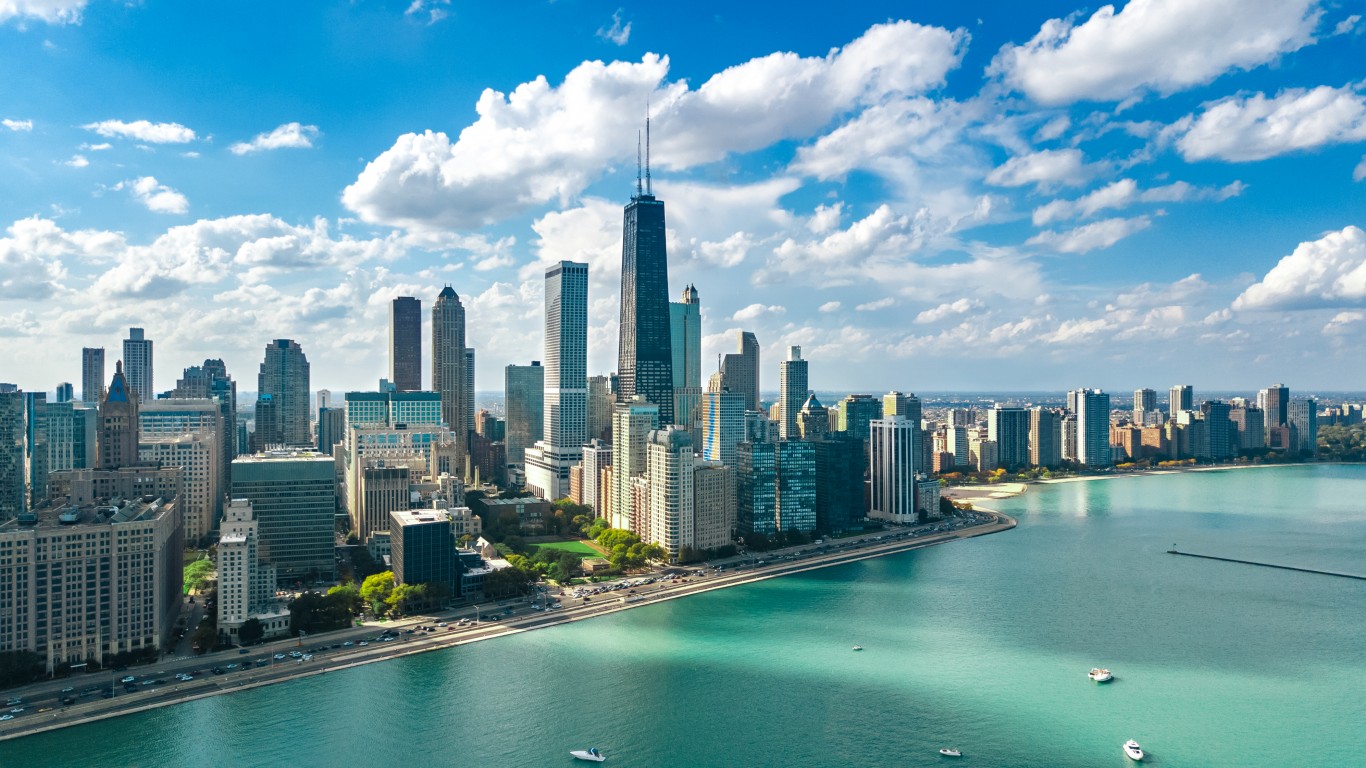
17. Chicago, IL
> Pct. increase Feb 2021 to Feb 2022: 13.1%
> Pct. increase Jan 2022 to Feb 2022: 1.2% – #17 highest on list
[in-text-ad-2]

16. Cleveland, OH
> Pct. increase Feb 2021 to Feb 2022: 13.6%
> Pct. increase Jan 2022 to Feb 2022: 0.9% – #20 highest on list
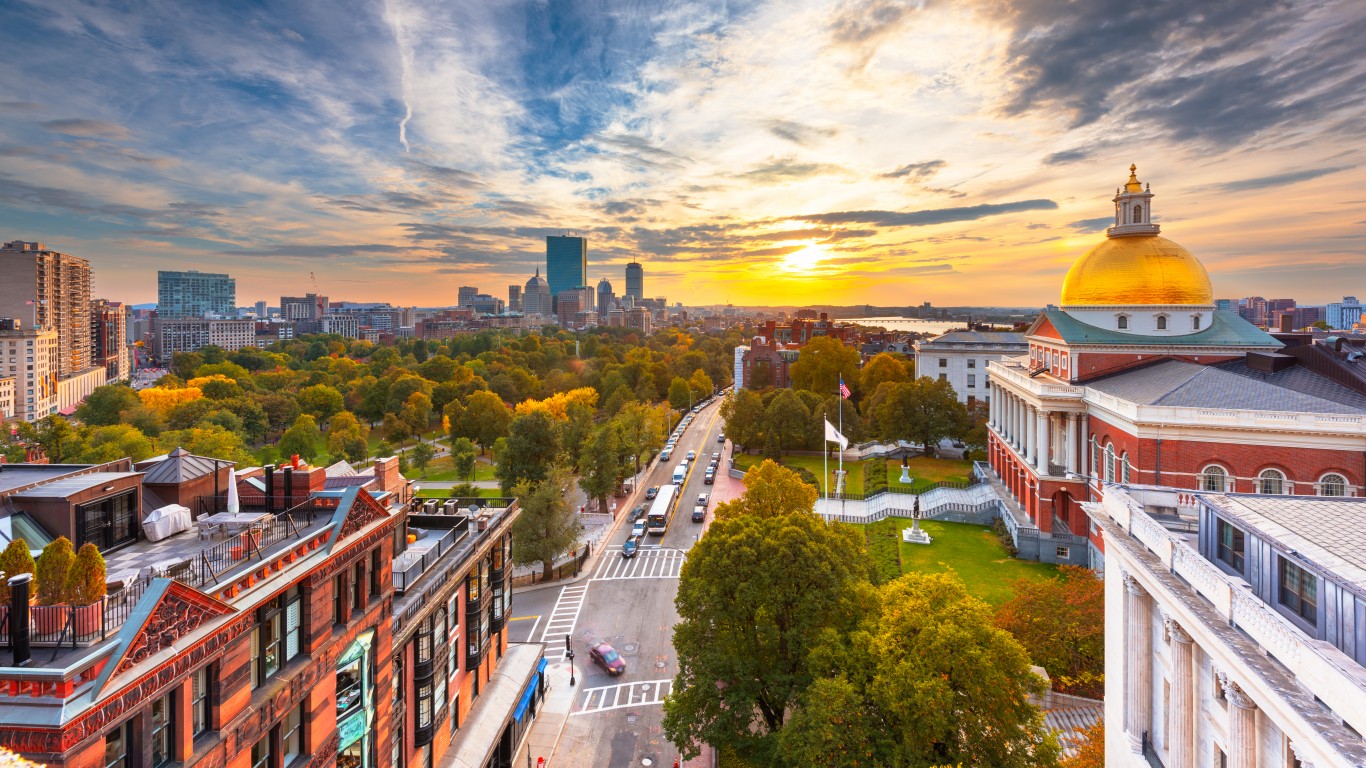
15. Boston, MA
> Pct. increase Feb 2021 to Feb 2022: 14.6%
> Pct. increase Jan 2022 to Feb 2022: 2.1% – #11 highest on list
[in-text-ad]
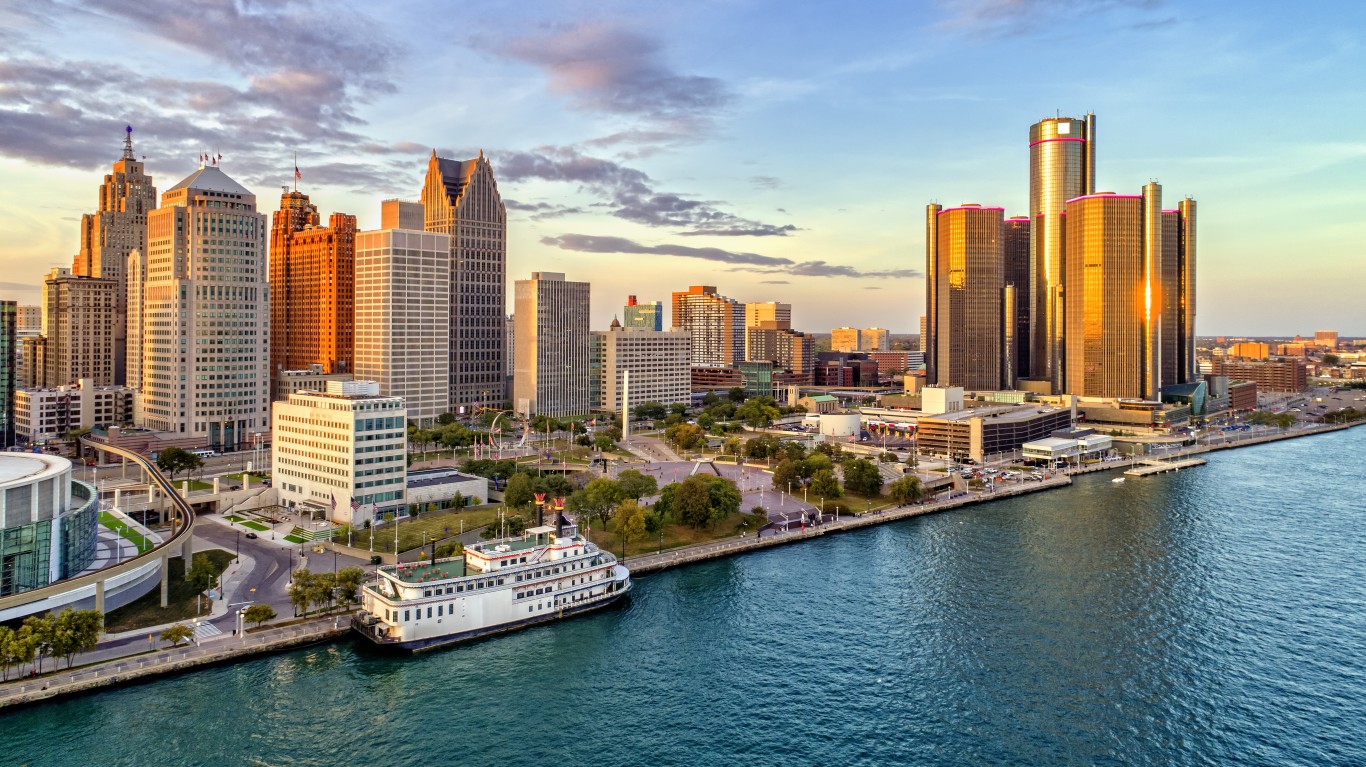
14. Detroit, MI
> Pct. increase Feb 2021 to Feb 2022: 14.6%
> Pct. increase Jan 2022 to Feb 2022: 1.6% – #16 highest on list
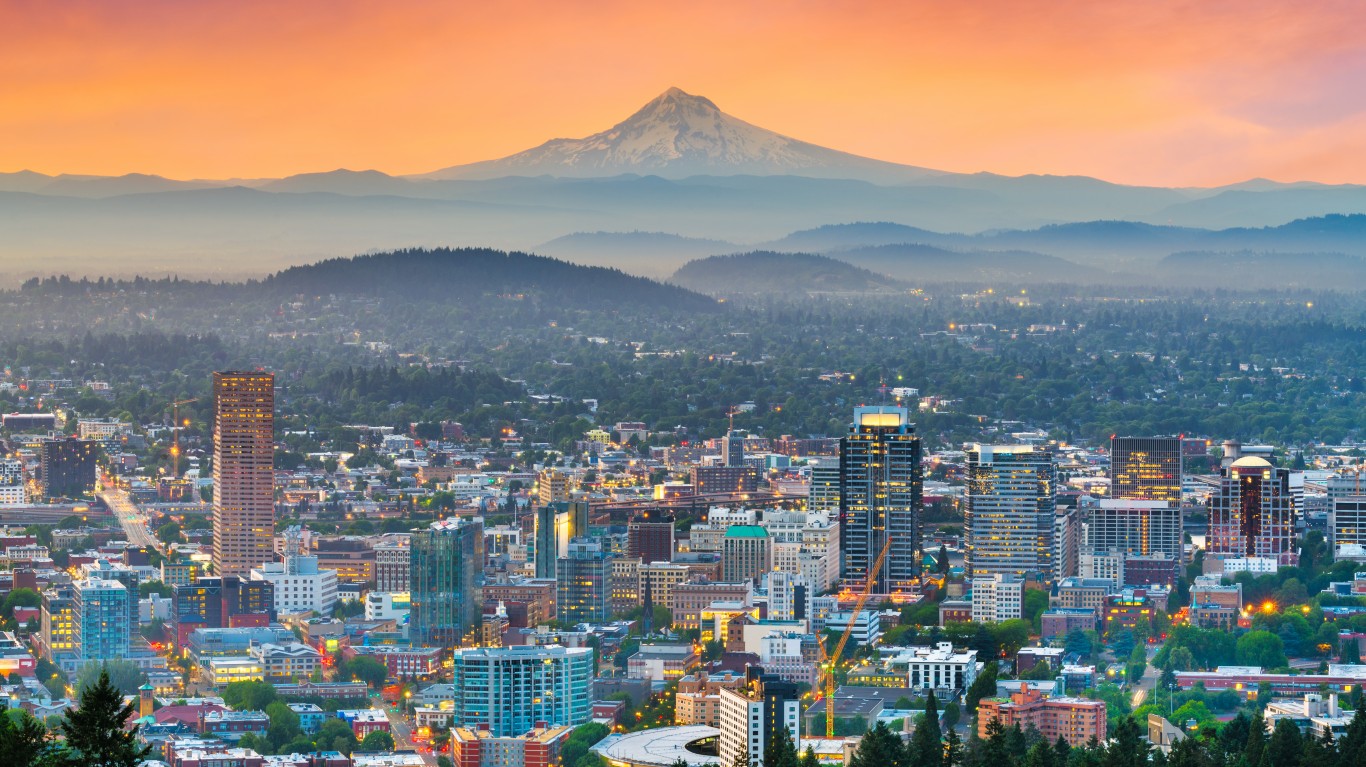
13. Portland, OR
> Pct. increase Feb 2021 to Feb 2022: 19.0%
> Pct. increase Jan 2022 to Feb 2022: 2.5% – #8 highest on list

12. Los Angeles, CA
> Pct. increase Feb 2021 to Feb 2022: 22.1%
> Pct. increase Jan 2022 to Feb 2022: 3.2% – #4 highest on list
[in-text-ad-2]

11. Denver, CO
> Pct. increase Feb 2021 to Feb 2022: 22.3%
> Pct. increase Jan 2022 to Feb 2022: 3.1% – #5 highest on list

10. San Francisco, CA
> Pct. increase Feb 2021 to Feb 2022: 22.9%
> Pct. increase Jan 2022 to Feb 2022: 3.7% – #3 highest on list
[in-text-ad]
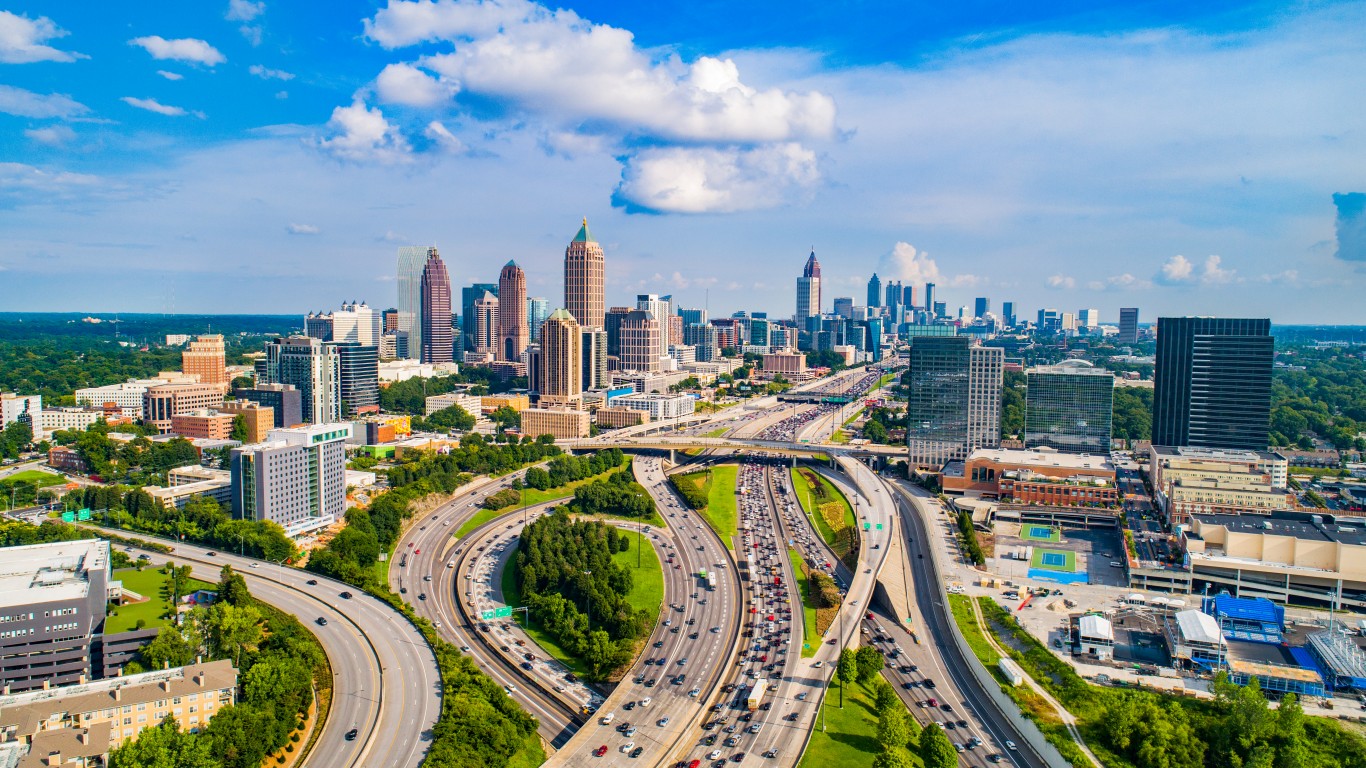
9. Atlanta, GA
> Pct. increase Feb 2021 to Feb 2022: 24.0%
> Pct. increase Jan 2022 to Feb 2022: 2.0% – #13 highest on list
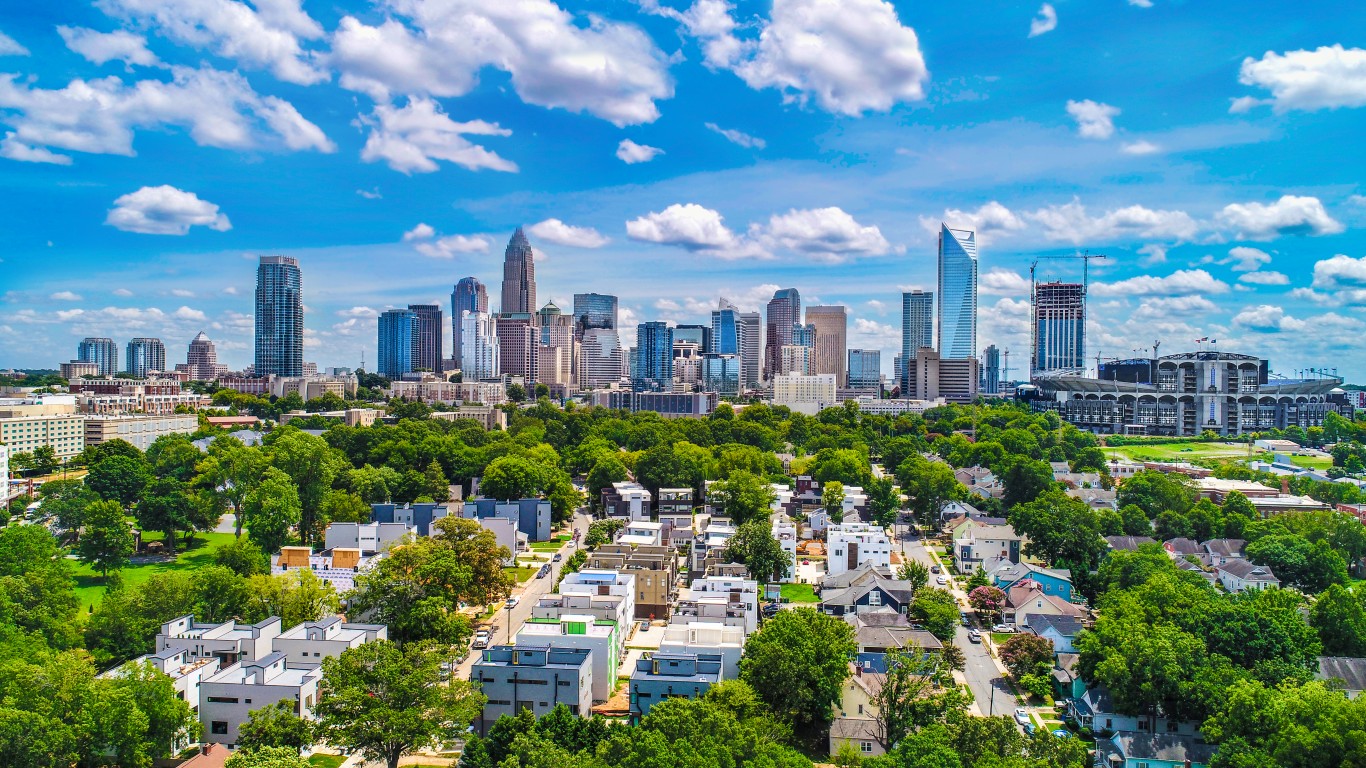
8. Charlotte, NC
> Pct. increase Feb 2021 to Feb 2022: 25.5%
> Pct. increase Jan 2022 to Feb 2022: 1.9% – #14 highest on list
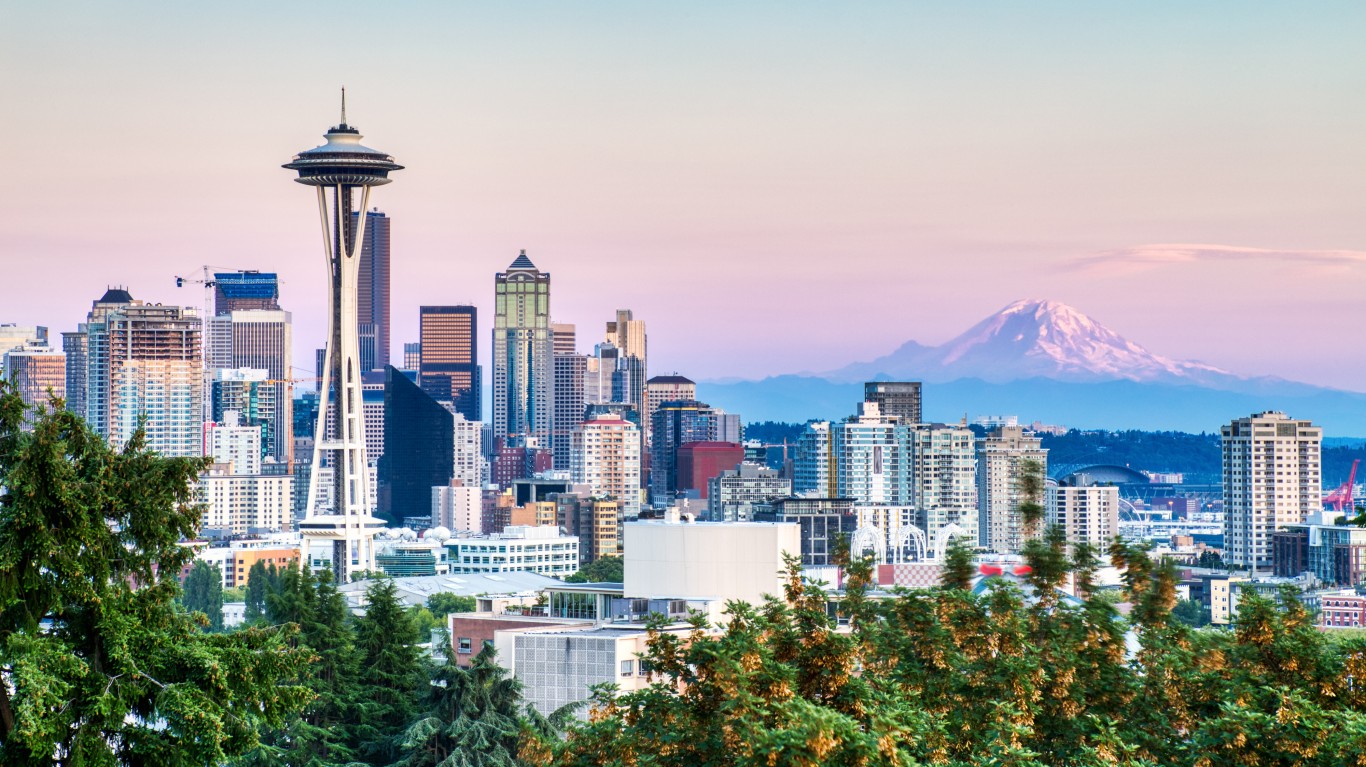
7. Seattle, WA
> Pct. increase Feb 2021 to Feb 2022: 26.6%
> Pct. increase Jan 2022 to Feb 2022: 4.4% – #2 highest on list
[in-text-ad-2]

6. Las Vegas, NV
> Pct. increase Feb 2021 to Feb 2022: 27.5%
> Pct. increase Jan 2022 to Feb 2022: 2.1% – #11 highest on list
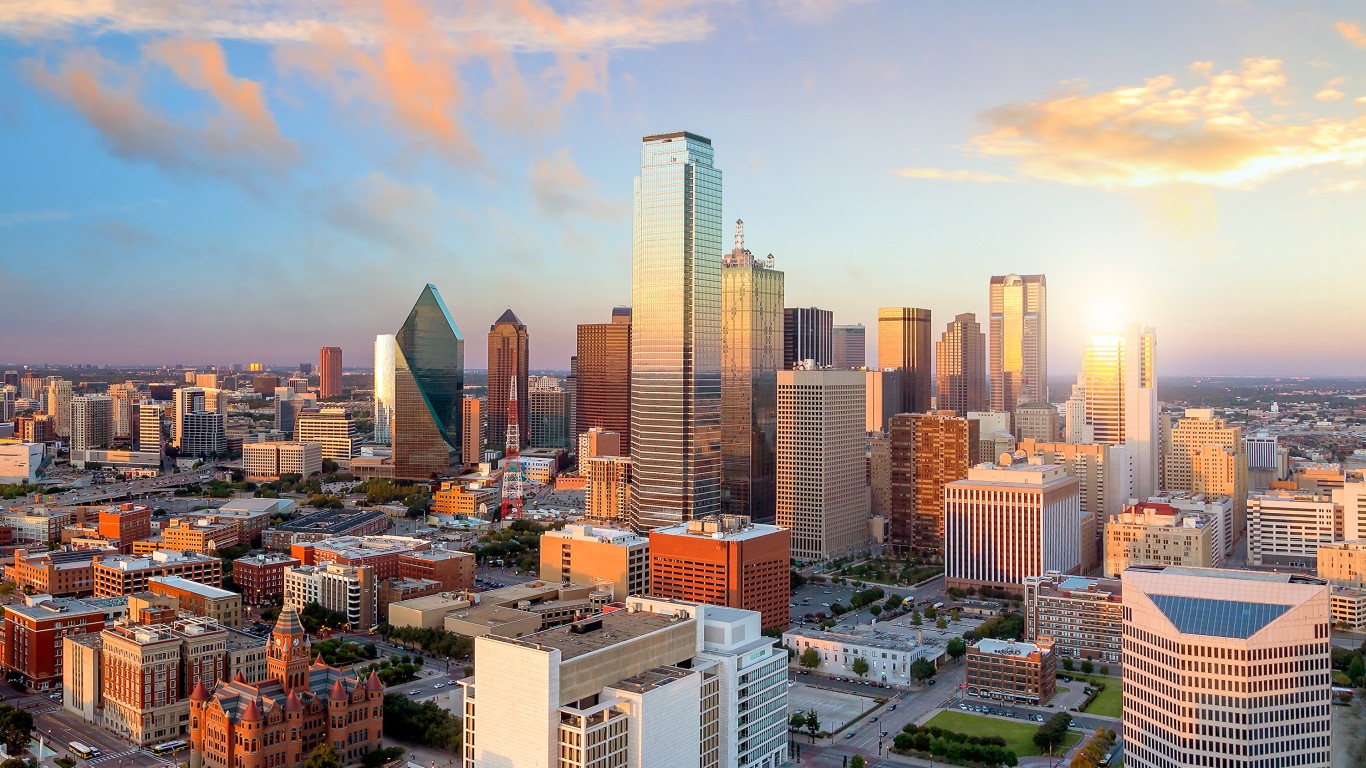
5. Dallas, TX
> Pct. increase Feb 2021 to Feb 2022: 28.8%
> Pct. increase Jan 2022 to Feb 2022: 2.9% – #6 highest on list
[in-text-ad]

4. San Diego, CA
> Pct. increase Feb 2021 to Feb 2022: 29.1%
> Pct. increase Jan 2022 to Feb 2022: 4.5% – #1 highest on list
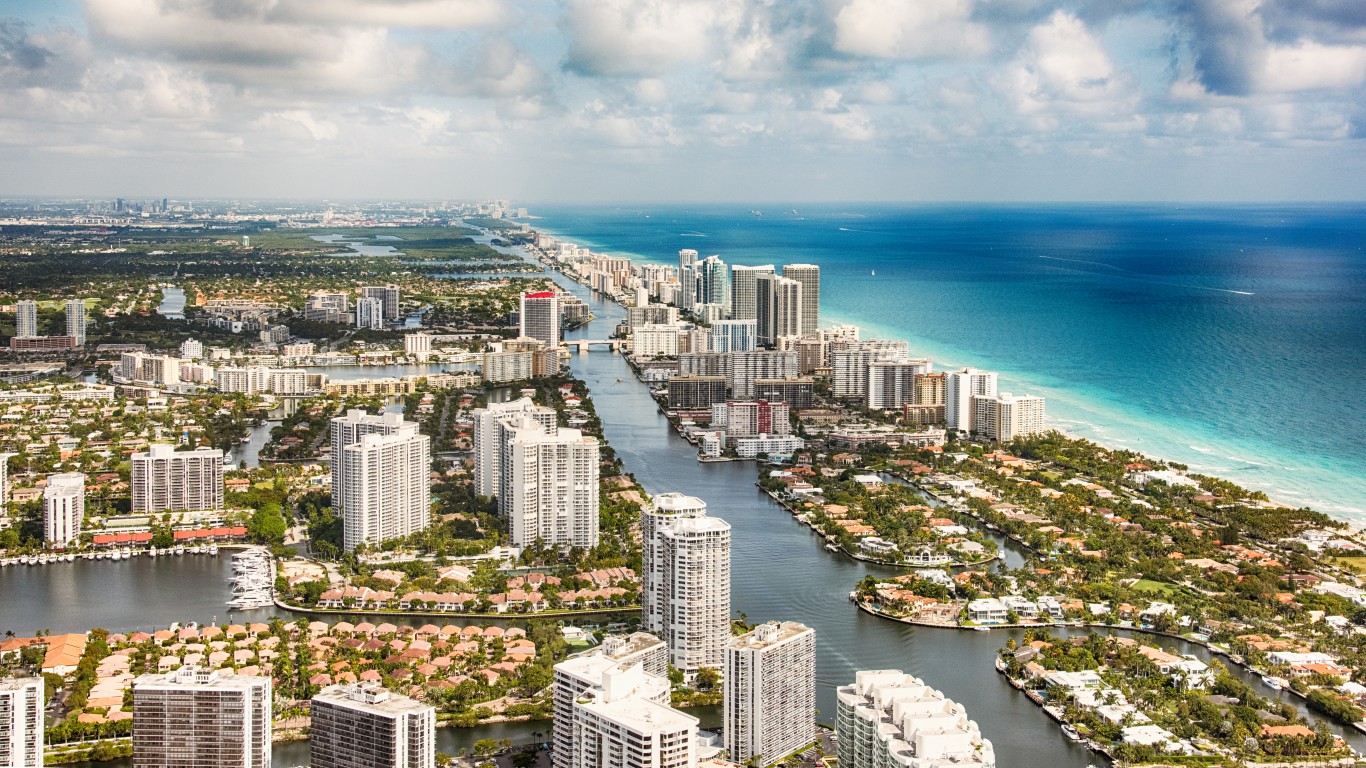
3. Miami, FL
> Pct. increase Feb 2021 to Feb 2022: 29.7%
> Pct. increase Jan 2022 to Feb 2022: 2.3% – #9 highest on list

2. Tampa, FL
> Pct. increase Feb 2021 to Feb 2022: 32.6%
> Pct. increase Jan 2022 to Feb 2022: 2.7% – #7 highest on list
[in-text-ad-2]
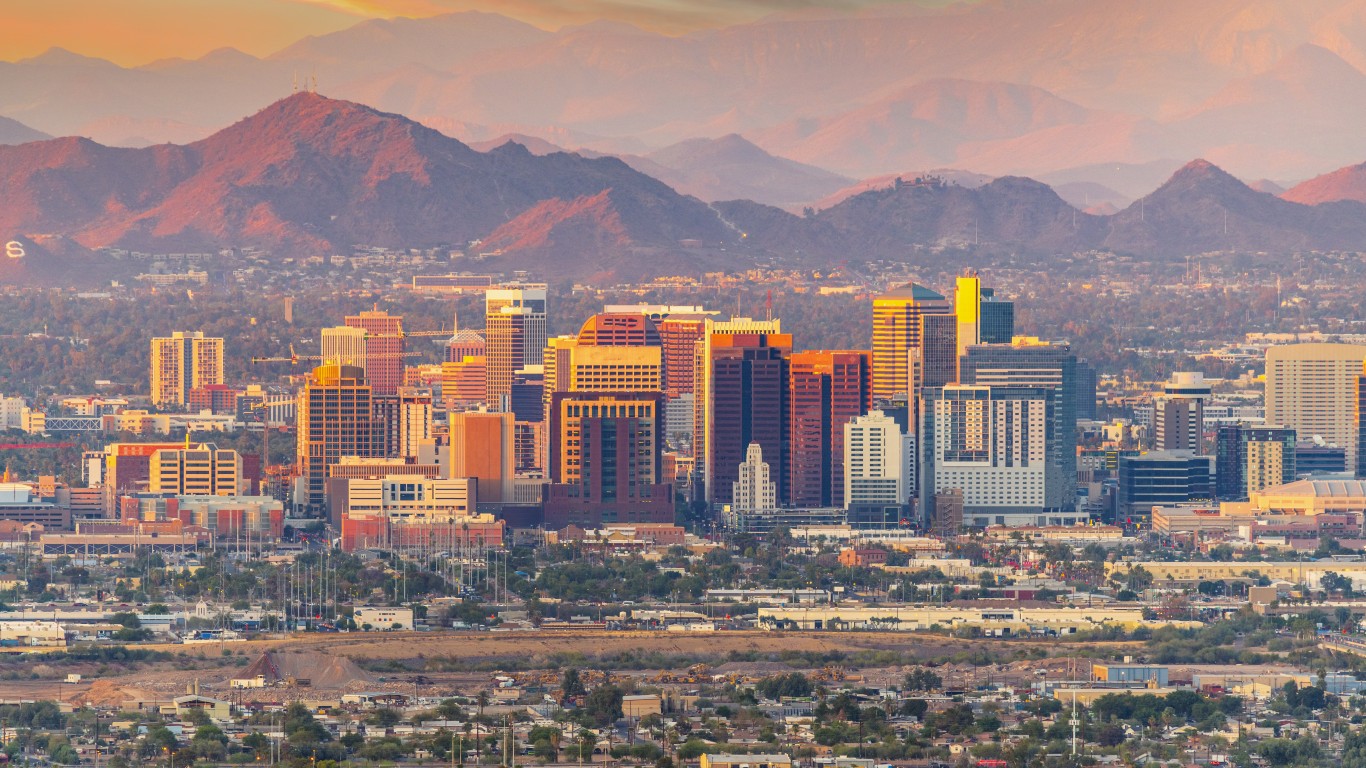
1. Phoenix, AZ
> Pct. increase Feb 2021 to Feb 2022: 32.9%
> Pct. increase Jan 2022 to Feb 2022: 2.2% – #10 highest on list
Are You Ahead, or Behind on Retirement? (sponsor)
If you’re one of the over 4 Million Americans set to retire this year, you may want to pay attention.
Finding a financial advisor who puts your interest first can be the difference between a rich retirement and barely getting by, and today it’s easier than ever. SmartAsset’s free tool matches you with up to three fiduciary financial advisors that serve your area in minutes. Each advisor has been carefully vetted, and must act in your best interests. Start your search now.
Don’t waste another minute; get started right here and help your retirement dreams become a retirement reality.
Thank you for reading! Have some feedback for us?
Contact the 24/7 Wall St. editorial team.
 24/7 Wall St.
 24/7 Wall St.