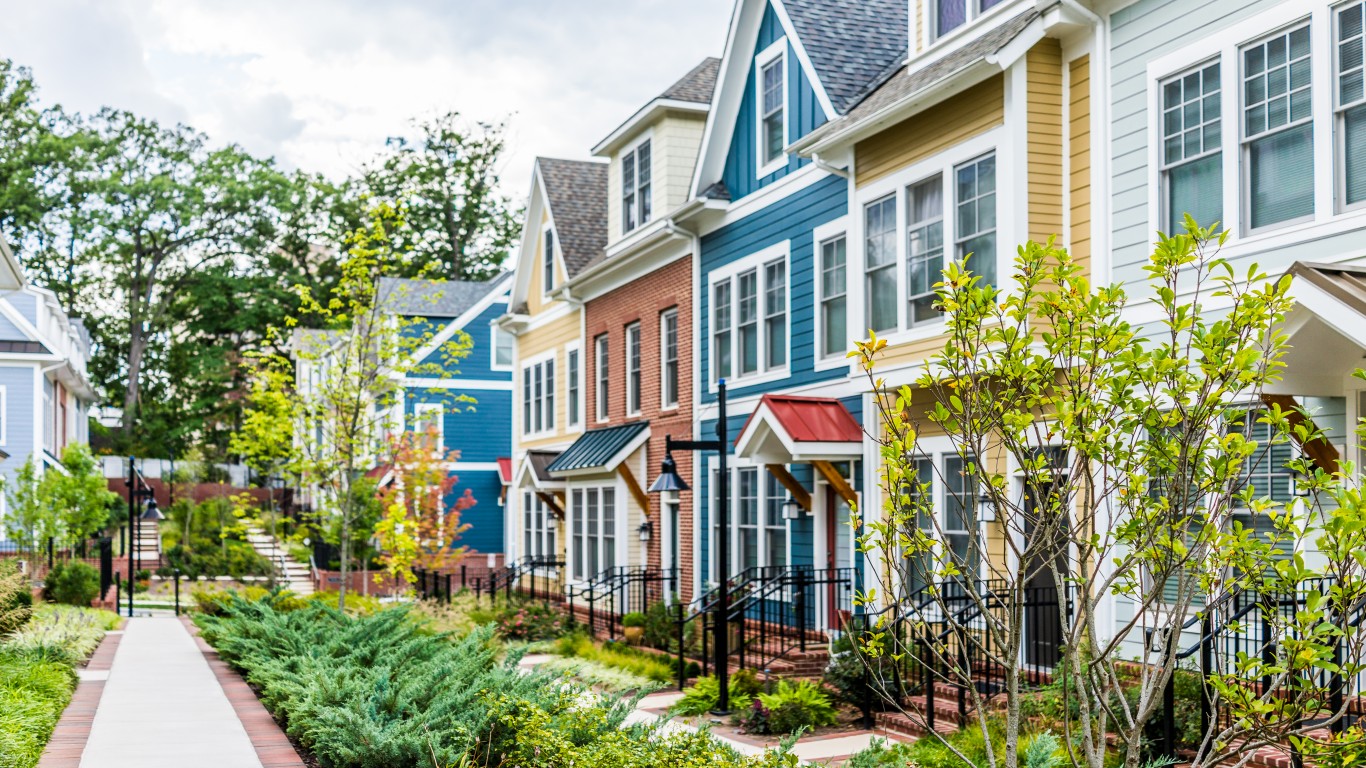
Rents across the country have gone through a period of historical growth in the past two years. According to real estate research firm CoStar Group, rents in the U.S. rose 11.3% last year. In contrast, over the previous five years, gross rents increased by 18.1%.
Rising rent prices are the result of soaring inflation and a squeeze on inventory. This lack of supply relative to demand comes as the number of people seeking to rent has increased substantially during the pandemic, while the number of available properties has been limited by shortages of building materials and other delays in construction resulting from the pandemic. This is the industry laying off the most Americans.
To determine the counties with the highest rent, 24/7 Wall St. reviewed five-year estimates of median gross rent from the U.S. Census Bureau’s 2020 American Community Survey. The median gross rent across the United States is $1,096, and in these 50 counties, rents range from $1,582 to as high as $2,435.
Of the 50 counties with the most expensive rent, California has by far the most, with 16, followed by Virginia with eight and three states with five each — Colorado, Massachusetts, and New York. These are the states with the highest rent. As a state, Virginia only ranks 9th highest for median gross rents, and some of Virginia’s counties have very low rents. However, the counties that make the list are all Washington D.C. suburbs and are some of the most affluent counties in America. These are the richest cities in America.
In many of the counties where rent costs are higher, a higher share of housing units are occupied by renters, rather than homeowners. This is largely because these places have more expensive housing markets as a whole, meaning residents are priced out of the possibility of owning a home and are forced to rent. Nationwide, the median home value is $229,800. In 49 of the 50 counties on this list, the typical home is more expensive than the national median, and in most cases, far more expensive. Six counties on this list have a median home value in excess of $1 million. Four of these are in California, the fifth is the Island of Nantucket, and the sixth is New York County, better known as Manhattan.
While rents in these markets are much higher than the national figure, renting property is actually in some places relatively affordable after accounting for the typical resident’s income. In about half the counties on this list, median gross rent accounts for less than 29.6% of the local median household income – the national figure. In San Francisco County, which has the fifth highest median gross rent of any county in the country, that figure amounts to just 24% of the county’s typical household income.
Click here to see the counties with the highest rent in America
Click here to read our detailed methodology
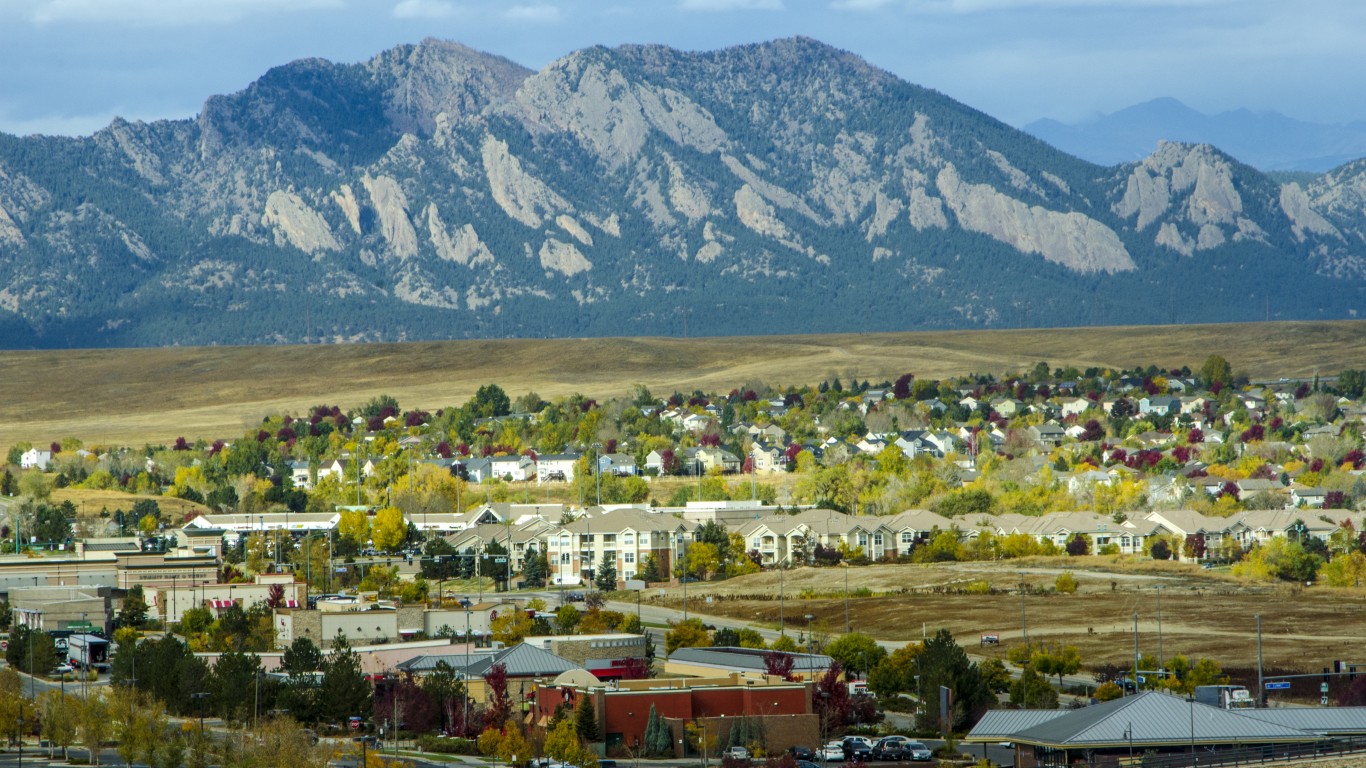
50. Boulder County, Colorado
> Median monthly rental cost: $1,582
> Share of income typically spent on rent: 33.7% — 158th highest of 2,761 counties (tied)
> Rental occupied housing units: 36.4% — 419th highest of 2,761 counties
> Median home value: $539,100 — 43rd highest of 2,761 counties
[in-text-ad]
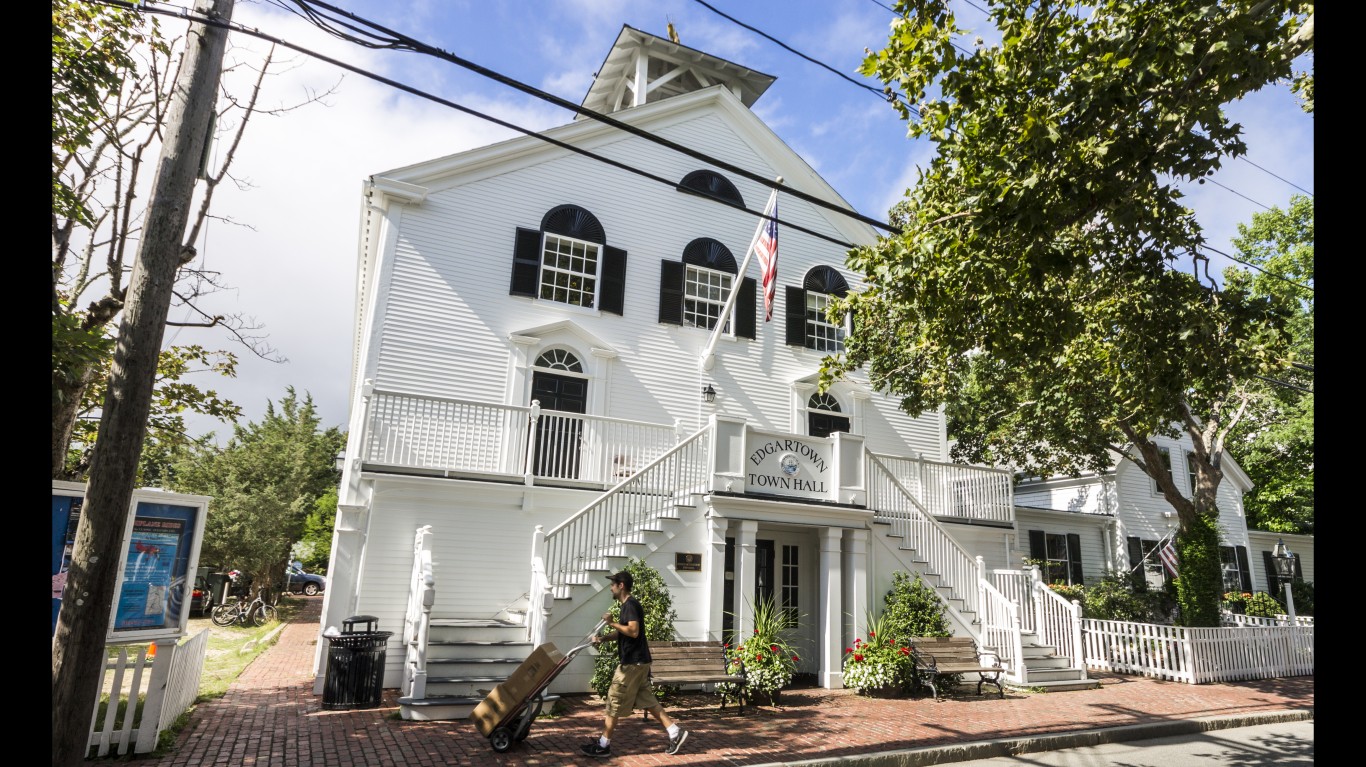
49. Dukes County, Massachusetts
> Median monthly rental cost: $1,589
> Share of income typically spent on rent: 35.0% — 97th highest of 2,761 counties (tied)
> Rental occupied housing units: 27.5% — 1,341st highest of 2,761 counties
> Median home value: $794,000 — 10th highest of 2,761 counties

48. Williamson County, Tennessee
> Median monthly rental cost: $1,596
> Share of income typically spent on rent: 27.1% — 1,159th lowest of 2,761 counties (tied)
> Rental occupied housing units: 20.6% — 373rd lowest of 2,761 counties
> Median home value: $471,300 — 56th highest of 2,761 counties
47. Pitkin County, Colorado
> Median monthly rental cost: $1,598
> Share of income typically spent on rent: 28.6% — 1,052nd highest of 2,761 counties (tied)
> Rental occupied housing units: 32.6% — 704th highest of 2,761 counties
> Median home value: $599,000 — 29th highest of 2,761 counties
[in-text-ad-2]
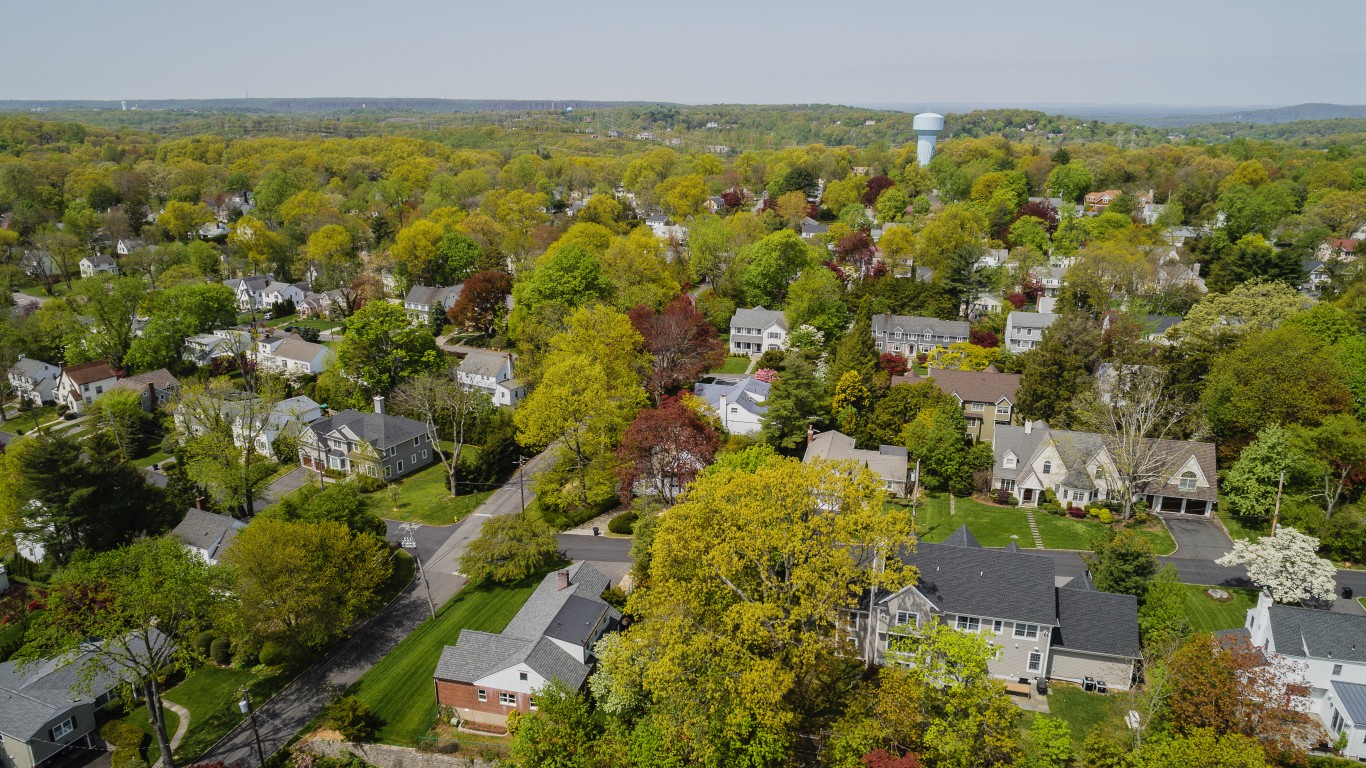
46. Westchester County, New York
> Median monthly rental cost: $1,599
> Share of income typically spent on rent: 31.7% — 336th highest of 2,761 counties (tied)
> Rental occupied housing units: 38.6% — 289th highest of 2,761 counties
> Median home value: $544,100 — 41st highest of 2,761 counties

45. Monterey County, California
> Median monthly rental cost: $1,600
> Share of income typically spent on rent: 32.5% — 235th highest of 2,761 counties (tied)
> Rental occupied housing units: 48.2% — 66th highest of 2,761 counties
> Median home value: $559,400 — 37th highest of 2,761 counties
[in-text-ad]

44. District of Columbia, District of Columbia
> Median monthly rental cost: $1,607
> Share of income typically spent on rent: 28.2% — 1,188th highest of 2,761 counties (tied)
> Rental occupied housing units: 57.5% — 18th highest of 2,761 counties
> Median home value: $618,100 — 21st highest of 2,761 counties
43. Eagle County, Colorado
> Median monthly rental cost: $1,611
> Share of income typically spent on rent: 33.3% — 179th highest of 2,761 counties (tied)
> Rental occupied housing units: 30.3% — 964th highest of 2,761 counties
> Median home value: $617,200 — 22nd highest of 2,761 counties

42. Placer County, California
> Median monthly rental cost: $1,616
> Share of income typically spent on rent: 31.0% — 440th highest of 2,761 counties (tied)
> Rental occupied housing units: 26.6% — 1,262nd lowest of 2,761 counties
> Median home value: $495,900 — 48th highest of 2,761 counties
[in-text-ad-2]
41. Morris County, New Jersey
> Median monthly rental cost: $1,622
> Share of income typically spent on rent: 26.6% — 1,020th lowest of 2,761 counties (tied)
> Rental occupied housing units: 26.2% — 1,196th lowest of 2,761 counties
> Median home value: $462,100 — 58th highest of 2,761 counties

40. Queens County, New York
> Median monthly rental cost: $1,629
> Share of income typically spent on rent: 31.6% — 350th highest of 2,761 counties (tied)
> Rental occupied housing units: 54.9% — 28th highest of 2,761 counties
> Median home value: $575,600 — 35th highest of 2,761 counties
[in-text-ad]
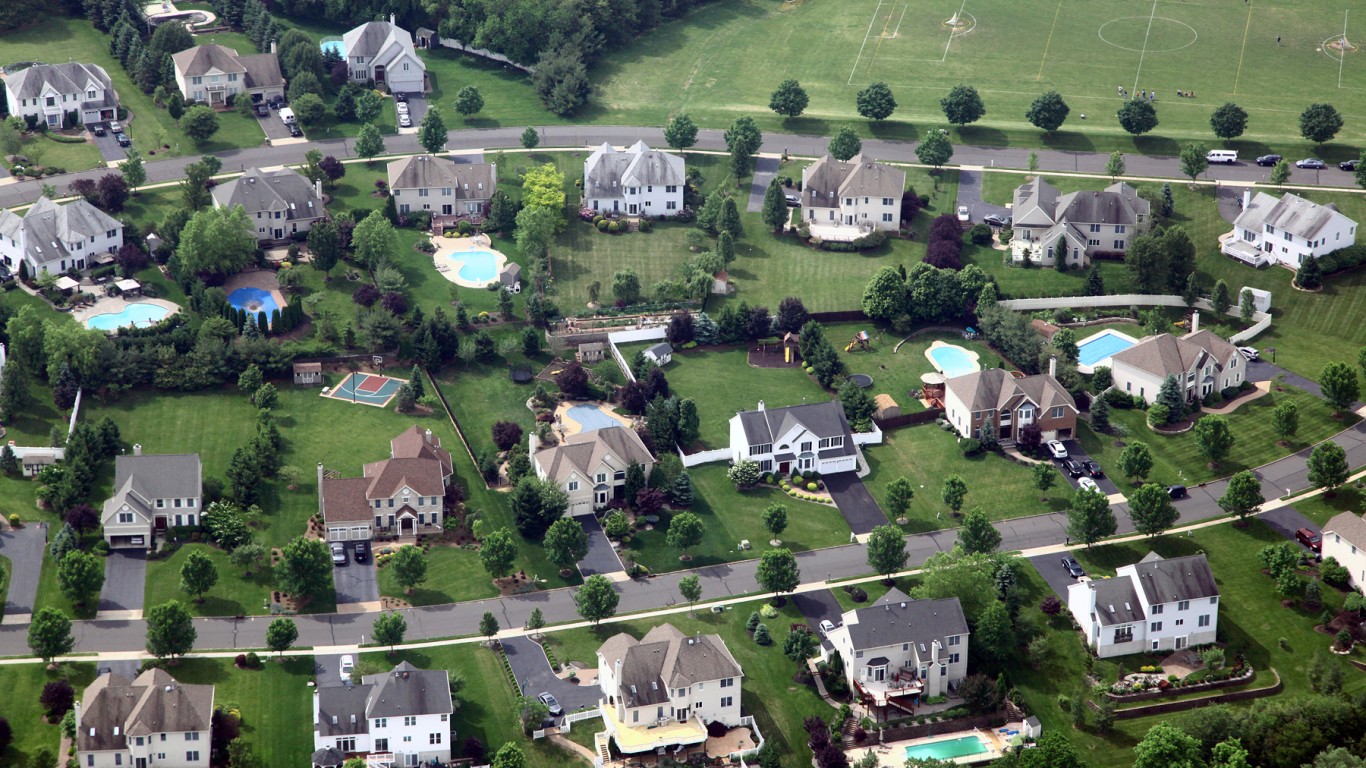
39. Somerset County, New Jersey
> Median monthly rental cost: $1,636
> Share of income typically spent on rent: 28.8% — 977th highest of 2,761 counties (tied)
> Rental occupied housing units: 24.3% — 900th lowest of 2,761 counties
> Median home value: $436,700 — 68th highest of 2,761 counties

38. Suffolk County, Massachusetts
> Median monthly rental cost: $1,657
> Share of income typically spent on rent: 29.8% — 664th highest of 2,761 counties (tied)
> Rental occupied housing units: 63.7% — 8th highest of 2,761 counties
> Median home value: $547,300 — 39th highest of 2,761 counties

37. Norfolk County, Massachusetts
> Median monthly rental cost: $1,682
> Share of income typically spent on rent: 29.5% — 753rd highest of 2,761 counties (tied)
> Rental occupied housing units: 31.2% — 861st highest of 2,761 counties
> Median home value: $491,000 — 52nd highest of 2,761 counties
[in-text-ad-2]
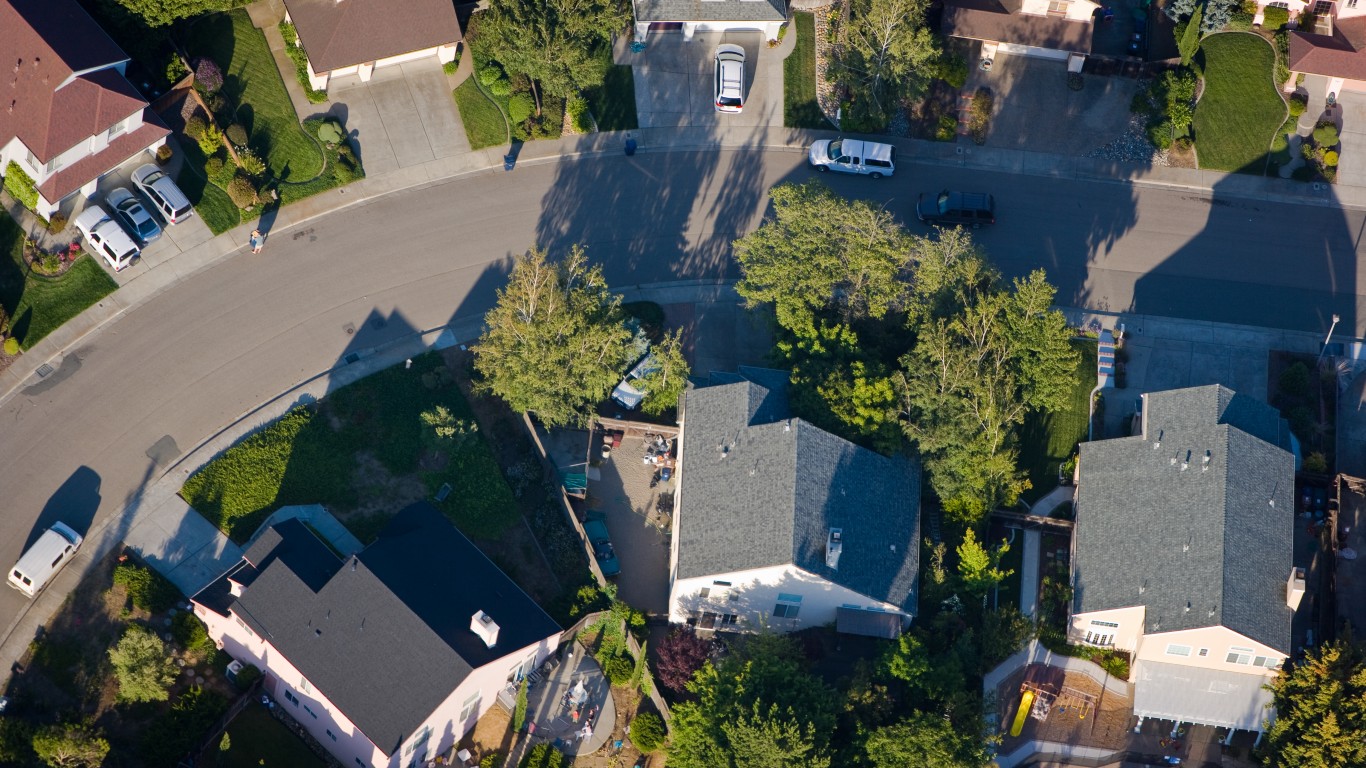
36. Solano County, California
> Median monthly rental cost: $1,684
> Share of income typically spent on rent: 31.6% — 350th highest of 2,761 counties (tied)
> Rental occupied housing units: 37.9% — 318th highest of 2,761 counties
> Median home value: $437,900 — 67th highest of 2,761 counties
35. Charles County, Maryland
> Median monthly rental cost: $1,686
> Share of income typically spent on rent: 29.5% — 753rd highest of 2,761 counties (tied)
> Rental occupied housing units: 23.1% — 710th lowest of 2,761 counties
> Median home value: $326,800 — 162nd highest of 2,761 counties
[in-text-ad]

34. Anne Arundel County, Maryland
> Median monthly rental cost: $1,690
> Share of income typically spent on rent: 28.9% — 941st highest of 2,761 counties (tied)
> Rental occupied housing units: 25.7% — 1,125th lowest of 2,761 counties
> Median home value: $370,100 — 108th highest of 2,761 counties

33. King County, Washington
> Median monthly rental cost: $1,695
> Share of income typically spent on rent: 28.1% — 1,216th highest of 2,761 counties (tied)
> Rental occupied housing units: 43.5% — 143rd highest of 2,761 counties
> Median home value: $601,100 — 28th highest of 2,761 counties

32. Santa Barbara County, California
> Median monthly rental cost: $1,697
> Share of income typically spent on rent: 32.8% — 217th highest of 2,761 counties (tied)
> Rental occupied housing units: 47.7% — 72nd highest of 2,761 counties
> Median home value: $610,300 — 24th highest of 2,761 counties
[in-text-ad-2]
31. Manassas Park city, Virginia
> Median monthly rental cost: $1,709
> Share of income typically spent on rent: 33.6% — 161st highest of 2,761 counties (tied)
> Rental occupied housing units: 39.3% — 267th highest of 2,761 counties
> Median home value: $299,700 — 206th highest of 2,761 counties

30. Broomfield County, Colorado
> Median monthly rental cost: $1,711
> Share of income typically spent on rent: 28.6% — 1,052nd highest of 2,761 counties (tied)
> Rental occupied housing units: 33.7% — 605th highest of 2,761 counties
> Median home value: $450,600 — 63rd highest of 2,761 counties
[in-text-ad]

29. Middlesex County, Massachusetts
> Median monthly rental cost: $1,714
> Share of income typically spent on rent: 27.8% — 1,329th highest of 2,761 counties (tied)
> Rental occupied housing units: 37.9% — 321st highest of 2,761 counties
> Median home value: $540,300 — 42nd highest of 2,761 counties

28. Monroe County, Florida
> Median monthly rental cost: $1,714
> Share of income typically spent on rent: 34.1% — 137th highest of 2,761 counties (tied)
> Rental occupied housing units: 40.9% — 217th highest of 2,761 counties
> Median home value: $558,100 — 38th highest of 2,761 counties

27. Howard County, Maryland
> Median monthly rental cost: $1,731
> Share of income typically spent on rent: 27.6% — 1,332nd lowest of 2,761 counties (tied)
> Rental occupied housing units: 27.3% — 1,379th lowest of 2,761 counties
> Median home value: $464,500 — 57th highest of 2,761 counties
[in-text-ad-2]

26. San Diego County, California
> Median monthly rental cost: $1,732
> Share of income typically spent on rent: 33.3% — 179th highest of 2,761 counties (tied)
> Rental occupied housing units: 46.1% — 95th highest of 2,761 counties
> Median home value: $595,600 — 31st highest of 2,761 counties

25. Prince William County, Virginia
> Median monthly rental cost: $1,738
> Share of income typically spent on rent: 29.7% — 688th highest of 2,761 counties (tied)
> Rental occupied housing units: 26.9% — 1,323rd lowest of 2,761 counties
> Median home value: $390,500 — 91st highest of 2,761 counties
[in-text-ad]

24. Sonoma County, California
> Median monthly rental cost: $1,743
> Share of income typically spent on rent: 32.3% — 256th highest of 2,761 counties (tied)
> Rental occupied housing units: 38.7% — 286th highest of 2,761 counties
> Median home value: $640,000 — 20th highest of 2,761 counties
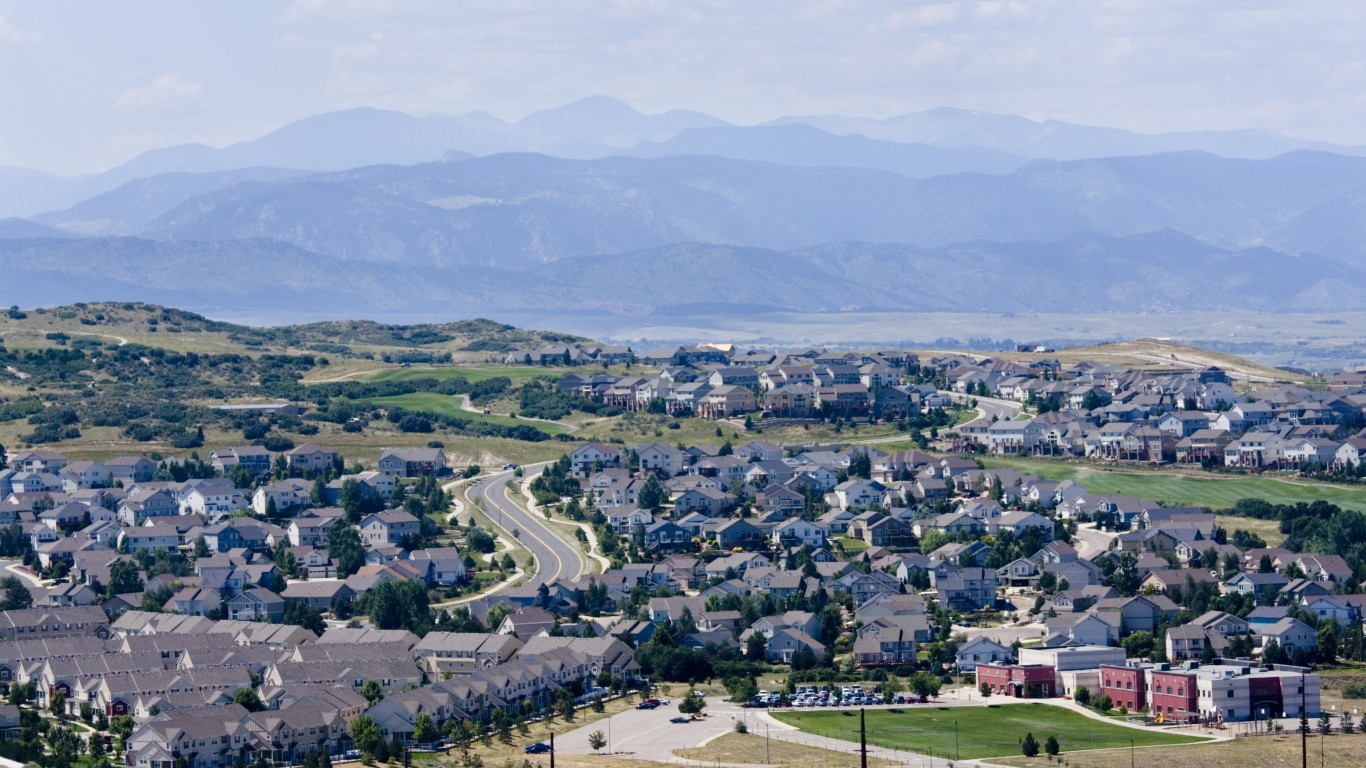
23. Douglas County, Colorado
> Median monthly rental cost: $1,749
> Share of income typically spent on rent: 29.0% — 908th highest of 2,761 counties (tied)
> Rental occupied housing units: 20.8% — 406th lowest of 2,761 counties
> Median home value: $493,500 — 49th highest of 2,761 counties
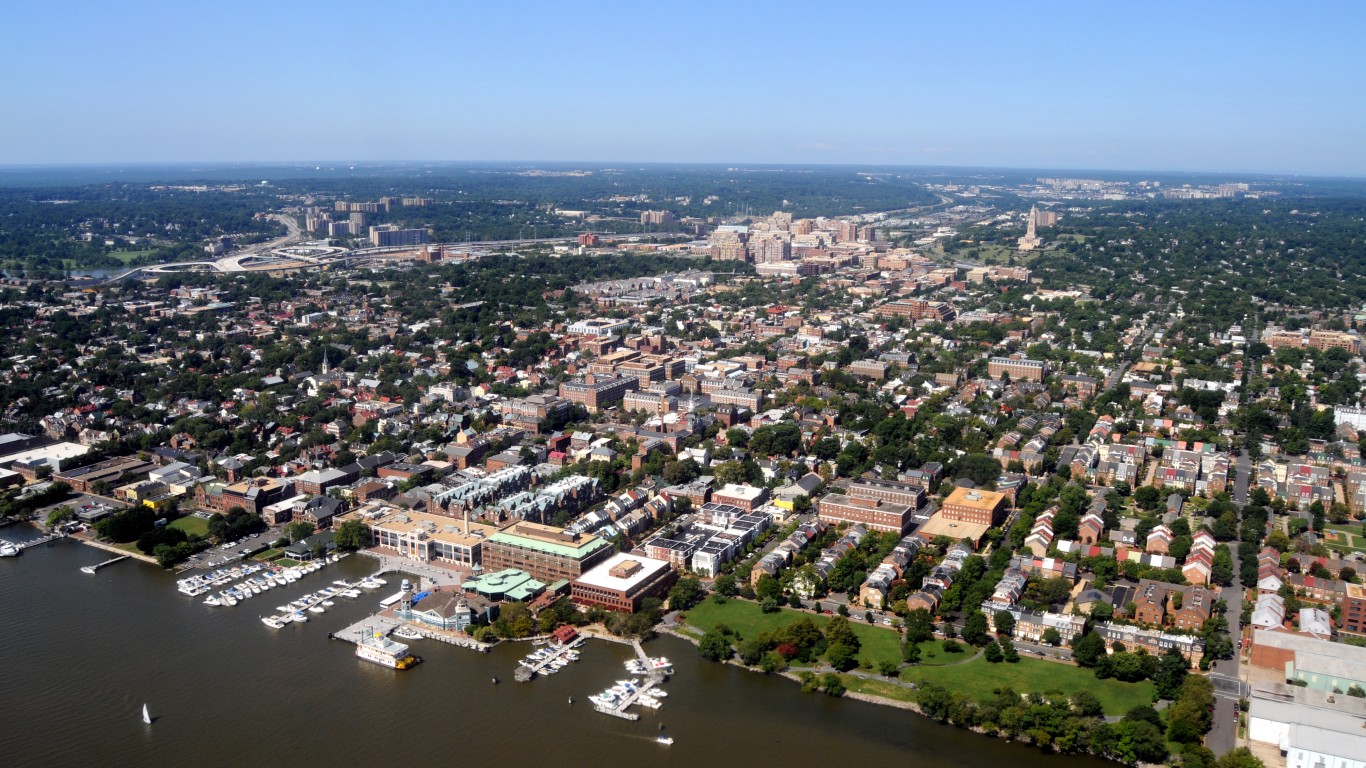
22. Alexandria city, Virginia
> Median monthly rental cost: $1,774
> Share of income typically spent on rent: 27.4% — 1,257th lowest of 2,761 counties (tied)
> Rental occupied housing units: 56.6% — 20th highest of 2,761 counties
> Median home value: $572,700 — 36th highest of 2,761 counties
[in-text-ad-2]

21. Napa County, California
> Median monthly rental cost: $1,775
> Share of income typically spent on rent: 31.4% — 386th highest of 2,761 counties (tied)
> Rental occupied housing units: 35.2% — 490th highest of 2,761 counties
> Median home value: $666,900 — 17th highest of 2,761 counties

20. Honolulu County, Hawaii
> Median monthly rental cost: $1,779
> Share of income typically spent on rent: 33.4% — 174th highest of 2,761 counties (tied)
> Rental occupied housing units: 42.5% — 161st highest of 2,761 counties
> Median home value: $702,300 — 15th highest of 2,761 counties
[in-text-ad]

19. Nantucket County, Massachusetts
> Median monthly rental cost: $1,781
> Share of income typically spent on rent: 27.6% — 1,332nd lowest of 2,761 counties (tied)
> Rental occupied housing units: 30.9% — 889th highest of 2,761 counties
> Median home value: $1,117,300 — 3rd highest of 2,761 counties

18. Montgomery County, Maryland
> Median monthly rental cost: $1,784
> Share of income typically spent on rent: 30.2% — 583rd highest of 2,761 counties (tied)
> Rental occupied housing units: 34.4% — 547th highest of 2,761 counties
> Median home value: $491,700 — 51st highest of 2,761 counties

17. New York County, New York
> Median monthly rental cost: $1,787
> Share of income typically spent on rent: 27.6% — 1,332nd lowest of 2,761 counties (tied)
> Rental occupied housing units: 75.9% — 2nd highest of 2,761 counties
> Median home value: $1,024,500 — 6th highest of 2,761 counties
[in-text-ad-2]

16. Suffolk County, New York
> Median monthly rental cost: $1,810
> Share of income typically spent on rent: 34.1% — 137th highest of 2,761 counties (tied)
> Rental occupied housing units: 18.6% — 193rd lowest of 2,761 counties
> Median home value: $413,900 — 81st highest of 2,761 counties

15. Fairfax city, Virginia
> Median monthly rental cost: $1,822
> Share of income typically spent on rent: 29.7% — 688th highest of 2,761 counties (tied)
> Rental occupied housing units: 30.1% — 980th highest of 2,761 counties
> Median home value: $587,000 — 33rd highest of 2,761 counties
[in-text-ad]
14. Nassau County, New York
> Median monthly rental cost: $1,831
> Share of income typically spent on rent: 32.5% — 235th highest of 2,761 counties (tied)
> Rental occupied housing units: 18.9% — 215th lowest of 2,761 counties
> Median home value: $524,400 — 47th highest of 2,761 counties

13. Santa Cruz County, California
> Median monthly rental cost: $1,843
> Share of income typically spent on rent: 33.3% — 179th highest of 2,761 counties (tied)
> Rental occupied housing units: 39.7% — 258th highest of 2,761 counties
> Median home value: $787,000 — 11th highest of 2,761 counties

12. Ventura County, California
> Median monthly rental cost: $1,854
> Share of income typically spent on rent: 34.2% — 131st highest of 2,761 counties (tied)
> Rental occupied housing units: 36.7% — 399th highest of 2,761 counties
> Median home value: $609,200 — 25th highest of 2,761 counties
[in-text-ad-2]

11. Fairfax County, Virginia
> Median monthly rental cost: $1,898
> Share of income typically spent on rent: 28.3% — 1,156th highest of 2,761 counties (tied)
> Rental occupied housing units: 31.4% — 833rd highest of 2,761 counties
> Median home value: $576,700 — 34th highest of 2,761 counties

10. Alameda County, California
> Median monthly rental cost: $1,904
> Share of income typically spent on rent: 29.3% — 812th highest of 2,761 counties (tied)
> Rental occupied housing units: 46.4% — 91st highest of 2,761 counties
> Median home value: $825,300 — 8th highest of 2,761 counties
[in-text-ad]

9. Loudoun County, Virginia
> Median monthly rental cost: $1,913
> Share of income typically spent on rent: 27.3% — 1,217th lowest of 2,761 counties (tied)
> Rental occupied housing units: 22.3% — 593rd lowest of 2,761 counties
> Median home value: $534,600 — 45th highest of 2,761 counties

8. Contra Costa County, California
> Median monthly rental cost: $1,928
> Share of income typically spent on rent: 31.4% — 386th highest of 2,761 counties (tied)
> Rental occupied housing units: 33.2% — 654th highest of 2,761 counties
> Median home value: $655,500 — 19th highest of 2,761 counties

7. Orange County, California
> Median monthly rental cost: $1,928
> Share of income typically spent on rent: 33.0% — 203rd highest of 2,761 counties (tied)
> Rental occupied housing units: 42.8% — 157th highest of 2,761 counties
> Median home value: $703,800 — 14th highest of 2,761 counties
[in-text-ad-2]

6. Arlington County, Virginia
> Median monthly rental cost: $2,005
> Share of income typically spent on rent: 25.3% — 706th lowest of 2,761 counties (tied)
> Rental occupied housing units: 57.5% — 19th highest of 2,761 counties
> Median home value: $731,700 — 13th highest of 2,761 counties

5. San Francisco County, California
> Median monthly rental cost: $2,010
> Share of income typically spent on rent: 24.0% — 424th lowest of 2,761 counties (tied)
> Rental occupied housing units: 62.0% — 9th highest of 2,761 counties
> Median home value: $1,152,300 — 2nd highest of 2,761 counties
[in-text-ad]
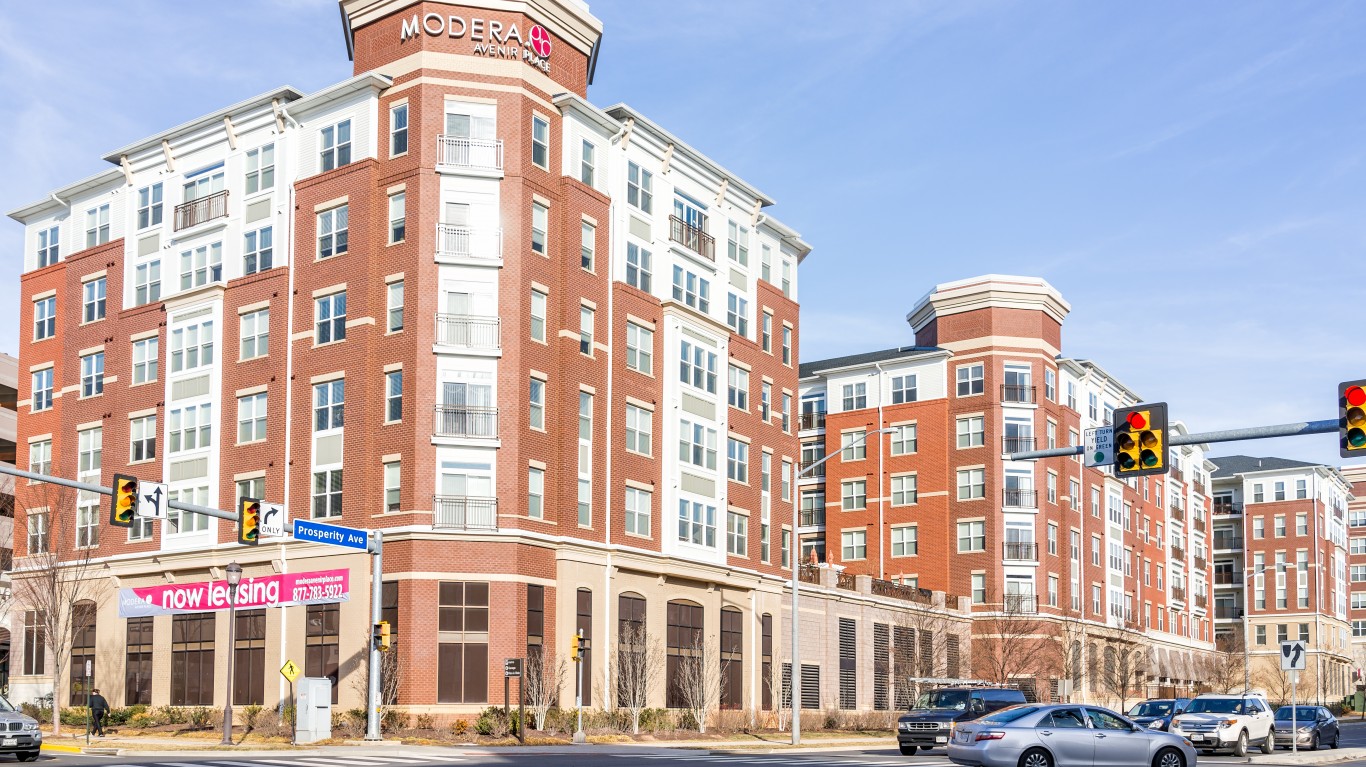
4. Falls Church city, Virginia
> Median monthly rental cost: $2,044
> Share of income typically spent on rent: 24.3% — 481st lowest of 2,761 counties (tied)
> Rental occupied housing units: 41.2% — 201st highest of 2,761 counties
> Median home value: $810,900 — 9th highest of 2,761 counties

3. Marin County, California
> Median monthly rental cost: $2,170
> Share of income typically spent on rent: 30.3% — 550th highest of 2,761 counties (tied)
> Rental occupied housing units: 36.4% — 417th highest of 2,761 counties
> Median home value: $1,053,600 — 5th highest of 2,761 counties

2. Santa Clara County, California
> Median monthly rental cost: $2,386
> Share of income typically spent on rent: 27.9% — 1,290th highest of 2,761 counties (tied)
> Rental occupied housing units: 43.6% — 140th highest of 2,761 counties
> Median home value: $1,061,900 — 4th highest of 2,761 counties
[in-text-ad-2]

1. San Mateo County, California
> Median monthly rental cost: $2,435
> Share of income typically spent on rent: 29.2% — 845th highest of 2,761 counties (tied)
> Rental occupied housing units: 40.1% — 245th highest of 2,761 counties
> Median home value: $1,163,100 — the highest of 2,761 counties
Methodology
To determine the counties with the highest rent, 24/7 Wall St. reviewed five-year estimates of median gross rent from the U.S. Census Bureau’s 2020 American Community Survey.
Counties were excluded if median gross rent was not available in the 2020 ACS, if there were fewer than 500 renter-occupied housing units, or if the sampling error associated with a county’s data was deemed too high.
The sampling error was defined as too high if the coefficient of variation — a statistical assessment of how reliable an estimate is — for a county’s median gross rent was above 15% and greater than two standard deviations above the mean CV for all counties’ median gross rents. We similarly excluded counties that had a sampling error too high for their population, using the same definition.
Counties were ranked based on the median gross rent. To break ties, we used the median gross rent as a share of household income.
Additional information on median gross rent as a share of household income, share of households occupied by renters, and median home value are also five-year estimates from the 2020 ACS.
In 20 Years, I Haven’t Seen A Cash Back Card This Good
Credit card companies are at war, handing out free rewards and benefits to win the best customers. A good cash back card can be worth thousands of dollars a year in free money, not to mention other perks like travel, insurance, and access to fancy lounges. Our top pick today has pays up to 5% cash back, a $200 bonus on top, and $0 annual fee. Click here to apply before they stop offering rewards this generous.
Flywheel Publishing has partnered with CardRatings for our coverage of credit card products. Flywheel Publishing and CardRatings may receive a commission from card issuers.
Thank you for reading! Have some feedback for us?
Contact the 24/7 Wall St. editorial team.
 24/7 Wall St.


 24/7 Wall St.
 24/7 Wall St.
 24/7 Wall St.