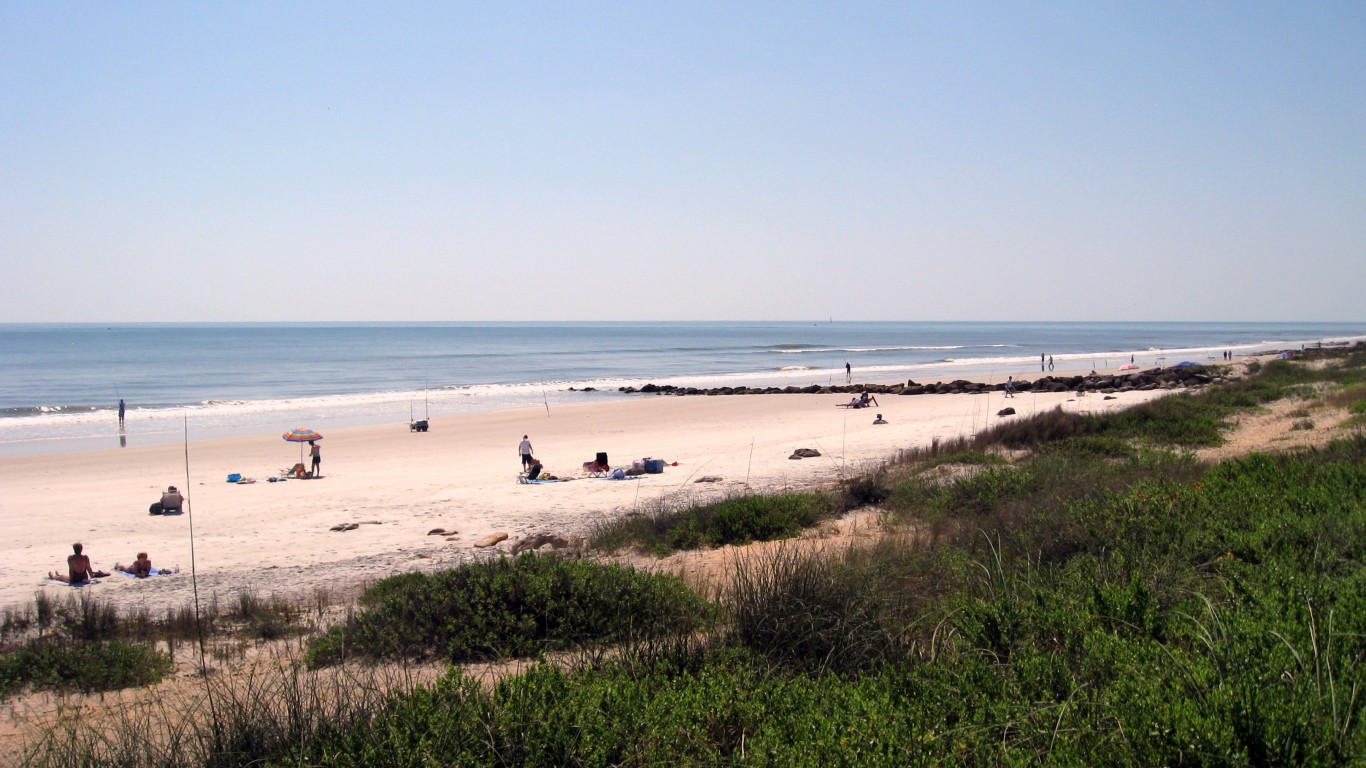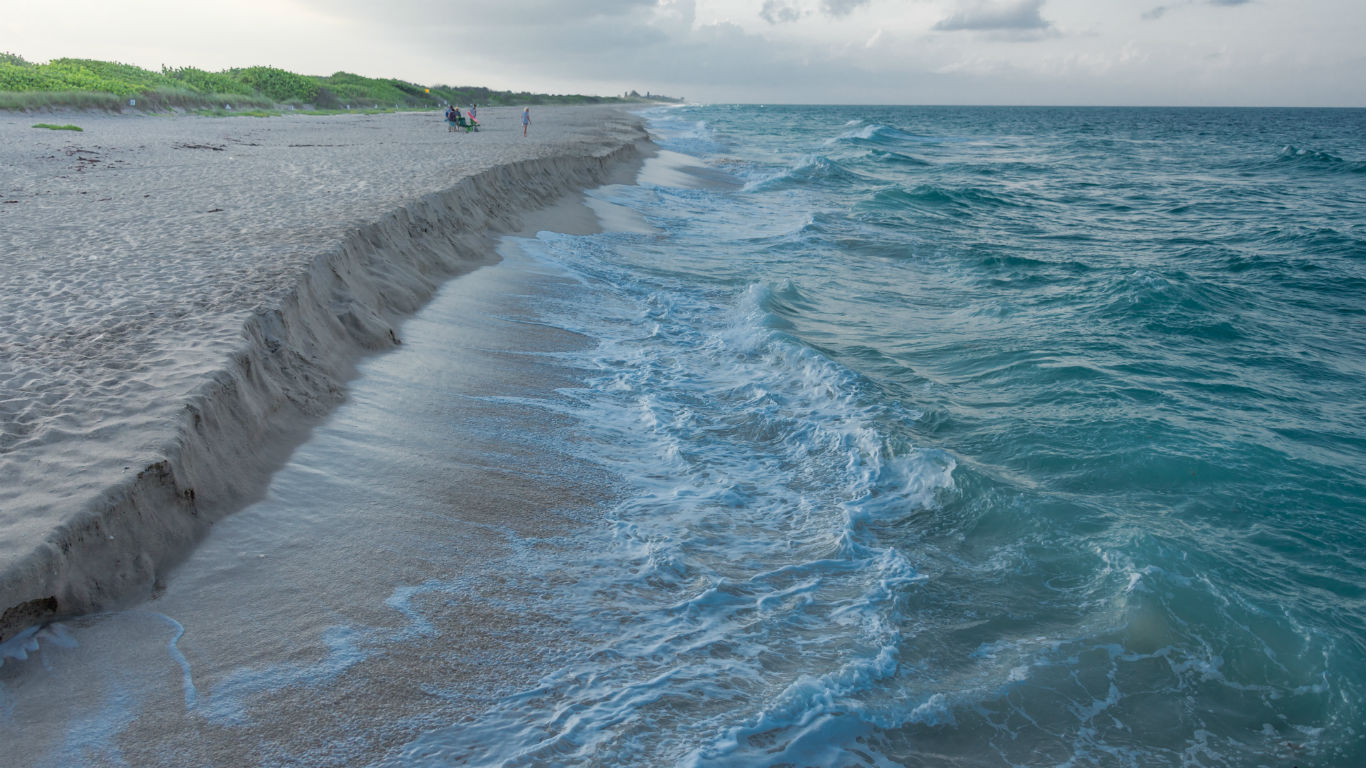
Beach communities are well familiar with such hazards as storms, floods, and erosion. And with more frequent and intense rainstorms associated with rising sea levels, the problems created by these weather events will get worse with the climate emergency, according to the U.S. Environmental Protection Agency. Already, some of America’s most popular beaches have lost a considerable amount of shoreline.
To identify 30 popular beaches at the greatest risk of disappearing, 24/7 Tempo calculated the compound average growth rate of shoreline length for more than 600 “significant public beaches” in the United States between the most recent and oldest years for which data was available using beach length statistics compiled by the EPA. For the average beach, the change in shoreline was calculated for the period from 2008 to 2017. For a broader international perspective on this subject, see the countries doing the most and least to protect the environment.
Many of the U.S. beaches that have shrunk considerably in recent years are also among the smallest beaches, usually located on the Virgin Islands. To capture the magnitude of the problem of erosion across the nation’s coastal states, we only considered beaches that are 1 mile long or greater.
Storms, floods, and erosion — and their continued intensification — threaten approximately $1 trillion held in coastal real estate across the United States, according to The Intergovernmental Panel on Climate Change Fourth Assessment Report. Some of the nation’s biggest cities are at significant risk — here are American cities that will soon be underwater.
In addition to losing a place where people can enjoy the sun and water — and with it the recreational and commercial value from fishing, tourism, and other commerce — erosion can have serious environmental consequences. At risk are a range of unique plant and animal habitats, as well as the buffer sand dunes provide against high winds and waves from storms.
Click here to see 30 popular beaches at the greatest risk of disappearing due to erosion.
Click here to see our full methodology
30. Daytona Beach Shores at Dunlawton, Volusia County, FL
> Avg. annual beach loss: -6.6%
> Beach length 2008: 5.4 miles
> Beach length 2018: 2.7 miles (-49.5%)
> Area population change (2013-2017): 496,268 to 518,660 (+4.5%)
> Avg. monthly precipitation: 4.36 inches
[in-text-ad]
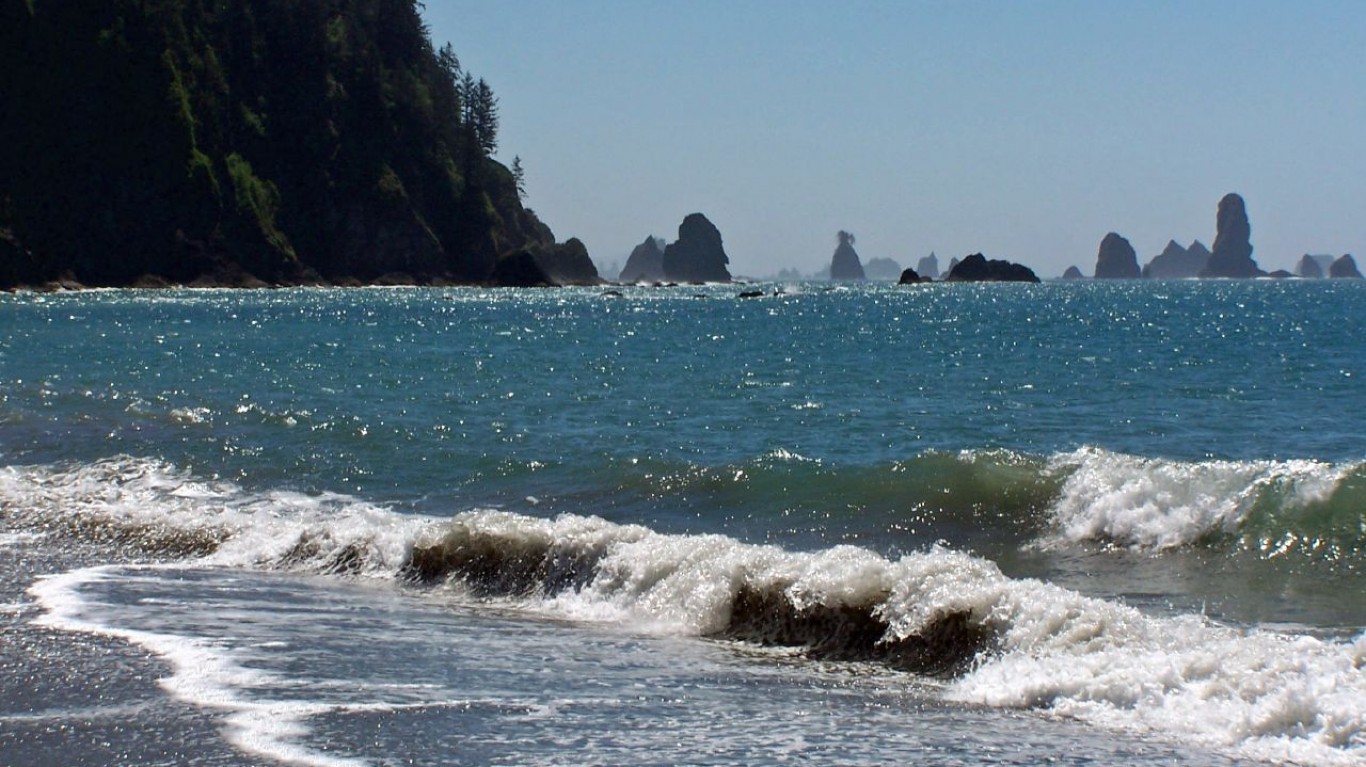
29. Third Beach, Olympic National Park, Jefferson County, WA
> Avg. annual beach loss: -6.6%
> Beach length 2007: 4.6 miles
> Beach length 2011: 3.5 miles (-23.9%)
> Area population change (2013-2017): 29,882 to 30,524 (+2.1%)
> Avg. monthly precipitation: 9.23 inches
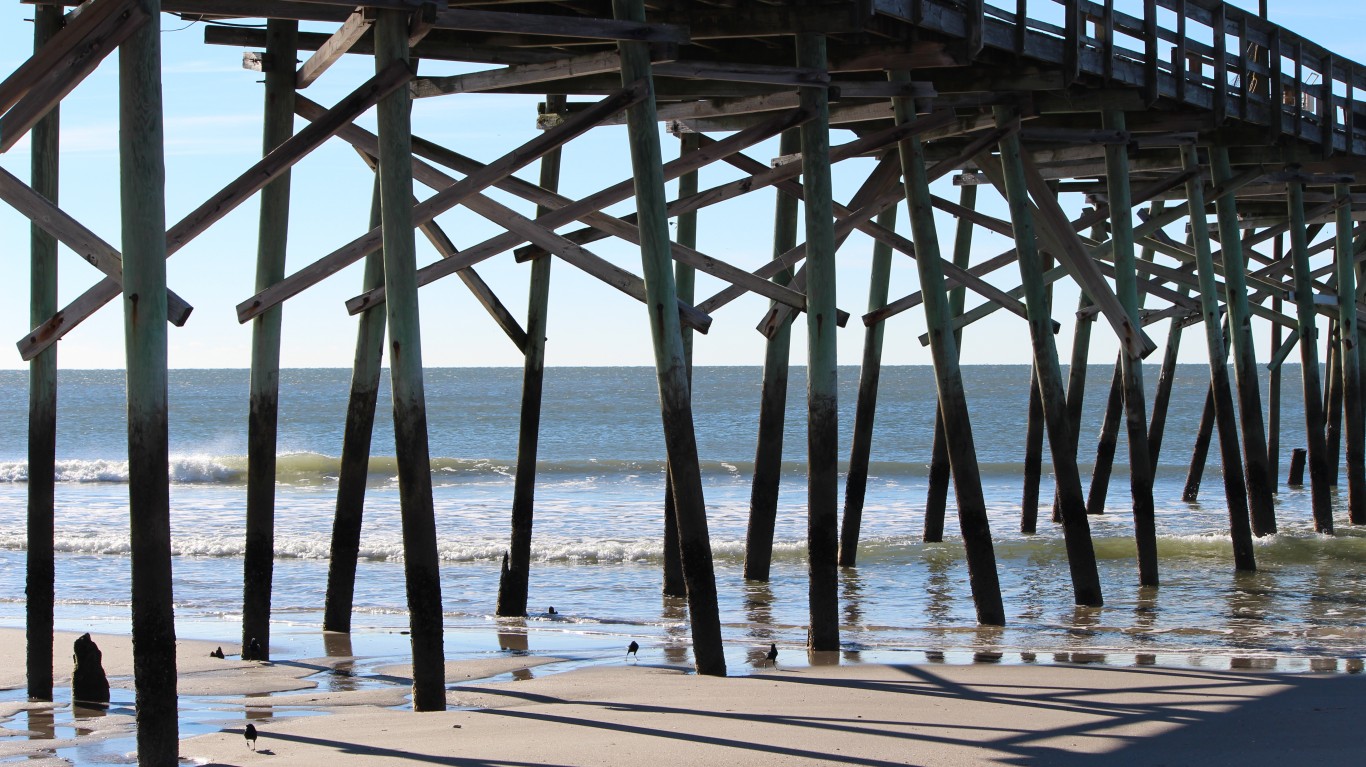
28. Holden Beach Pier, Brunswick County, NC
> Avg. annual beach loss: -7.1%
> Beach length 2007: 4.6 miles
> Beach length 2018: 2.0 miles (-55.5%)
> Area population change (2013-2017): 110,324 to 122,586 (+11.1%)
> Avg. monthly precipitation: 4.45 inches

27. Kalaloch Beach & Campground, Olympic National Park, Jefferson County, WA
> Avg. annual beach loss: -7.1%
> Beach length 2007: 4.6 miles
> Beach length 2011: 3.4 miles (-25.6%)
> Area population change (2013-2017): 29,882 to 30,524 (+2.1%)
> Avg. monthly precipitation: 9.23 inches
[in-text-ad-2]

26. Squalicum Beach, Whatcom County, WA
> Avg. annual beach loss: -7.6%
> Beach length 2008: 2.7 miles
> Beach length 2011: 2.1 miles (-21.1%)
> Area population change (2013-2017): 203,211 to 212,738 (+4.7%)
> Avg. monthly precipitation: 6.05 inches

25. Port Crescent, Clallam County, WA
> Avg. annual beach loss: -7.7%
> Beach length 2008: 3.6 miles
> Beach length 2010: 3.1 miles (-14.8%)
> Area population change (2013-2017): 71,731 to 73,439 (+2.4%)
> Avg. monthly precipitation: 7.94 inches
[in-text-ad]
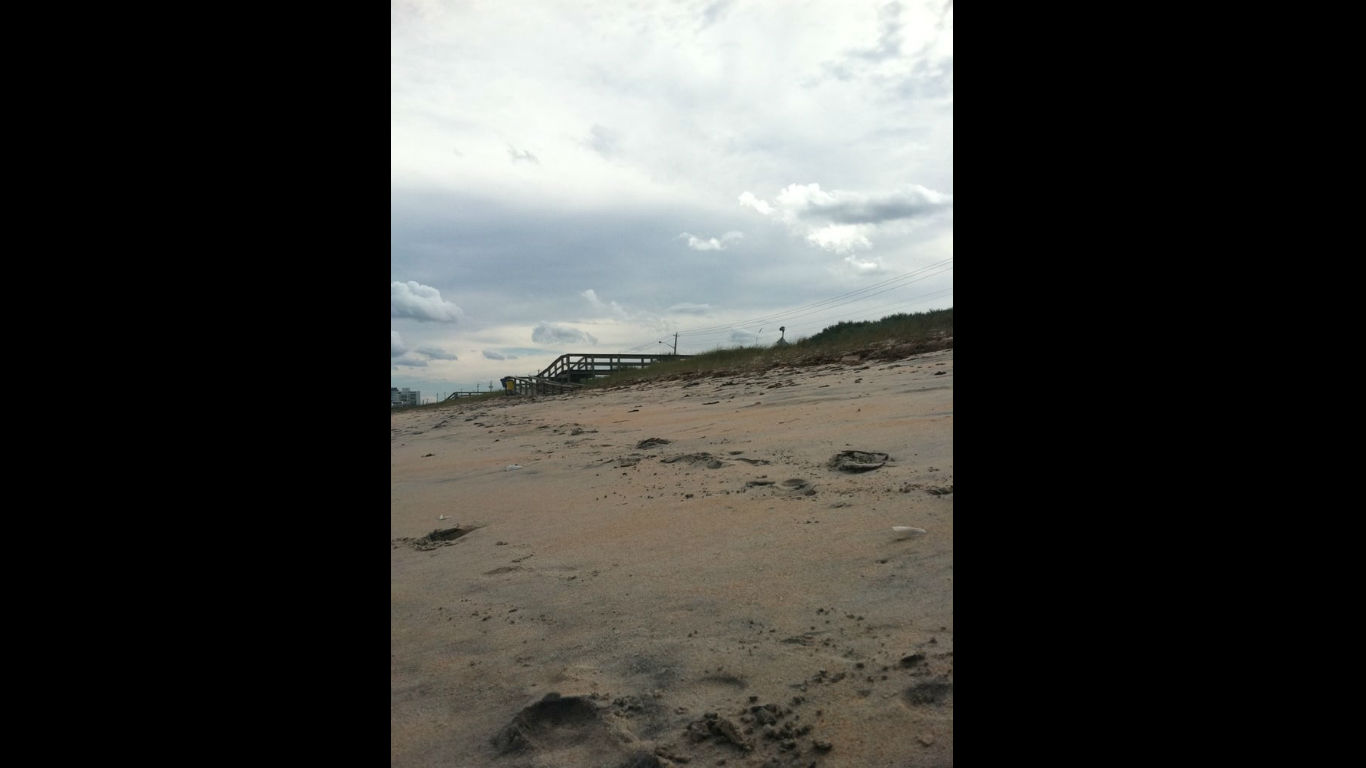
24. North Ormond Beach, Volusia County, FL
> Avg. annual beach loss: -7.7%
> Beach length 2008: 12.4 miles
> Beach length 2018: 5.5 miles (-55.3%)
> Area population change (2013-2017): 496,268 to 518,660 (+4.5%)
> Avg. monthly precipitation: 4.36 inches
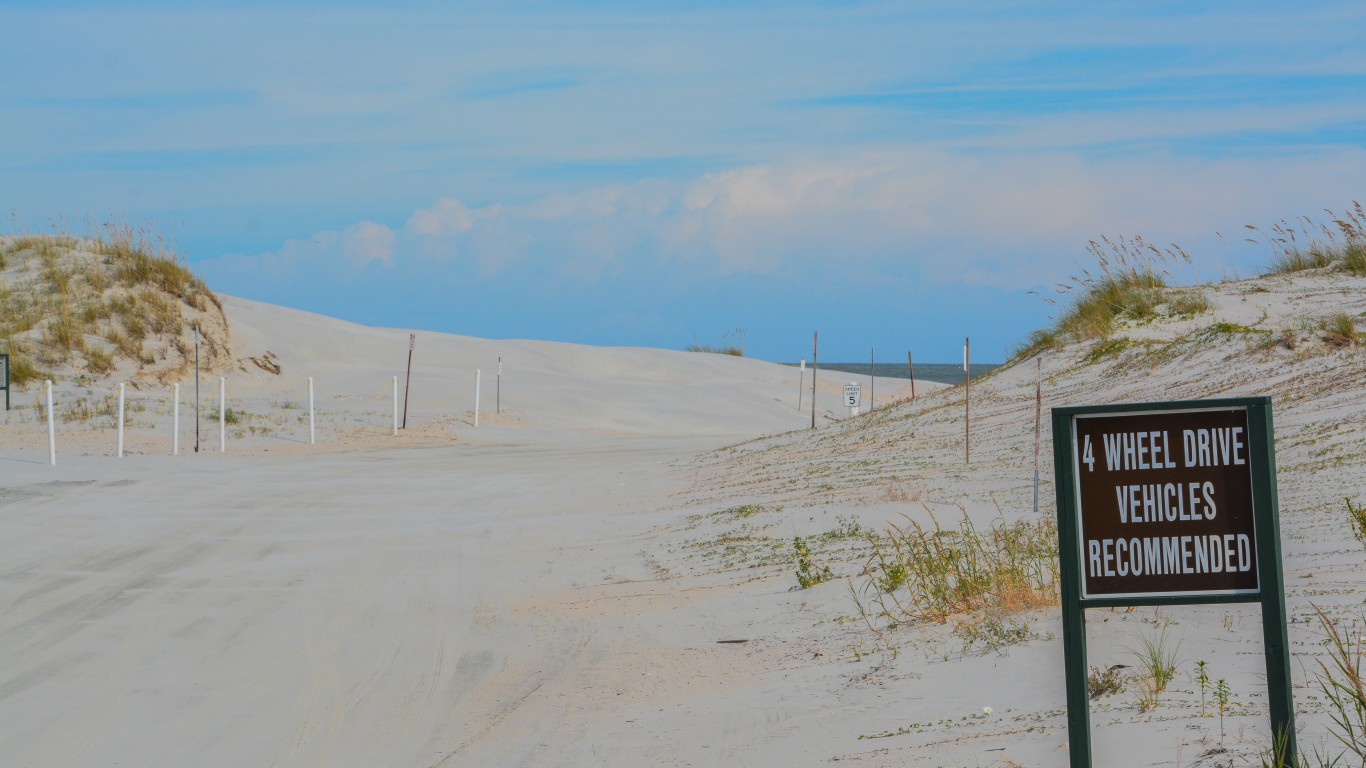
23. Huguenot Park, Duval County, FL
> Avg. annual beach loss: -8.1%
> Beach length 2008: 3.0 miles
> Beach length 2018: 1.3 miles (-57.1%)
> Area population change (2013-2017): 872,598 to 912,043 (+4.5%)
> Avg. monthly precipitation: 4.23 inches
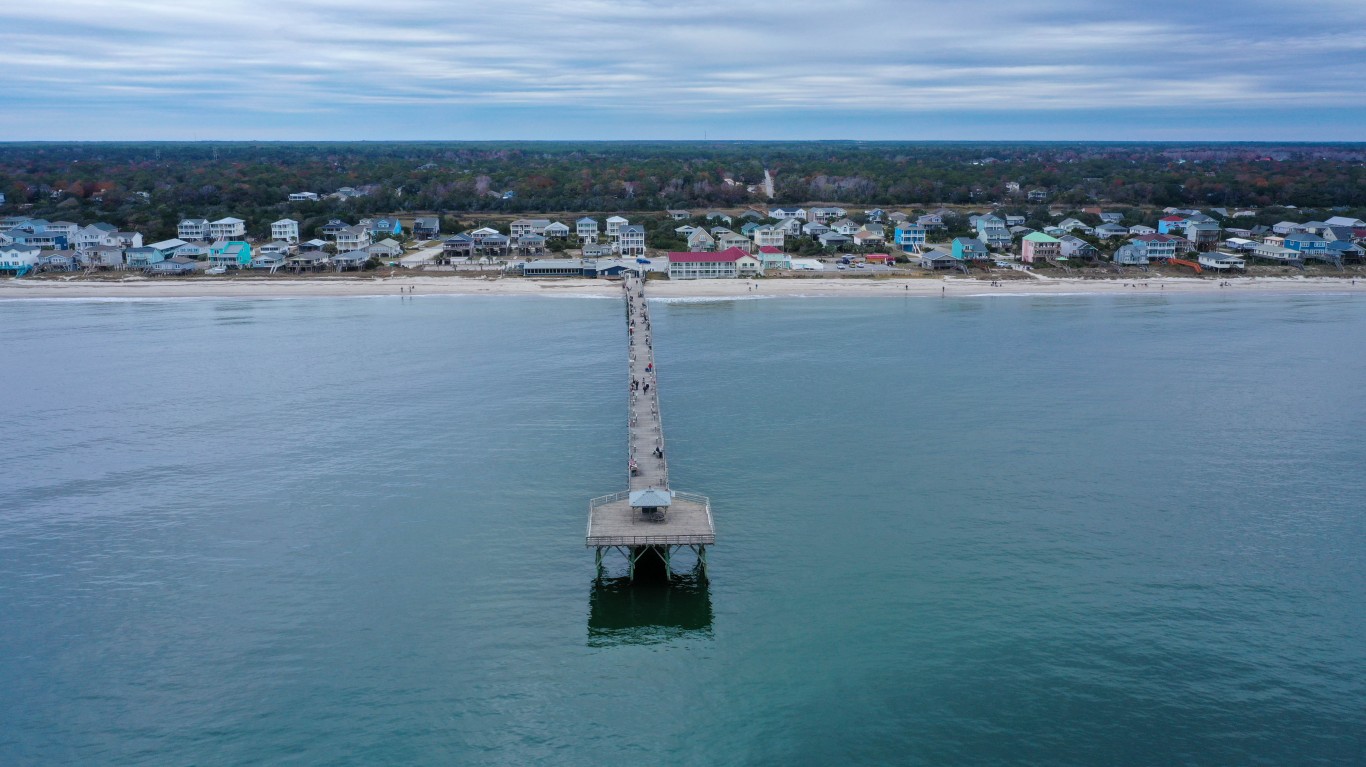
22. Ocean Crest Fishing Pier, Brunswick County, NC
> Avg. annual beach loss: -8.4%
> Beach length 2007: 3.2 miles
> Beach length 2018: 1.2 miles (-61.7%)
> Area population change (2013-2017): 110,324 to 122,586 (+11.1%)
> Avg. monthly precipitation: 4.45 inches
[in-text-ad-2]
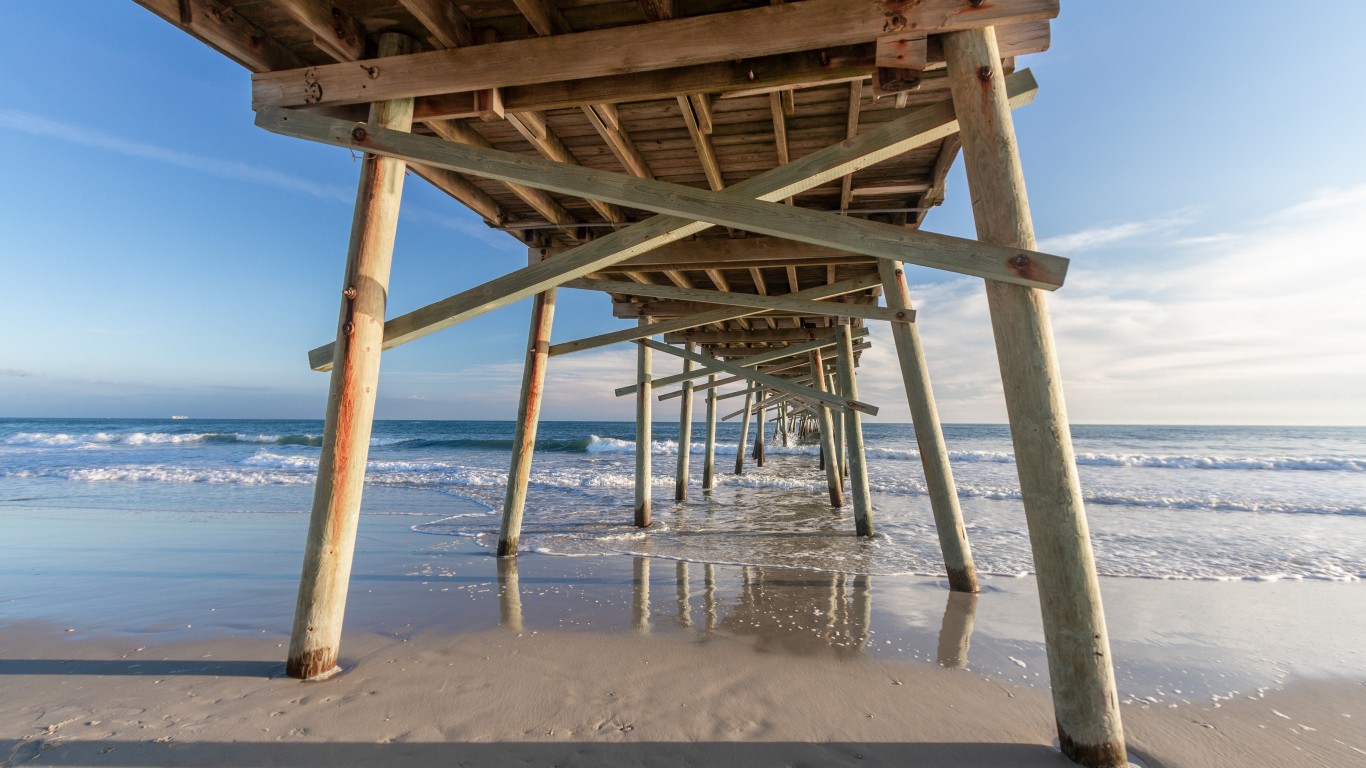
21. Ocean Isle Beach Pier, Brunswick County, NC
> Avg. annual beach loss: -8.4%
> Beach length 2007: 2.9 miles
> Beach length 2018: 1.1 miles (-61.9%)
> Area population change (2013-2017): 110,324 to 122,586 (+11.1%)
> Avg. monthly precipitation: 4.45 inches
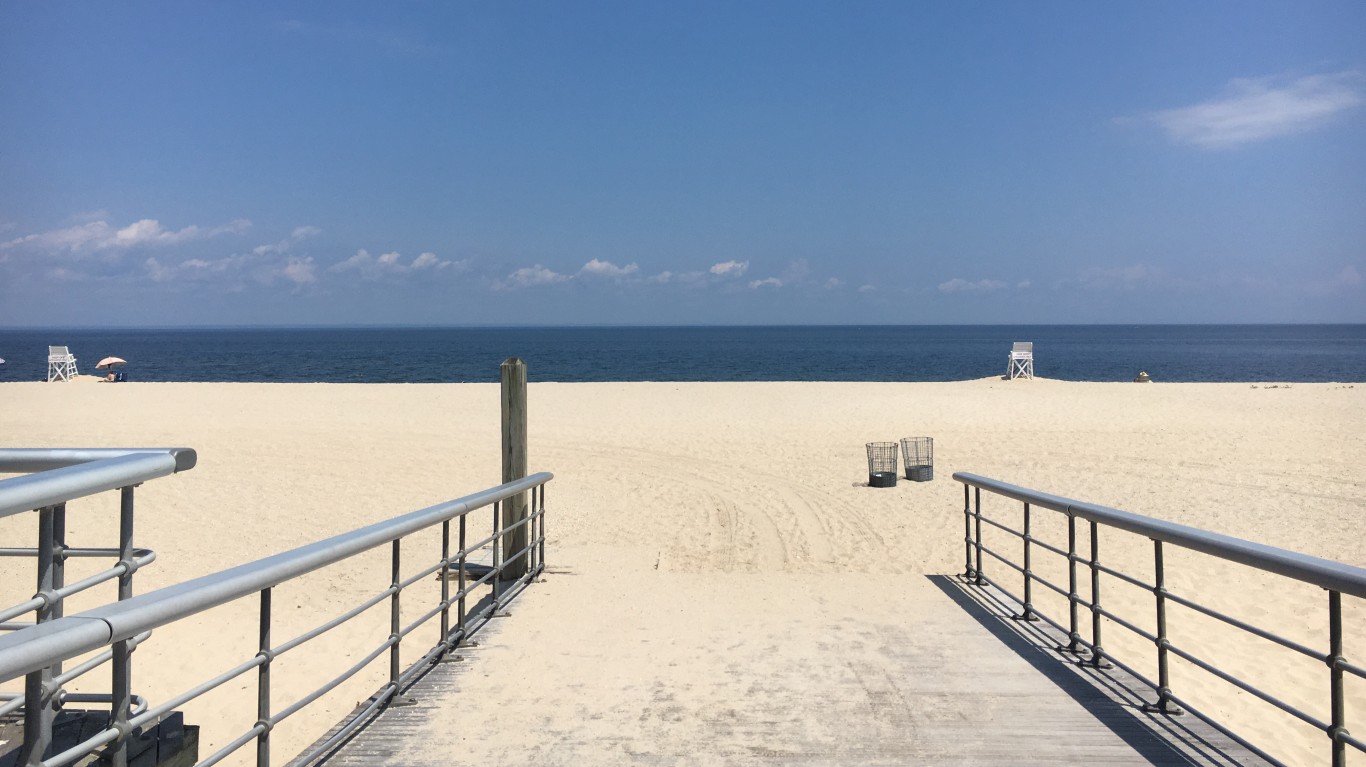
20. Sunken Meadow State Park, Suffolk County, NY
> Avg. annual beach loss: -8.5%
> Beach length 2007: 3.0 miles
> Beach length 2018: 1.1 miles (-62.3%)
> Area population change (2013-2017): 1,495,803 to 1,497,595 (+0.1%)
> Avg. monthly precipitation: 3.90 inches
[in-text-ad]
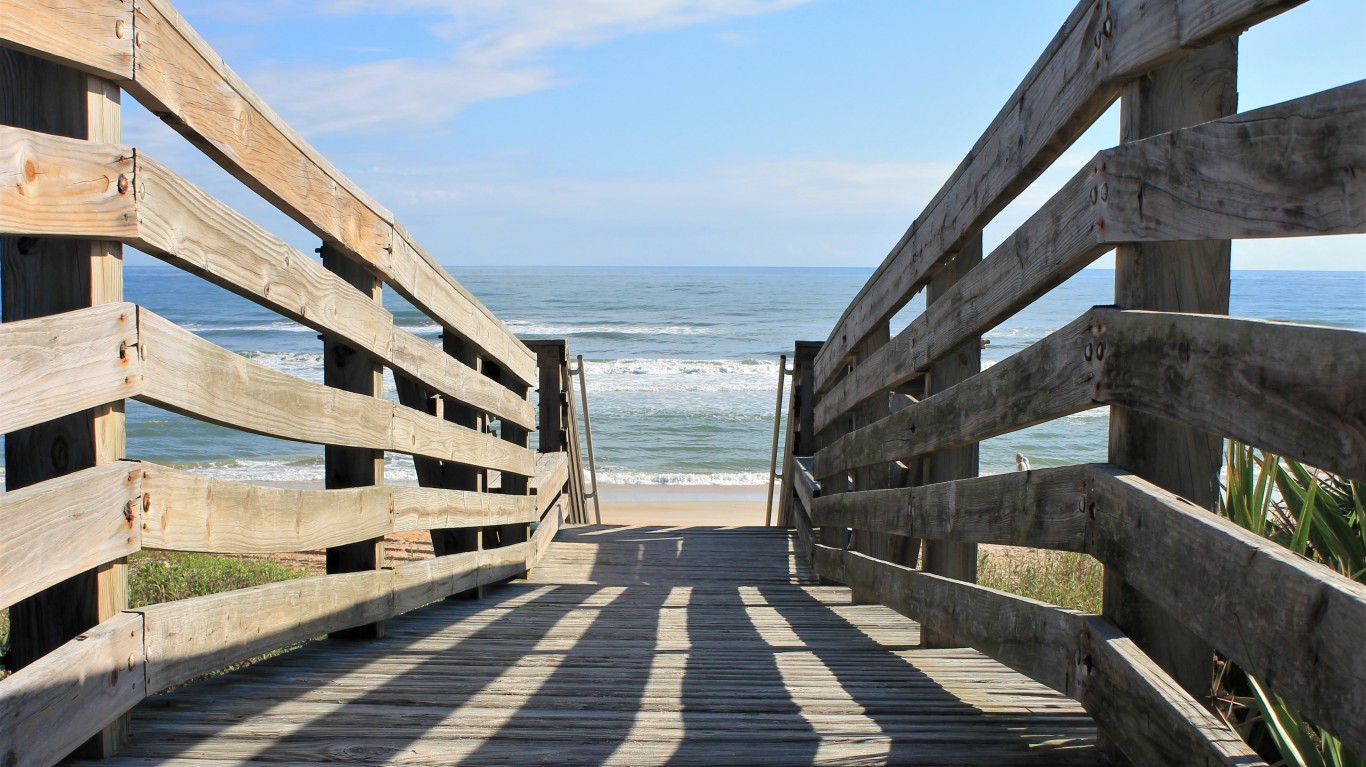
19. Ormond Beach, Volusia County, FL
> Avg. annual beach loss: -8.7%
> Beach length 2008: 6.3 miles
> Beach length 2018: 2.5 miles (-59.9%)
> Area population change (2013-2017): 496,268 to 518,660 (+4.5%)
> Avg. monthly precipitation: 4.36 inches
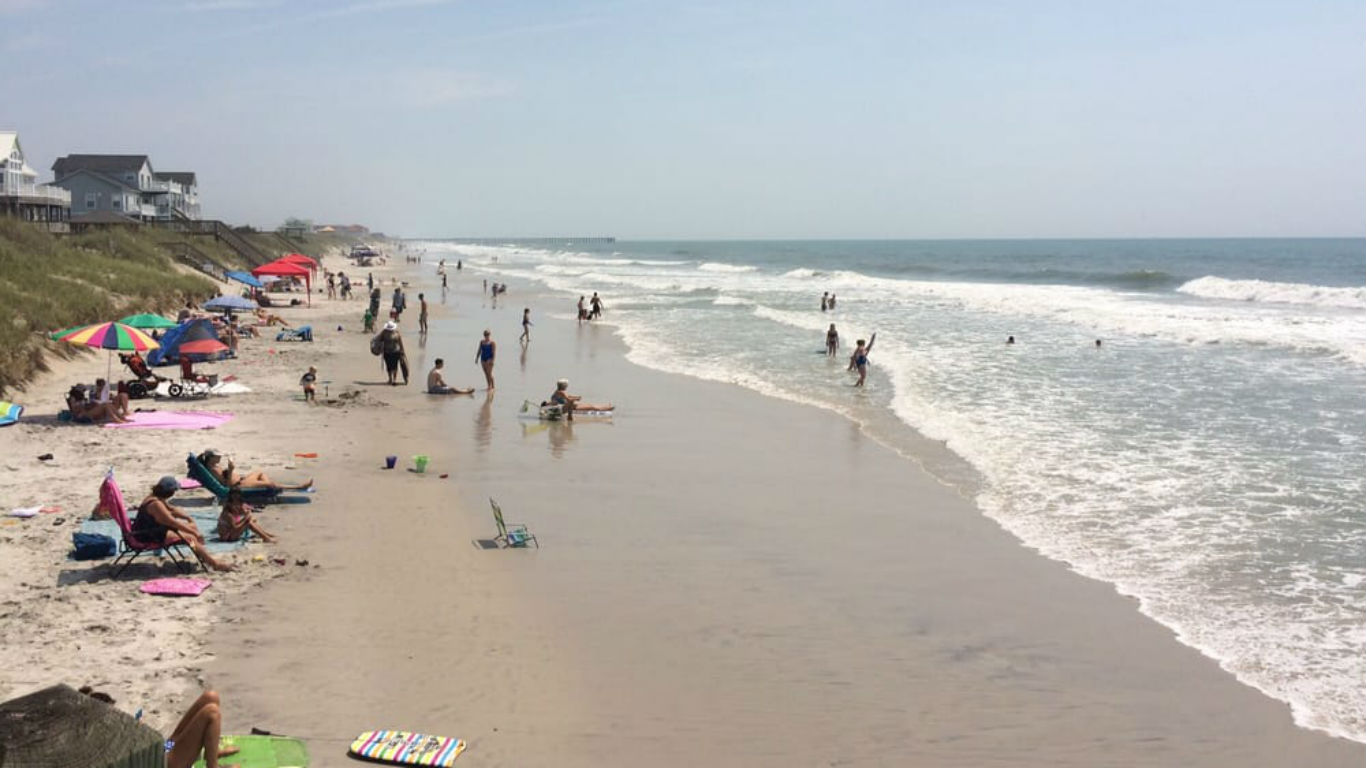
18. Onslow County Parks: Beach Access #4, Onslow County, NC
> Avg. annual beach loss: -8.8%
> Beach length 2008: 5.4 miles
> Beach length 2018: 2.1 miles (-60.2%)
> Area population change (2013-2017): 179,935 to 192,685 (+7.1%)
> Avg. monthly precipitation: 4.44 inches
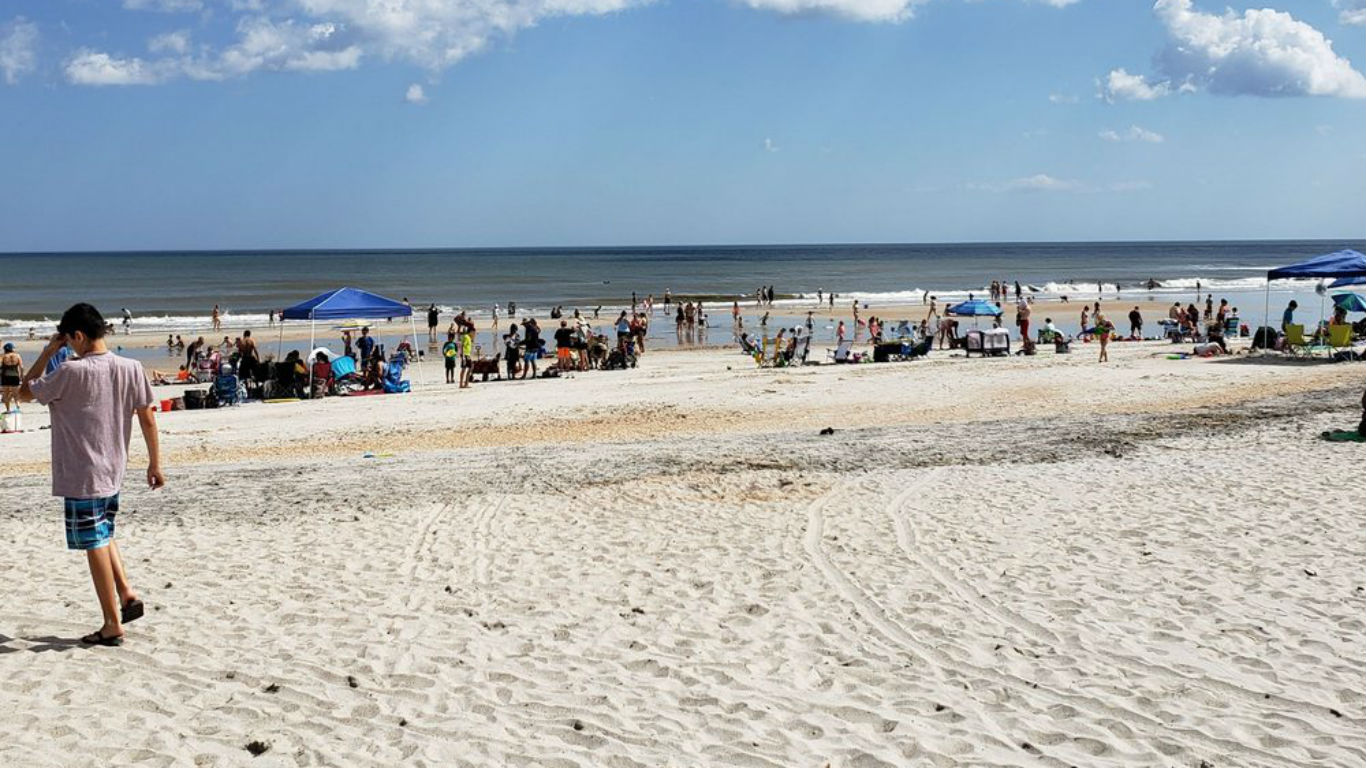
17. Mickler’s Landing, St. Johns County, FL
> Avg. annual beach loss: -9.2%
> Beach length 2008: 12.4 miles
> Beach length 2018: 4.7 miles (-61.8%)
> Area population change (2013-2017): 197,115 to 226,578 (+14.9%)
> Avg. monthly precipitation: 4.23 inches
[in-text-ad-2]
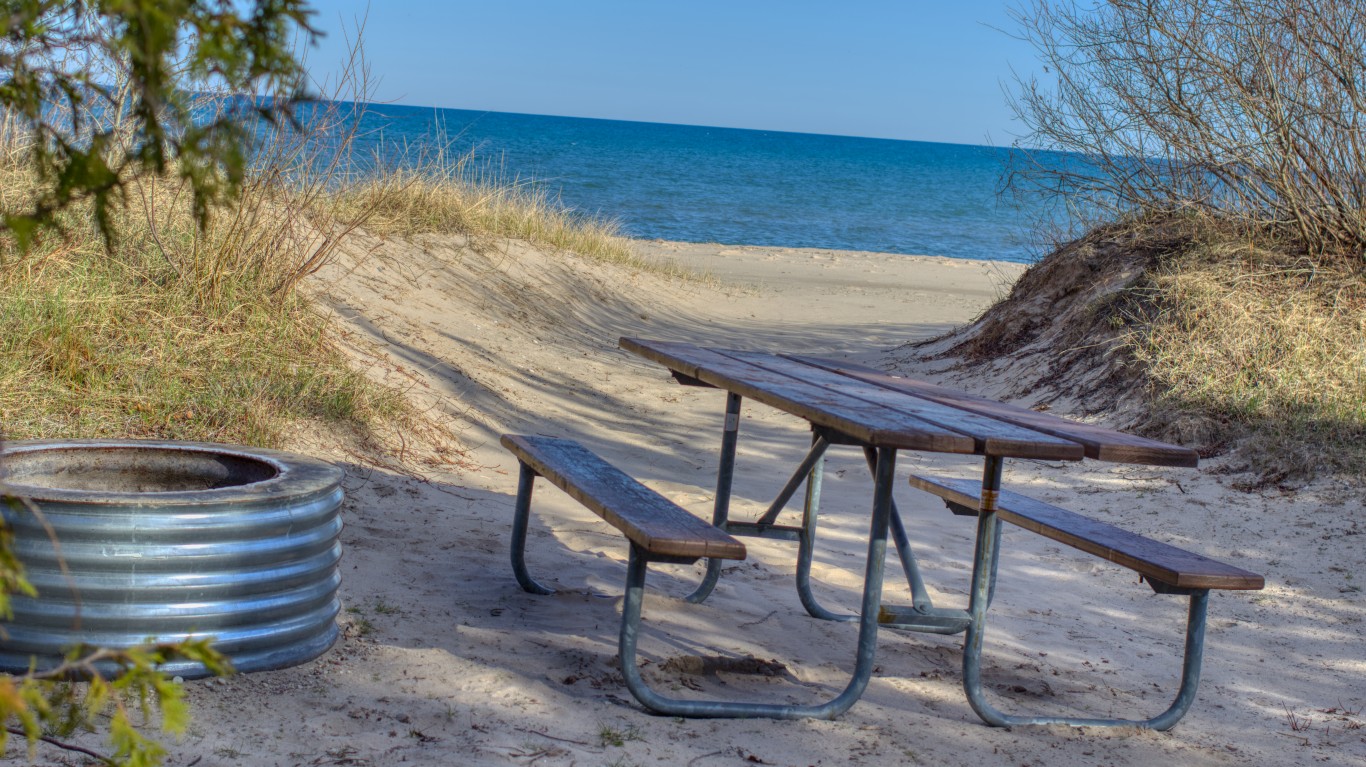
16. Public Shoreline Beach, Portage Bay, Delta County, MI
> Avg. annual beach loss: -9.9%
> Beach length 2007: 6.9 miles
> Beach length 2018: 2.2 miles (-68.1%)
> Area population change (2013-2017): 36,967 to 36,395 (+-1.5%)
> Avg. monthly precipitation: 2.57 inches
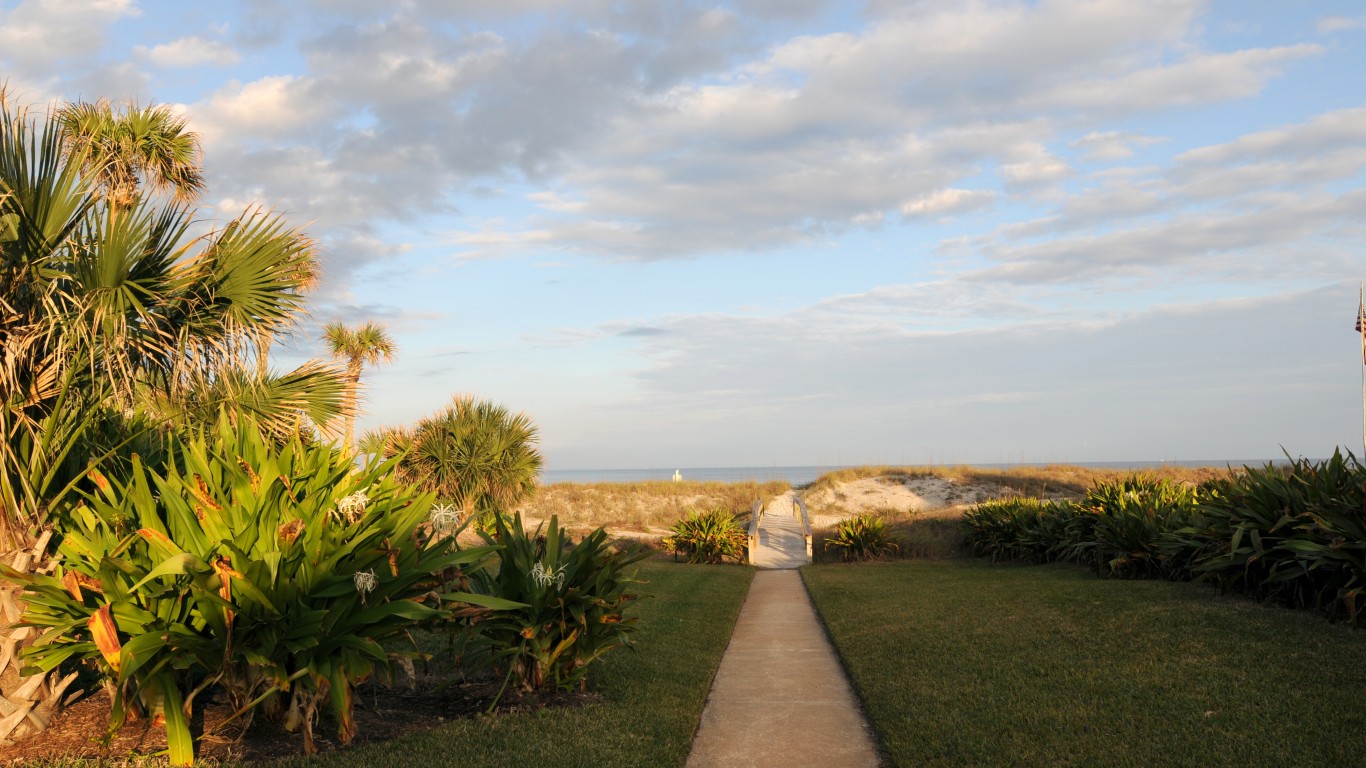
15. Neptune Beach, Duval County, FL
> Avg. annual beach loss: -10.1%
> Beach length 2008: 3.6 miles
> Beach length 2018: 1.2 miles (-65.5%)
> Area population change (2013-2017): 872,598 to 912,043 (+4.5%)
> Avg. monthly precipitation: 4.23 inches
[in-text-ad]

14. Semiahmoo County Park, Whatcom County, WA
> Avg. annual beach loss: -10.3%
> Beach length 2007: 3.2 miles
> Beach length 2013: 1.7 miles (-48.0%)
> Area population change (2013-2017): 203,211 to 212,738 (+4.7%)
> Avg. monthly precipitation: 6.05 inches
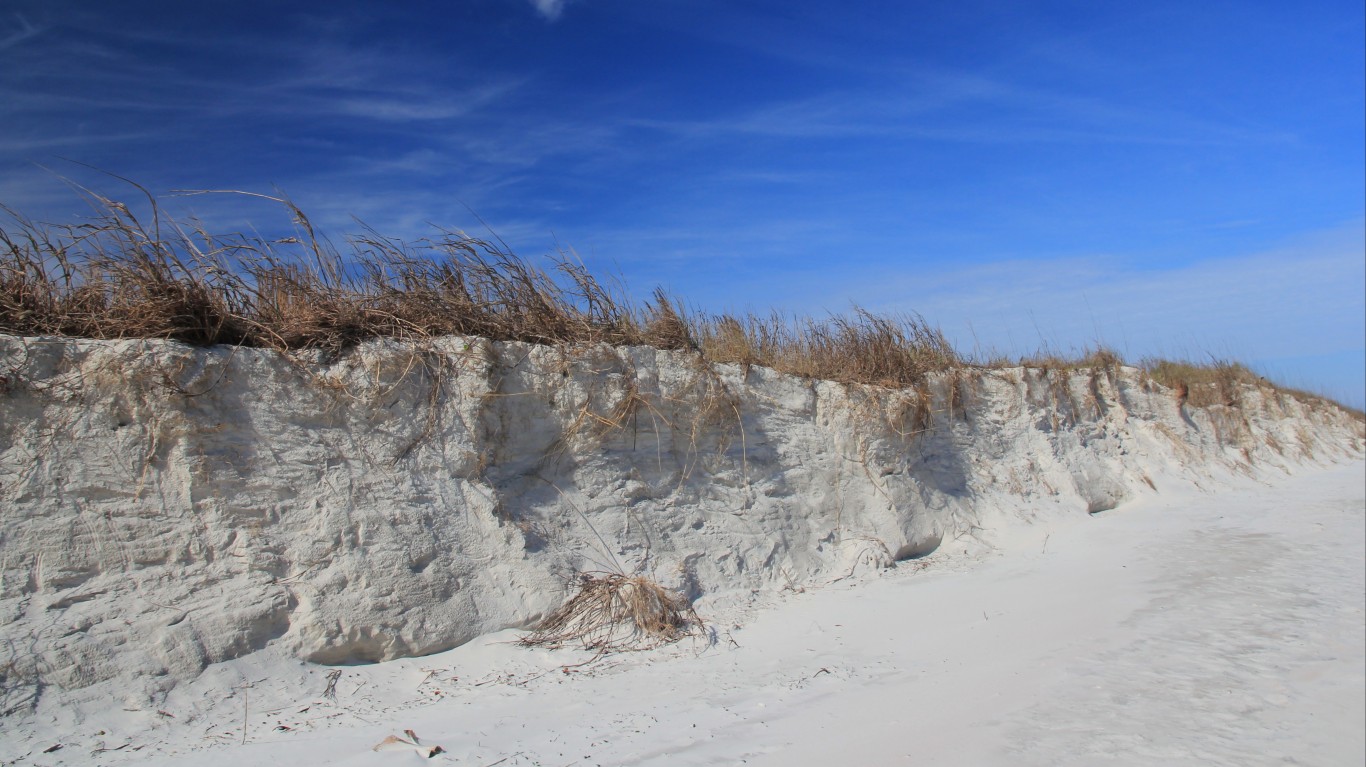
13. Daytona Beach Shores at Florida Shores Boulevard, Volusia County, FL
> Avg. annual beach loss: -10.3%
> Beach length 2008: 3.6 miles
> Beach length 2018: 1.2 miles (-66.5%)
> Area population change (2013-2017): 496,268 to 518,660 (+4.5%)
> Avg. monthly precipitation: 4.36 inches
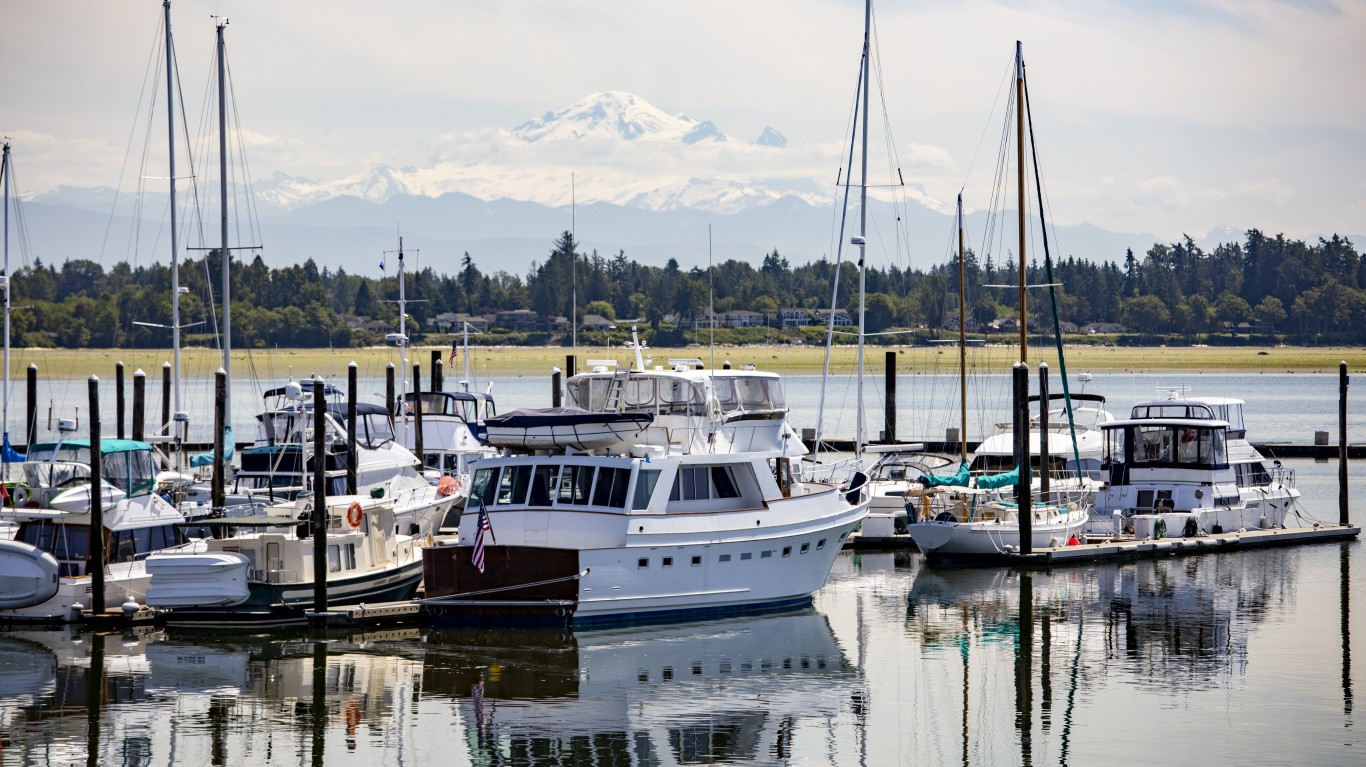
12. Drayton Harbor, Whatcom County, WA
> Avg. annual beach loss: -10.5%
> Beach length 2008: 1.9 miles
> Beach length 2011: 1.4 miles (-28.2%)
> Area population change (2013-2017): 203,211 to 212,738 (+4.7%)
> Avg. monthly precipitation: 6.05 inches
[in-text-ad-2]
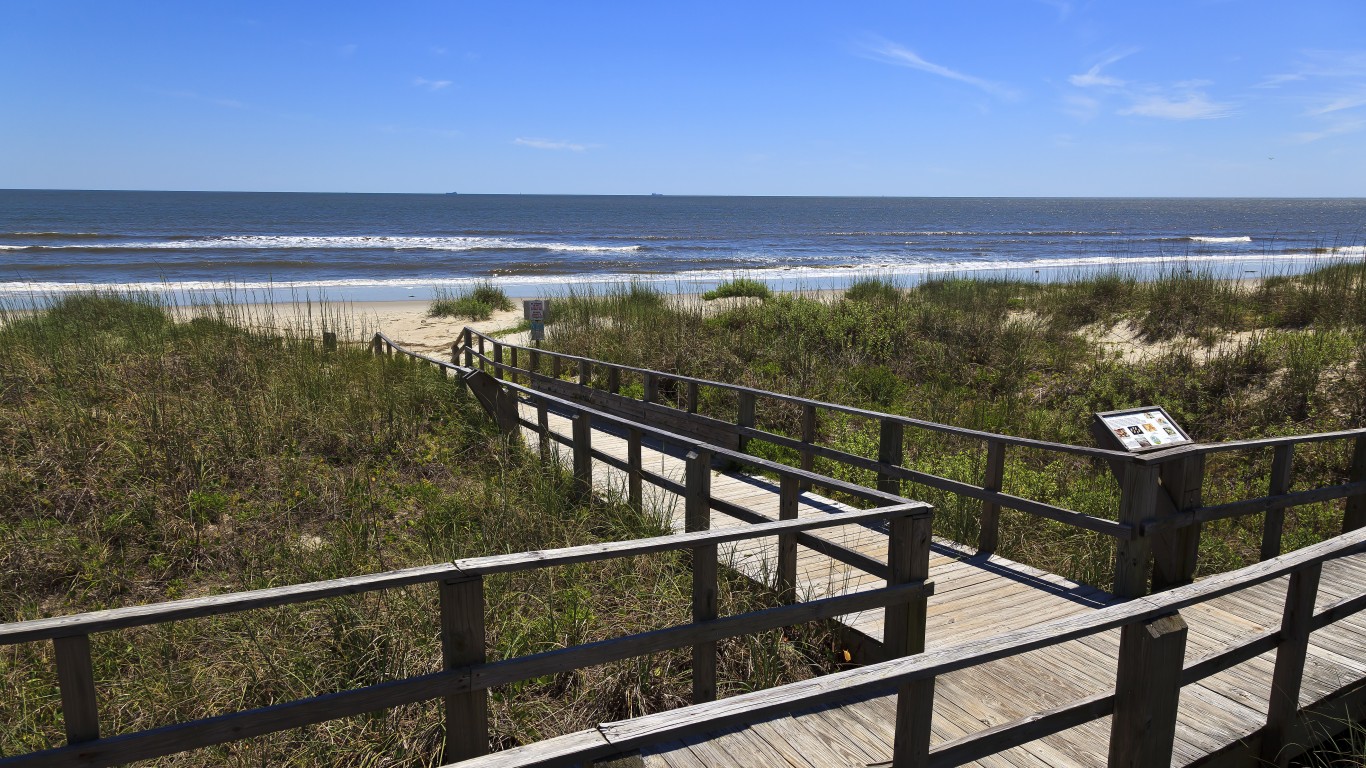
11. Caswell Beach, Public Beach Access, Brunswick County, NC
> Avg. annual beach loss: -10.8%
> Beach length 2007: 5.0 miles
> Beach length 2018: 1.4 miles (-71.6%)
> Area population change (2013-2017): 110,324 to 122,586 (+11.1%)
> Avg. monthly precipitation: 4.45 inches
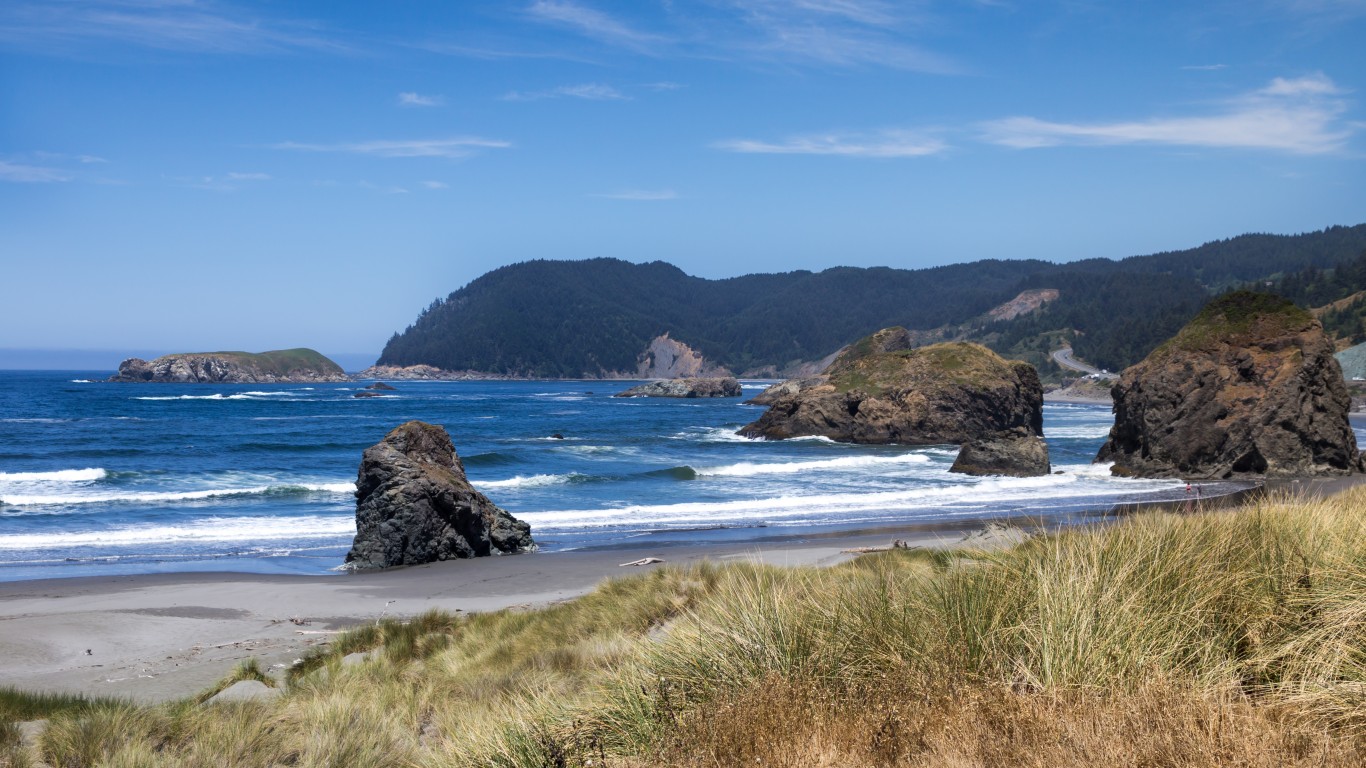
10. Meyers Beach, Curry County, OR
> Avg. annual beach loss: -12.5%
> Beach length 2007: 6.0 miles
> Beach length 2018: 1.4 miles (-77.0%)
> Area population change (2013-2017): 22,361 to 22,377 (+0.1%)
> Avg. monthly precipitation: 8.35 inches
[in-text-ad]
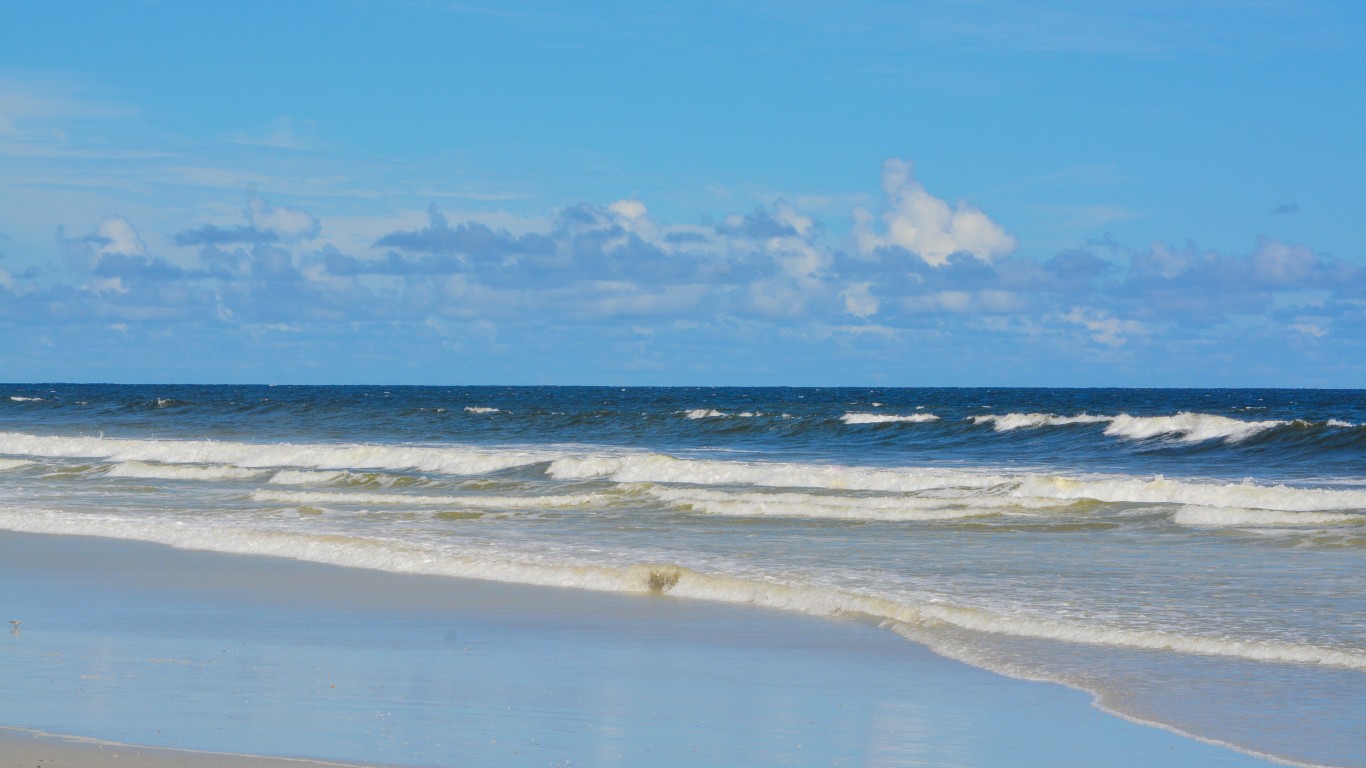
9. Atlantic Beach, Duval County, FL
> Avg. annual beach loss: -12.6%
> Beach length 2008: 4.0 miles
> Beach length 2018: 1.0 miles (-73.9%)
> Area population change (2013-2017): 872,598 to 912,043 (+4.5%)
> Avg. monthly precipitation: 4.23 inches
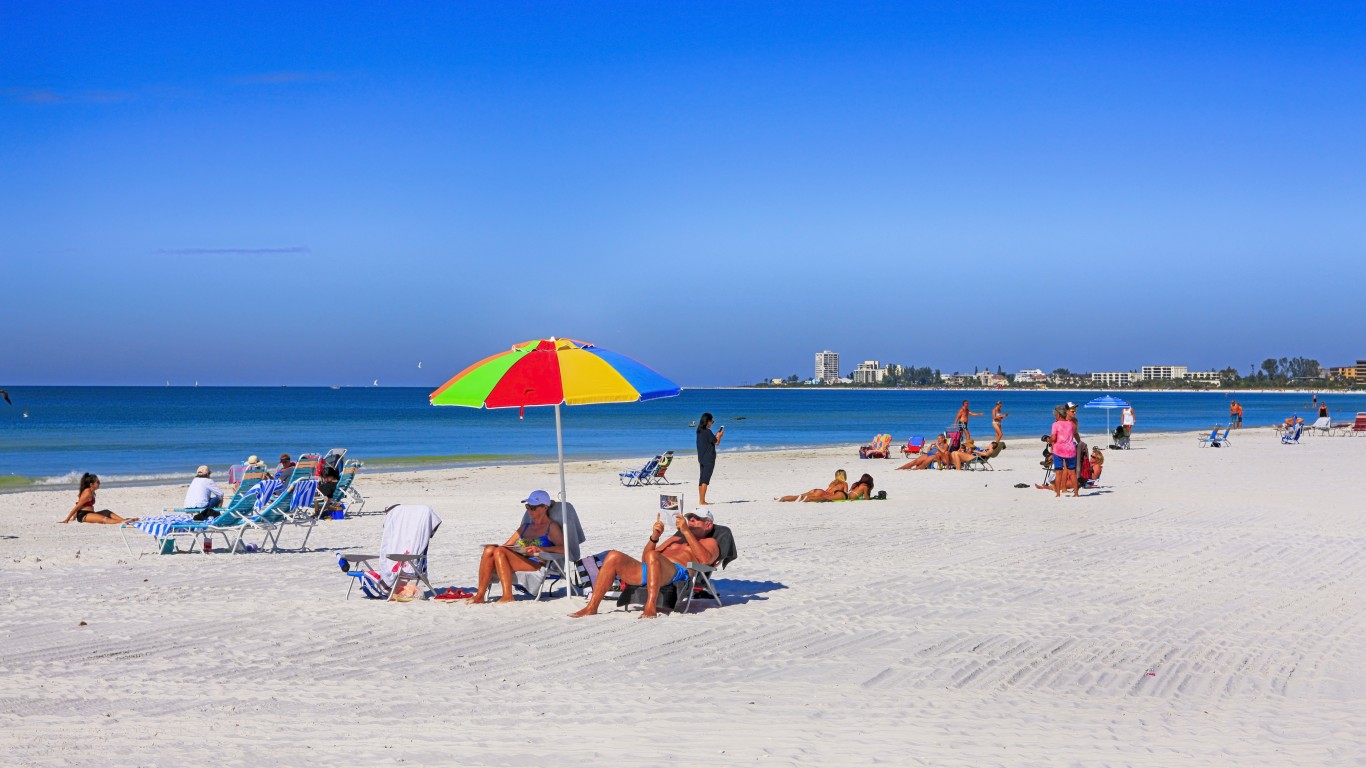
8. Crescent Beach, St. Johns County, FL
> Avg. annual beach loss: -13.5%
> Beach length 2008: 9.9 miles
> Beach length 2018: 2.3 miles (-76.5%)
> Area population change (2013-2017): 197,115 to 226,578 (+14.9%)
> Avg. monthly precipitation: 4.23 inches
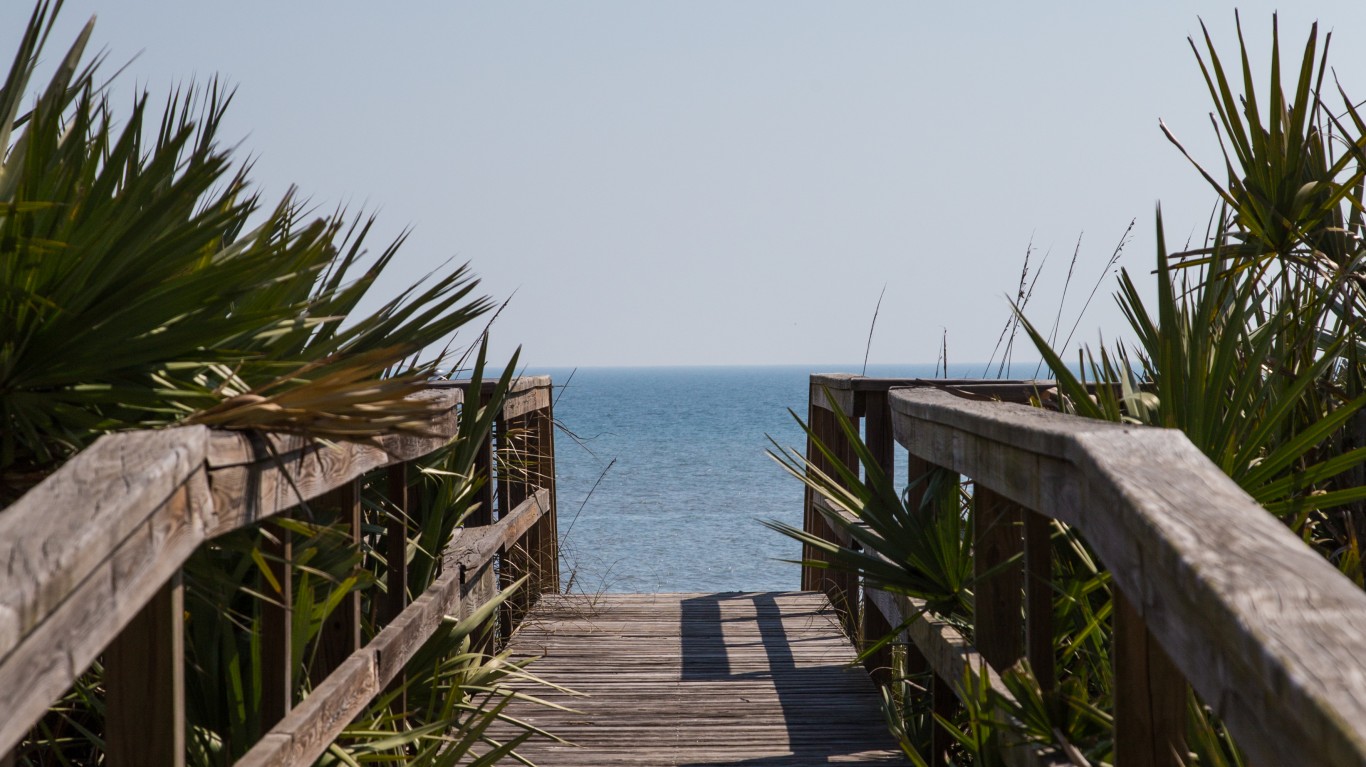
7. Gamble Rogers State Park, Flagler County, FL
> Avg. annual beach loss: -15.0%
> Beach length 2008: 5.5 miles
> Beach length 2018: 1.1 miles (-80.4%)
> Area population change (2013-2017): 97,301 to 105,015 (+7.9%)
> Avg. monthly precipitation: 4.22 inches
[in-text-ad-2]
6. Picknickers/Beverly Beach, Flagler County, FL
> Avg. annual beach loss: -17.0%
> Beach length 2008: 15.4 miles
> Beach length 2018: 2.4 miles (-84.4%)
> Area population change (2013-2017): 97,301 to 105,015 (+7.9%)
> Avg. monthly precipitation: 4.22 inches
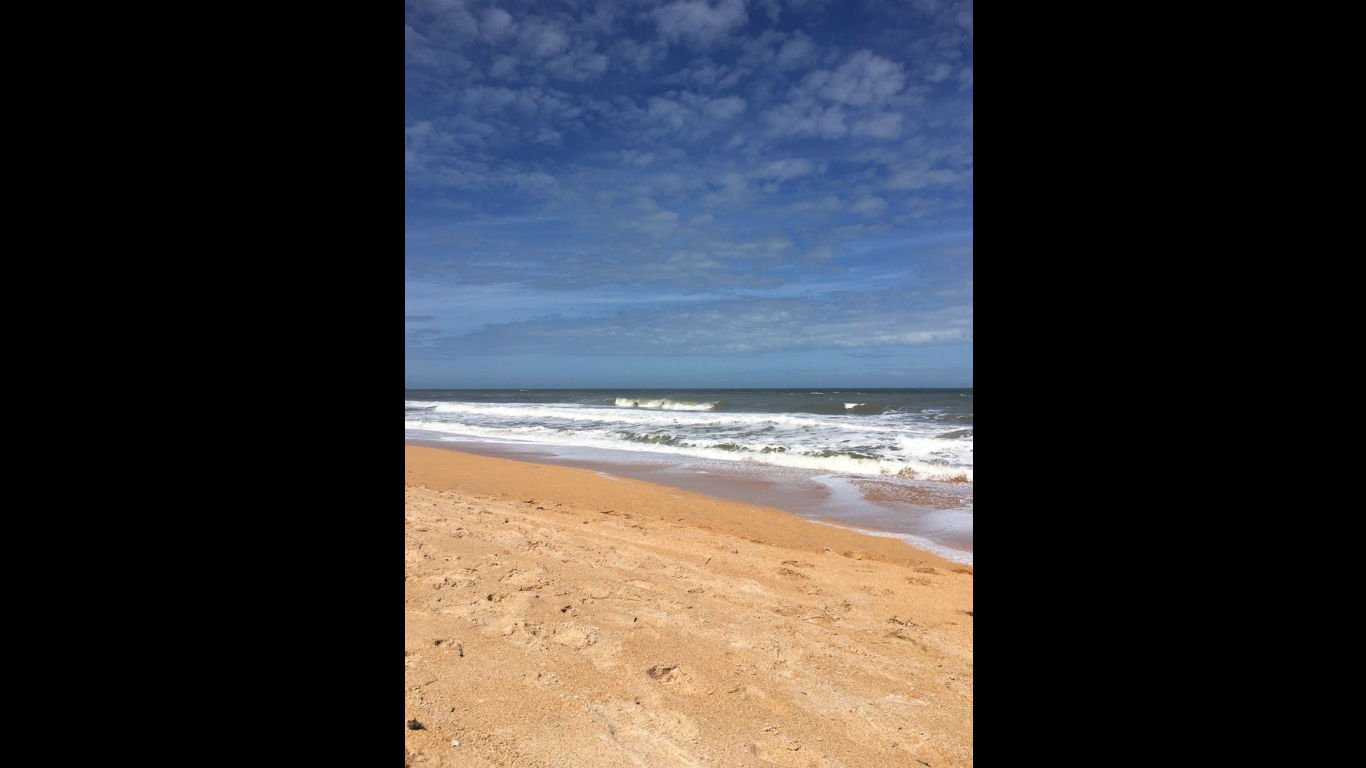
5. Varn Park, Flagler County, FL
> Avg. annual beach loss: -17.2%
> Beach length 2008: 14.2 miles
> Beach length 2018: 2.1 miles (-84.9%)
> Area population change (2013-2017): 97,301 to 105,015 (+7.9%)
> Avg. monthly precipitation: 4.22 inches
[in-text-ad]

4. San Diego Bay, San Diego County, CA
> Avg. annual beach loss: -22.5%
> Beach length 2007: 49.1 miles
> Beach length 2018: 3.0 miles (-94.0%)
> Area population change (2013-2017): 3,138,265 to 3,283,665 (+4.6%)
> Avg. monthly precipitation: 1.21 inches
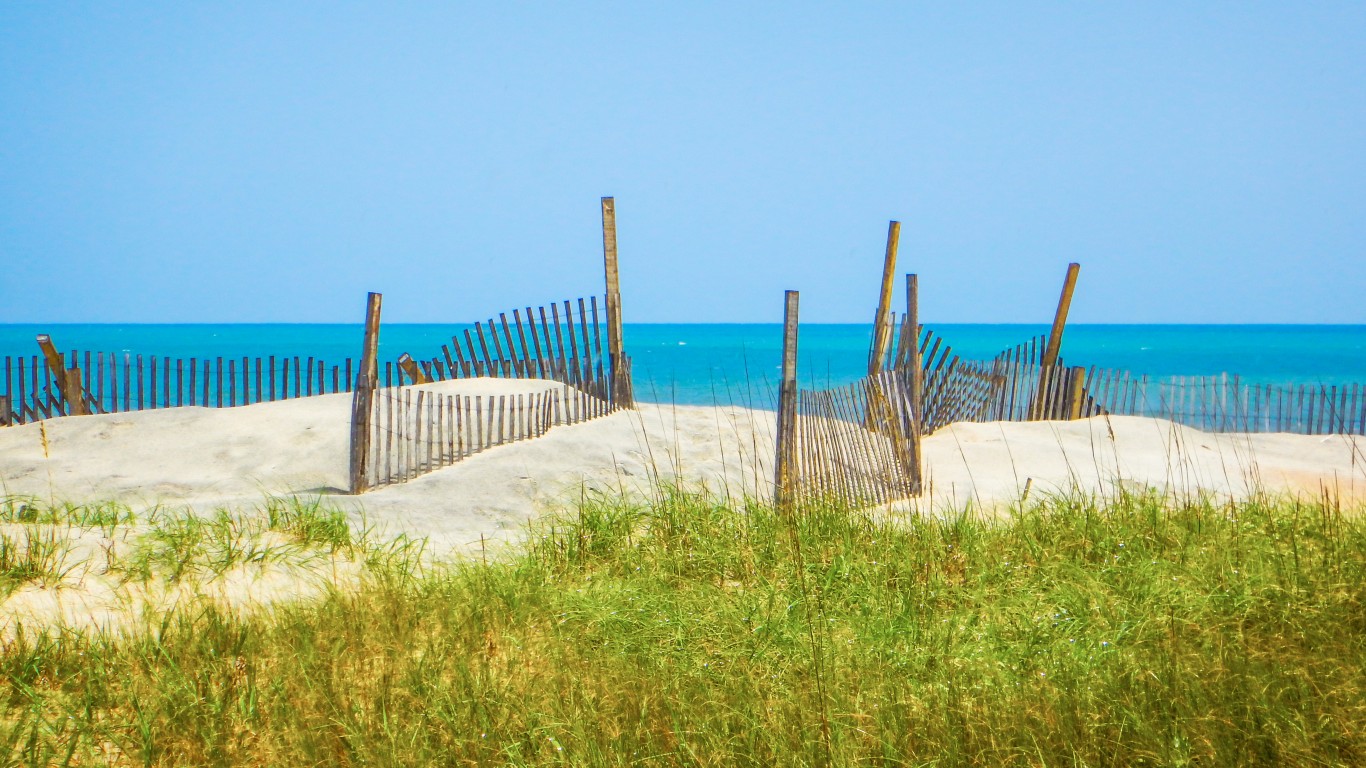
3. Ocean-Side Beach, North Of Cape Point A, Carteret County, NC
> Avg. annual beach loss: -23.0%
> Beach length 2007: 56.7 miles
> Beach length 2018: 3.2 miles (-94.3%)
> Area population change (2013-2017): 67,198 to 68,699 (+2.2%)
> Avg. monthly precipitation: 4.53 inches

2. Back Bay Beach, Virginia Beach County, VA
> Avg. annual beach loss: -41.1%
> Beach length 2014: 10.8 miles
> Beach length 2018: 1.3 miles (-88.0%)
> Area population change (2013-2017): 442,151 to 450,057 (+0.0%)
> Avg. monthly precipitation: 3.78 inches
[in-text-ad-2]
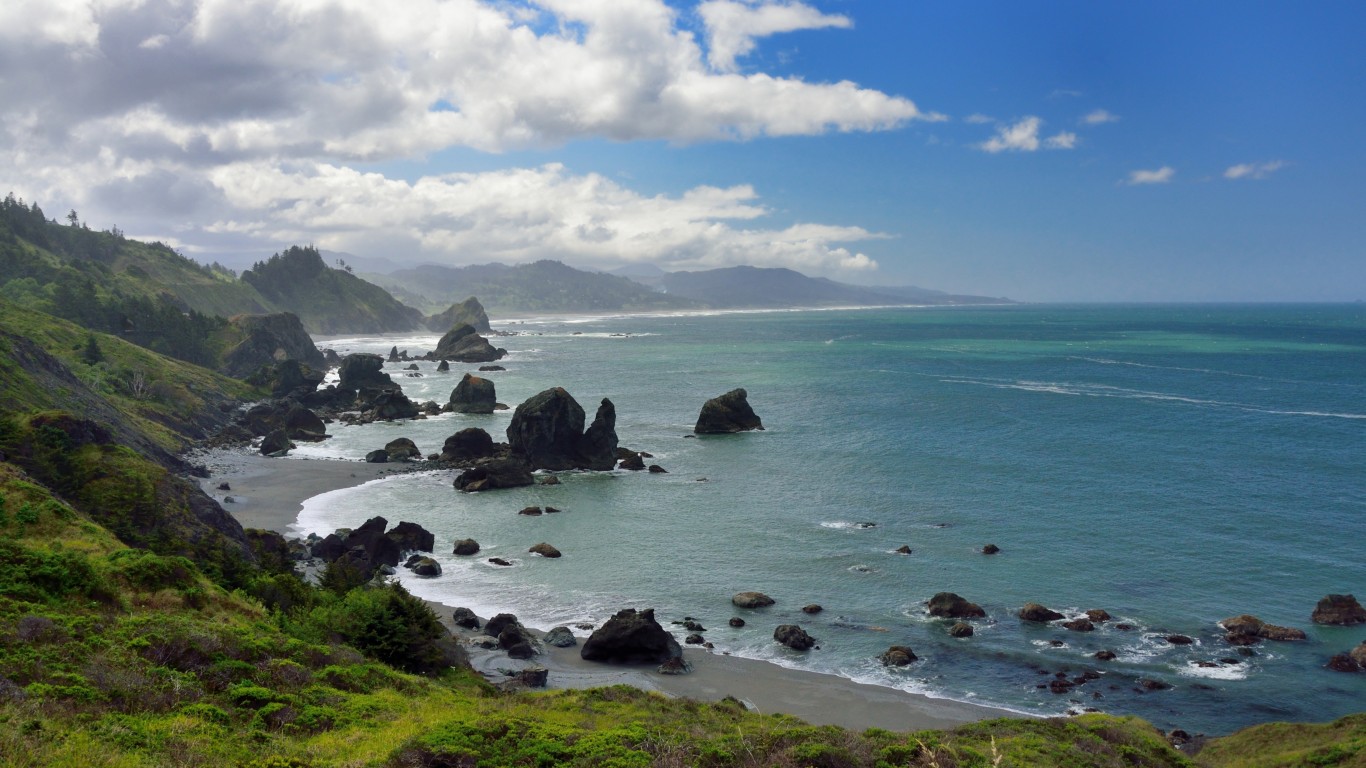
1. Nesika Beach, Curry County, OR
> Avg. annual beach loss: -47.9%
> Beach length 2007: 51.0 miles
> Beach length 2011: 3.8 miles (-92.6%)
> Area population change (2013-2017): 22,361 to 22,377 (+0.1%)
> Avg. monthly precipitation: 8.35 inches
To identify 30 popular beaches at the greatest risk of disappearing due to erosion, 24/7 Tempo calculated the compound average growth rate of shoreline length for more than 600 “significant public beaches” between the most recent and oldest years for which data was available for each beach, using beach length statistics compiled by the U.S. Environmental Protection Agency. For the average beach, the change in shoreline was calculated for the period from 2008 to 2017. Significant public beaches, defined as the beaches that coastal and Great Lakes states and territories identify as Tier 1, indicate a high-risk, high-use beach. States and territories must identify their Tier 1 beaches as part of their BEACH Act grant application.
Data on population change from 2013 to 2017 for the county each beach is located in came from the U.S. Census Bureau’s American Community Survey.
Average annual precipitation figures are from the Centers for Disease Control and Prevention’s North America Land Data Assimilation System and are averages for the period 1979 to 2011.
Want to Retire Early? Start Here (Sponsor)
Want retirement to come a few years earlier than you’d planned? Or are you ready to retire now, but want an extra set of eyes on your finances?
Now you can speak with up to 3 financial experts in your area for FREE. By simply clicking here you can begin to match with financial professionals who can help you build your plan to retire early. And the best part? The first conversation with them is free.
Click here to match with up to 3 financial pros who would be excited to help you make financial decisions.
Thank you for reading! Have some feedback for us?
Contact the 24/7 Wall St. editorial team.
 24/7 Wall St.
 24/7 Wall St.
 24/7 Wall St.